Unit:0_SciencePractice_UlitmateFlashcards
1/73
Earn XP
Name | Mastery | Learn | Test | Matching | Spaced | Call with Kai |
|---|
No analytics yet
Send a link to your students to track their progress
74 Terms
Critical Thinking
Description: Thinking that does not blindly accept arguments and conclusions. It examines assumptions, assesses the source, discerns hidden values, evaluates evidence, and assesses conclusions. Example: A student challenges the conclusions of a psychological study by analyzing the data and considering alternative explanations. Application: In AP Psychology, critical thinking is essential for interpreting research results and evaluating the strength of different psychological theories.
Biological Perspective
Description: A viewpoint that emphasizes the influence of biology on psychology, including genetics and the nervous system. Example: Research on the impact of neurotransmitters on mood disorders. Application: In AP Psychology, students learn how biological processes influence behavior and mental processes.
Cognitive Perspective
Description: Focuses on mental processes such as perception, memory, and problem-solving. Example: Studying how different memory techniques can enhance learning. Application: In AP Psychology, cognitive psychology is used to understand how people process information and make decisions.
Sociocultural Perspective
Description: Emphasizes the impact of culture and social environments on behavior and mental processes. Example: Research on how cultural expectations shape parenting styles. Application: In AP Psychology, students explore the role of social influences on individual behavior.
Humanistic Perspective
Description: A psychological approach that emphasizes personal growth and the concept of self-actualization. Example: Carl Rogers' client-centered therapy focusing on self-esteem and individual potential. Application: In AP Psychology, the humanistic perspective is used in discussing therapeutic practices.
Behavioral Perspective
Description: Focuses on observable behaviors and the ways they're learned through interaction with the environment. Example: Pavlov's experiments with classical conditioning in dogs. Application: In AP Psychology, the behavioral perspective is crucial for understanding how rewards and punishments shape behavior.
Psychodynamic Perspective
Description: Views behavior as a result of unconscious conflicts, often stemming from childhood experiences. Example: Freudian analysis of dreams. Application: In AP Psychology, students examine the impact of unconscious drives on behavior.
Evolutionary Perspective
Description: Investigates how evolutionary theory informs our understanding of human behavior and mental processes. Example: Examining mate selection strategies from an evolutionary standpoint. Application: In AP Psychology, the evolutionary perspective is used to explain behaviors as adaptations.
Hindsight Bias
Description: The tendency to see events as having been predictable after they have already occurred. Example: Believing you knew the outcome of a sports event after it happened. Application: In AP Psychology, recognizing hindsight bias helps students evaluate research conclusions.
Confirmation Bias
Description: The tendency to search for, interpret, and remember information that confirms one's preconceptions. Example: Ignoring evidence that contradicts your belief about a political issue. Application: In AP Psychology, understanding this bias is vital for scientific inquiry and objectivity.
Overconfidence
Description: The tendency to overestimate one's knowledge or abilities. Example: A student believing they will ace an exam without studying. Application: In AP Psychology, overconfidence can affect decision-making and risk assessment.
Peer Review
Description: An evaluation process where scholars assess each other's work before it gets published. Example: A psychologist submitting research for review to a journal. Application: In AP Psychology, peer review is essential for maintaining the quality and credibility of published research.
Hypothesis
Description: A testable prediction, often implied by a theory. Example: Predicting that sleep deprivation will affect test performance. Application: In AP Psychology, students form hypotheses for their own experiments.
Falsifiable
Description: A statement, hypothesis, or theory that can be proven false. Example: A hypothesis stating that high temperatures will decrease anxiety. Application: In AP Psychology, understanding falsifiability helps in conducting scientific research.
Operational Definition
Description: Defines a concept in terms of the actual procedures used by the researcher to measure it. Example: Defining 'anxiety' as a score on a specific anxiety inventory. Application: In AP Psychology, operational definitions are crucial for clear communication of research variables.
Replication
Description: Repeating the essence of a research study to see if the findings hold true in different contexts. Example: A study on memory is repeated with a new group of participants. Application: In AP Psychology, replication validates research results.
Survey
Description: Obtaining self-reported attitudes or behaviors of a group, usually through questioning a random sample. Example: A survey measuring students' stress levels during exams. Application: In AP Psychology, surveys are commonly used to gather large amounts of data.
Social Desirability Bias
Description: A type of response bias where individuals answer questions to appear favorable to others. Example: A respondent reporting that they exercise regularly to seem more socially acceptable. Application: In AP Psychology, understanding this bias is important for interpreting survey results.
Self-Report Bias
Description: A methodological issue arising when researchers ask people to describe their thoughts and behaviors. Example: A participant may underreport their negative behaviors such as smoking. Application: In AP Psychology, self-report bias affects the accuracy of research findings.
Population
Description: All individuals who can potentially participate in a study. Example: All high school students in the U.S. for a national educational survey. Application: In AP Psychology, defining the population is critical for research validity.
Random Sample
Description: A sample that fairly represents a population because each member has an equal chance of inclusion. Example: Randomly selecting participants from a database of all students. Application: In AP Psychology, random sampling improves the generalizability of research findings.
Sample
Description: A smaller group of individuals selected from a larger population. Example: 100 high school students chosen for a study on academic stress. Application: In AP Psychology, proper sampling techniques are important for valid research conclusions.
Sampling Bias
Description: A flawed sampling process that produces an unrepresentative sample. Example: Only surveying students from a single school. Application: In AP Psychology, recognizing sampling bias is essential for research integrity.
Convenience Sampling
Description: A non-probability sampling method where researchers select individuals based on their availability. Example: Surveying students at a local university. Application: In AP Psychology, convenience sampling can limit the generalizability of results.
Representative Sample
Description: A sample that accurately reflects the characteristics of the population. Example: A sample with similar gender, age, and socioeconomic status as the larger group. Application: In AP Psychology, having a representative sample is critical for accurate research conclusions.
Case Study
Description: An in-depth study of a singular subject or small group to reveal universal principles. Example: Analyzing an individual with a rare psychological condition. Application: In AP Psychology, case studies provide deep insights, while cautioning against overgeneralization.
Naturalistic Observation
Description: Observing behavior in natural environments without intervention. Example: Watching children play in a park without interference. Application: In AP Psychology, this method provides insights into authentic behavior.
Meta-Analysis
Description: A process of analyzing results from multiple studies measuring the same variables. Example: Analyzing several studies on ADHD to summarize findings. Application: In AP Psychology, meta-analysis helps consolidate research claims.
Experiment
Description: Measuring the relationship between two factors to identify causal effects. Example: Testing the effect of sleep on cognitive performance. Application: In AP Psychology, experiments are foundational to establishing cause and effect.
Correlation
Description: Measuring how two variables change together and whether one predicts the other. Example: A positive correlation between study time and exam scores. Application: In AP Psychology, understanding correlations is essential for interpreting data.
Experimental Methodology
Description: A research method where one variable is manipulated to determine its effect on another variable. Example: Changing the amount of sleep to measure its effect on cognitive performance. Application: In AP Psychology, experimental methodology is vital for testing hypotheses.
Non-Experimental Methodology
Description: Research that lacks manipulation of an independent variable. Example: Observing behavior without any intervention. Application: In AP Psychology, various studies utilize this method when experiments are unethical or impractical.
Correlation Coefficient
Description: A numeral indicating the strength and direction of the relationship between two variables. Example: A correlation coefficient of +0.8 indicates a strong positive relationship. Application: In AP Psychology, understanding correlation coefficients helps interpret research findings.
Illusory Correlation
Description: The belief in a relationship between two variables when none exists. Example: Assuming that all people from a certain profession are dishonest due to a few examples. Application: In AP Psychology, recognizing illusory correlations aids in critical thinking.
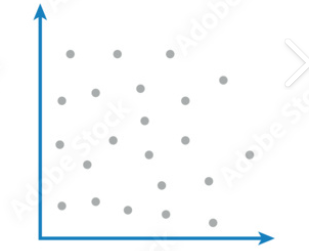
Scatter Plot
Description: A graphical representation used to show the relationship between two variables. Example: A scatter plot showing study hours vs. exam scores. Application: In AP Psychology, scatter plots visually depict correlations.
Directionality Problem
Description: A limitation in correlational research where it is unclear which variable is the cause and which is the effect. Example: A relationship between stress and health without clear causality. Application: In AP Psychology, discussing directionality helps clarify research limitations.
Third Variable Problem
Description: A situation where a third variable influences the two primary variables in a study. Example: Sleep quality affecting both stress and performance. Application: In AP Psychology, identifying third variables strengthens research conclusions.
Regression Toward the Mean
Description: The phenomenon where extreme scores tend to return to the average upon subsequent measurements. Example: A student scoring exceptionally high on one test tending to score closer to their average on the next test. Application: In AP Psychology, understanding this phenomenon is crucial when interpreting extreme data.
Experimental Group
Description: The group in an experiment that receives the treatment or variable being tested. Example: A group receiving a new medication in a clinical trial. Application: In AP Psychology, understanding experimental groups helps in the analysis of research designs.
Independent Variable
Description: The variable that the experimenter manipulates to observe its effects. Example: The amount of sleep participants get in a sleep study. Application: In AP Psychology, identifying independent variables is key in experimental research.
Dependent Variable
Description: The outcome or response that is measured in an experiment. Example: Test scores in a study measuring the effect of sleep on performance. Application: In AP Psychology, dependent variables are utilized to measure the impact of independent variables.
Random Assignment
Description: A process that assigns participants randomly to different groups to ensure equal chance of placement. Example: Randomly assigning participants to treatment and control groups in an experiment. Application: In AP Psychology, random assignment eliminates biases in experimental design.
Single Blind
Description: A study design where participants do not know which group they are in, but researchers do. Example: Participants in an experiment are unaware of whether they received a treatment or placebo. Application: In AP Psychology, single-blind designs reduce participant bias.
Double Blind
Description: A study design where neither participants nor researchers know who is in the experimental or control group. Example: A medication trial where neither the doctor nor the patient knows who receives the treatment. Application: In AP Psychology, double-blind studies minimize bias and increase credibility.
Placebo
Description: A treatment with no active therapeutic effect given to control groups. Example: A sugar pill given to participants to study the effects of medication. Application: In AP Psychology, the placebo effect demonstrates the power of expectation in treatment.
Confounding Variable
Description: A variable other than the independent variable that may affect the outcome of an experiment. Example: A participant's overall health affecting the results of an exercise program. Application: In AP Psychology, controlling for confounding variables is crucial in experimental designs.
Experimenter Bias
Description: The unintentional influence a researcher may have on participants to confirm a hypothesis. Example: A researcher unintentionally treating participants in one group differently than those in another. Application: In AP Psychology, understanding experimenter bias helps improve research accuracy.
Informed Consent
Description: A process where participants are educated about the research and sign an agreement to partake. Example: Participants learning about a study's risks and benefits before signing a consent form. Application: In AP Psychology, ensuring informed consent is an ethical guideline.
Protect from Harm
Description: An ethical principle ensuring participants are not subjected to physical or psychological harm. Example: Avoiding exposure to extreme stress without debriefing participants. Application: In AP Psychology, protecting participants is paramount to ethical research.
Confidentiality
Description: The principle that personal information about participants must remain private unless consent is given. Example: Researchers ensuring participant data is not shared without permission. Application: In AP Psychology, confidentiality safeguards participant trust.
Debriefing
Description: The process of explaining the study's purpose and any deception at the conclusion of a study. Example: Informing participants about the true nature of a study after its completion. Application: In AP Psychology, debriefing is critical to ensure participant understanding and ethical standards.
Quantitative Research
Description: An approach used in psychology to collect and analyze numerical data. Example: Using surveys to quantify behaviors and attitudes among students. Application: In AP Psychology, quantitative research is fundamental for statistical analysis.
Qualitative Research
Description: Research that relies on observations and descriptions rather than numerical data. Example: Conducting interviews to explore personal experiences of stress. Application: In AP Psychology, qualitative research enriches understanding of psychological phenomena.
IRB (Institutional Review Board)
Description: A committee responsible for reviewing, approving, and monitoring research involving humans. Example: An IRB reviewing a proposal for a study on anxiety treatments. Application: In AP Psychology, IRBs are critical for ethical research oversight.
Research Confederates
Description: Individuals who participate in an experiment but are not the focus of the researcher's observation. Example: A confederate posing as a participant to manipulate social interactions in a study. Application: In AP Psychology, confederates are used to create controlled experimental conditions.
Mean
Description: The arithmetic average of a distribution obtained by adding scores and dividing by the number of scores. Example: The average score of a class on a test. Application: In AP Psychology, the mean is used to summarize data.
Median
Description: The middle score in a distribution where half the scores are above and half are below. Example: The middle score in a set of 1, 3, 5, 7, 9 is 5. Application: In AP Psychology, the median is useful for understanding skewed distributions.
Mode
Description: The most frequently occurring score in a distribution. Example: If the scores are 1, 2, 2, 3, the mode is 2. Application: In AP Psychology, the mode indicates the most common response.
Percentile Rank
Description: The percentage of scores in a distribution that fall below a particular score. Example: A student at the 90th percentile has scored higher than 90% of the population. Application: In AP Psychology, percentile ranks are used to interpret test scores.
Skewed Distribution
Description: A representation of scores that lack symmetry around their average value. Example: In a distribution of salaries where a few individuals earn substantially more than most. Application: In AP Psychology, skewness affects mean and median comparisons.
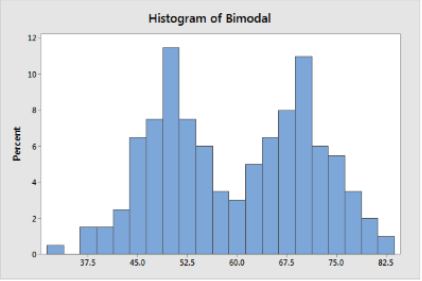
Bimodal Distribution
Description: A data distribution with two peaks. Example: Test scores reflecting two different performance levels among different groups. Application: In AP Psychology, bimodal distributions suggest varied influences in a population.
Range
Description: The difference between the highest and lowest scores in a distribution. Example: The range between a score of 10 and 90 is 80. Application: In AP Psychology, the range helps describe data variability.
Standard Deviation
Description: A computed measure of how much scores vary around the mean score. Example: A low standard deviation indicates that scores are closely clustered to the mean. Application: In AP Psychology, understanding standard deviation aids in analyzing data spread.
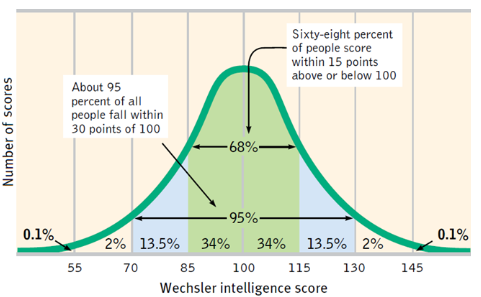
Normal Curve
Description: The symmetrical, bell-shaped curve that describes the distribution of many physical and psychological attributes. Example: Heights of individuals in a population typically follow a normal distribution. Application: In AP Psychology, a normal curve is visualized when discussing statistical significance.
Statistical Significance
Description: A measure of how likely a result is due to chance or manipulation of the independent variable. Example: A p-value of .03 indicates a significant result. Application: In AP Psychology, statistical significance is vital for interpreting research findings.
p-value
Description: A value that indicates the probability of obtaining the results by chance. Example: A p-value less than .05 denotes statistical significance. Application: In AP Psychology, the p-value guides researchers in evaluating hypotheses.
Statistical Inference
Description: The process of generalizing findings from a sample to a broader population. Example: Inferring trends in behavior based on survey data collected from a small group. Application: In AP Psychology, statistical inference allows for conclusions about larger populations.
Effect Size
Description: A quantitative measurement of the strength of the relationship between two variables or the difference between groups. Example: A large effect size demonstrates a strong link between study habits and academic performance. Application: In AP Psychology, effect size is important for understanding research impact.
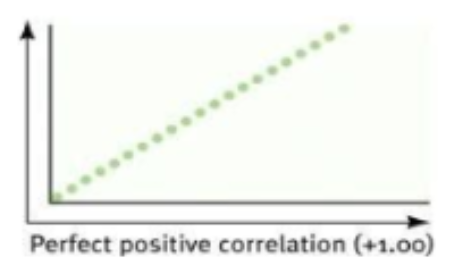
Positive Correlation
Description: A relationship between two variables in which both variables move in the same direction. As one variable increases, the other also increases; conversely, as one decreases, the other decreases. Example: The more hours a student spends studying for an exam, the higher their exam score tends to be. Application: In AP Psychology, researchers use this to identify predictive relationships. For instance, a positive correlation between self-esteem and academic performance suggests that high self-esteem is associated with better grades, though it does not prove that high self-esteem causes the grades.
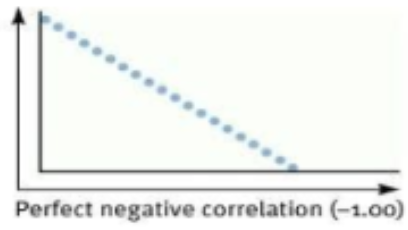
Negative Correlation
Description: A relationship between two variables in which an increase in one variable is associated with a decrease in the other. They move in opposite directions. Example: The more hours a student spends watching television, the lower their GPA tends to be. Application: This is often used to study the impact of "buffer" variables or detrimental habits. For example, a negative correlation between exercise and stress levels indicates that as physical activity increases, reported levels of stress tend to go down.
Zero Correlation
Description: A relationship where there is no statistical connection between two variables. Changes in one variable do not predict changes in the other. Example: There is no correlation between shoe size and intelligence quotient (IQ). Application: Researchers use this to rule out hypothesized relationships. If a study finds a correlation coefficient ($r$) near $0.00$, the researcher concludes there is no linear relationship, helping to narrow down which factors actually influence behavior.
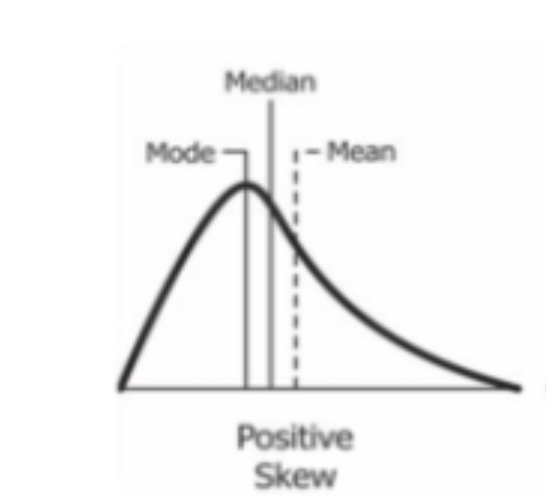
Positive Skew (Right-Skewed)
Description: A distribution where most scores are concentrated at the lower end (left), with a "tail" that stretches out toward the higher values (right). Example: Family income in a neighborhood where most people earn $50k, but two residents are multi-millionaires. Application: In AP Psychology, you must know how this affects the measures of central tendency. In a positive skew, the mean is pulled toward the tail, making it higher than the median. If a psychology test is very difficult, the resulting distribution will likely be positively skewed.
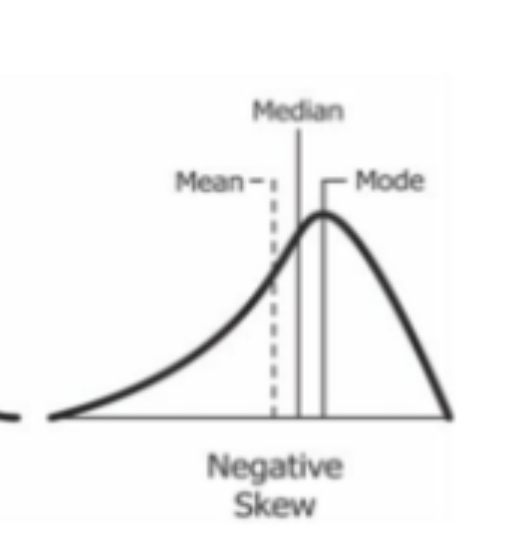
Negative Skew (Left-Skewed)
Description: A distribution where most scores are concentrated at the higher end (right), with a "tail" that stretches out toward the lower values (left). Example: A very easy exam where almost everyone gets an A or B, but a few students fail. Application: When identifying scores on a graph, remember that the mean is the most sensitive to outliers. In a negative skew, the mean is pulled down by the low-scoring outliers, meaning the mean < median. This is often seen in studies of "ceiling effects" where a task is too easy for the participants.
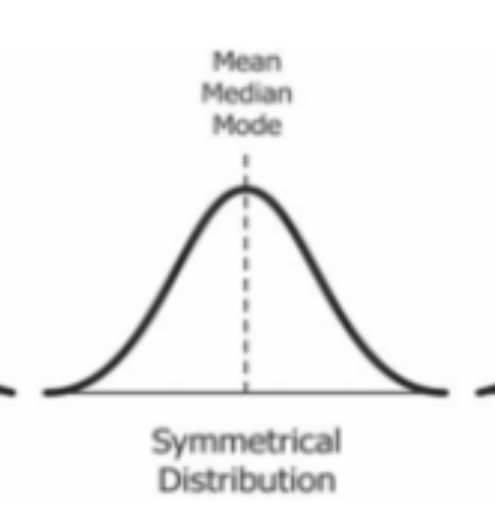
Symmetrical Distribution (Normal Curve)
Description: A distribution where the left and right sides are mirror images of each other. The data is centered around a central peak, and the "tails" on both sides are equal. Example: Human height or weight in a large, diverse population usually follows this bell-shaped pattern. Application: This is the foundation of the Normal Curve (Bell Curve) in AP Psychology. In a perfectly symmetrical distribution, the mean, median, and mode are all identical and located at the center. This allows psychologists to use the 68-95-99.7 Rule to determine what percentage of a population falls within certain standard deviations (e.g., IQ scores, where the mean is 100).