STATS 1123 - correlation and regression
1/11
There's no tags or description
Looks like no tags are added yet.
Name | Mastery | Learn | Test | Matching | Spaced | Call with Kai |
|---|
No analytics yet
Send a link to your students to track their progress
12 Terms
single categorical variable charts
pie chart
bar graph
single numerical variable charts and statistics
stemplot
histogram
boxplot
sample mea/sample median
standard deviation/IQR
what is the response variable
dependent
y axis
what is the explanatory variable
independent
x axis
scatterplot
x and y axis ( independent and dependent)
desc:
direction: positive, negative, no direction
form: linear, curved, cluster, no pattern
strength: 0-4 (weak), 4-7 (moderate), 7+ (strong)
outlier
r (correlation coefficient)
between 2 numerical variables
-1 < x < 1 (negative to positive)
sensitive to outliers
if r = 0, it means there is no linear relationship between the 2 variables
no units
0-4 (weak), 4-7 (moderate), 7+ (strong)
graph should be linear
hypothesis test
Ho (null - original)
Ha (alternative - what we want to test (linear relationship))
conclusion:
reject Ho
fail to reject Ho
Steps to hypothesis
Write null and alternative hypothesis (x and y of all subjects do not have/have a linear correlation among all subjects in the population)
compare r with DP (if r is outside the box then we have sufficient statistical evidence - r > DP/ r < DP)
conclusion (we do not have/have sufficient statistical evidence to conclude that x and y have a linear relationship among all subjects within the population)
regression analysis
Y (hat ) = a + bx (predicted value)
a = when x = 0, then a is this much (the predicted value of y is a when x = 0)
b = slope (for every 1 unit increase in x, the predicted value of y ↓/↑ by |b| units)
r²
square of correlation
the fraction of the variation in the values of y that is explained by the least squares regression of y on x
residuals
difference between the predicted value (y hat) and the observed value
(y-y hat) = residual
sum of residual is always 0
no pattern
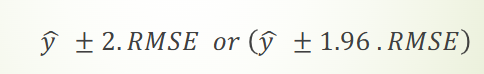
RMSE
root mean square error
When using the least squares regression line with
explanatory variable x to predict y ,we expect about 95% of the observed values of y to lie within 2s of their respective
least square predicted values of y