maths data handling yr 1
1/32
There's no tags or description
Looks like no tags are added yet.
Name | Mastery | Learn | Test | Matching | Spaced |
|---|
No study sessions yet.
33 Terms
what is a population
the entire set of items in the group being studied
what is a census
measuring every member of a population
give 1 advantage and 2 disadvantages of a census
adv = accurate
disadvantages:
expensive
some testing can destroy the item
what is the list of sampling units called
sampling frame
what are the 3 types of random sampling (names)
simple random sampling
systematic sampling
stratified sampling
what is simple random sampling?
give 1 advantage and 1 disadvantage
equal chance of being selected, use a random number generator alongside a sampling frame
advantage = free from bias
disadvantage = sampling frame is required
what is systematic sampling?
give 1 advantage and 1 disadvantage
take every kth unit, and u pick a starting point between 1 and k using a random number generator
advantage = quick to use
disadvantage = sampling frame needed
what is stratified sampling?
give 1 advantage, and 1 disadvantage
proportionally represents the strata (groups) in the sample to reflect the population. uses either systematic or simple random to fill the groups
advantage: reflects population
needs clear strata for population
what are the 2 types of non random sampling
quota sampling
opportunity sampling
what is opportunity sampling
give 2 advantages and 1 disadvantage
the sample is based on who/what is available when u do it
advantage = easy
cheap
disadvantage: unlikely to be representative
what is quota sampling
give 1 advantage and 2 disadvantages
is when a quota needs to be filled. not necessarily representative of the population. the groups are filled using opportunity sampling
advantage: no sampling frame needed
disadvantage:
not random
potential bias (as would pick people on if u think they would fill the quota)
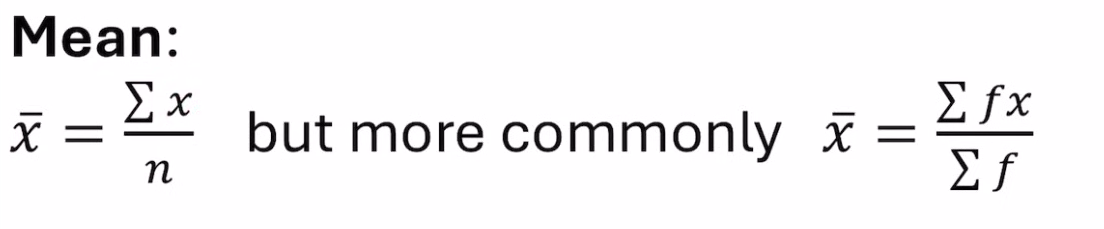
what are the 2 equations for the mean
where fx is just the product of the midpoint and the frequency (x = midpoint) (f = freq)
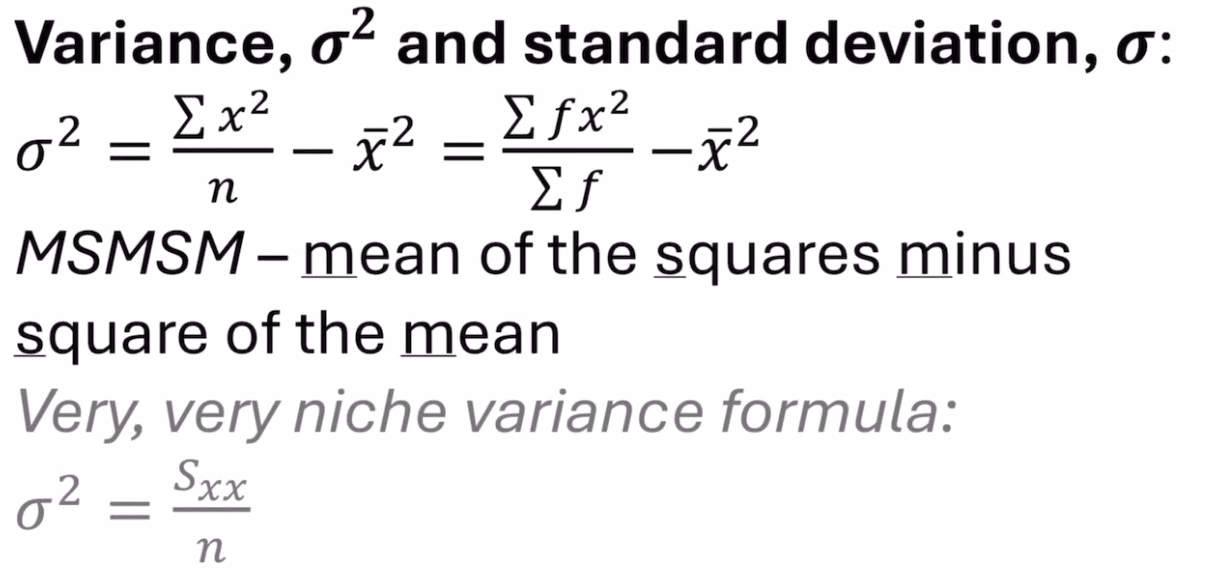
what are the 3 equations for variance?
where the fx is in brackets, so the product is squared
what is the equation for histograms (i want the proportionality one, and the acc full equation one)
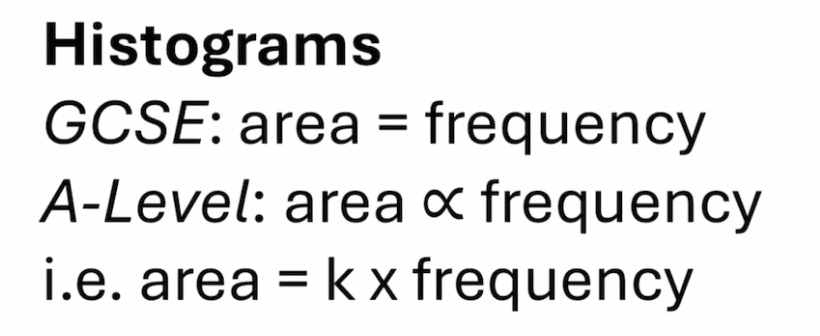
when the histogram is a curve what is true for frequency and area
area = freq
can u use calculator ability to find the mean?
yes
can u use the calculator ability to find median / quartiles (if grouped data)
no. will have to do linear interpolation
what does deciles split data into?
into tenths
if you have: y=ax + b, what values affect the mean/quartiles/median (measure of location), and what values affect the standard deviation/variance?
measures of location = both
SD/V = ONLY a
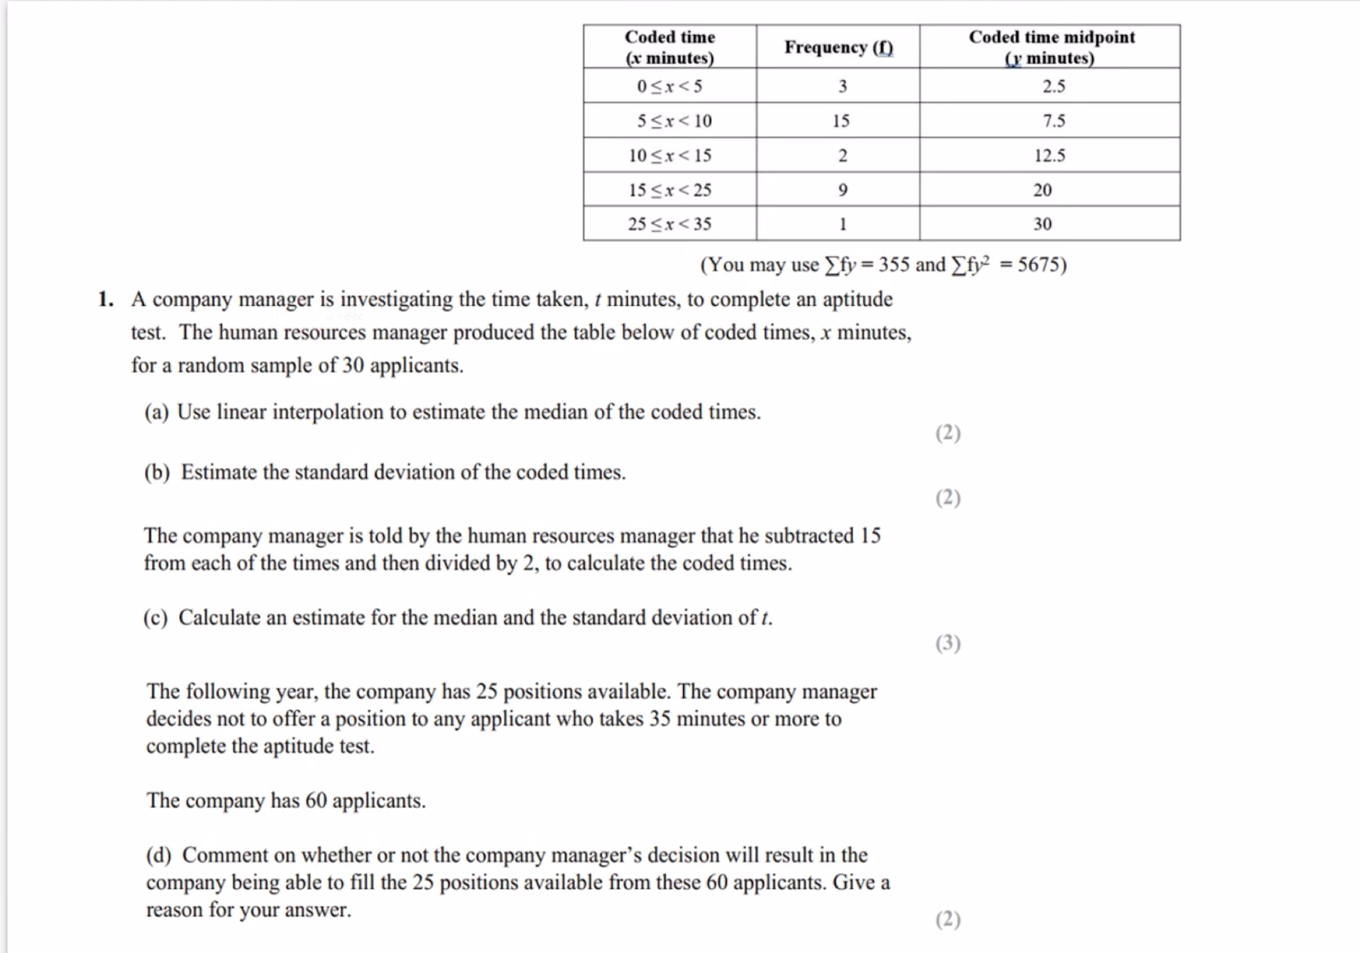
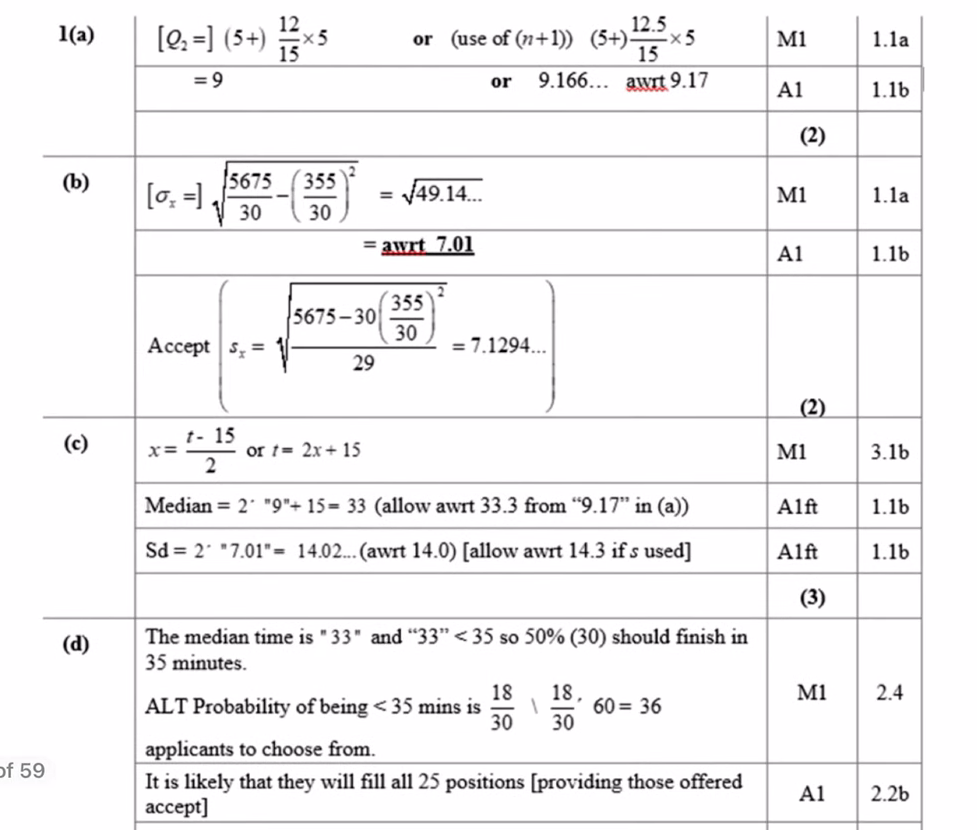
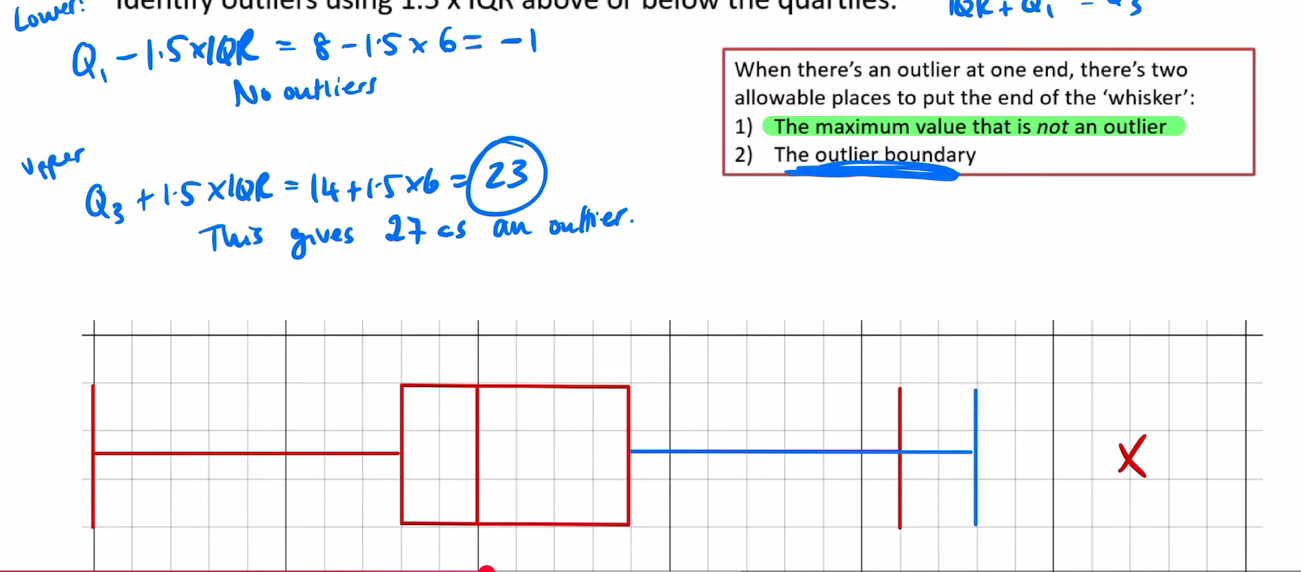
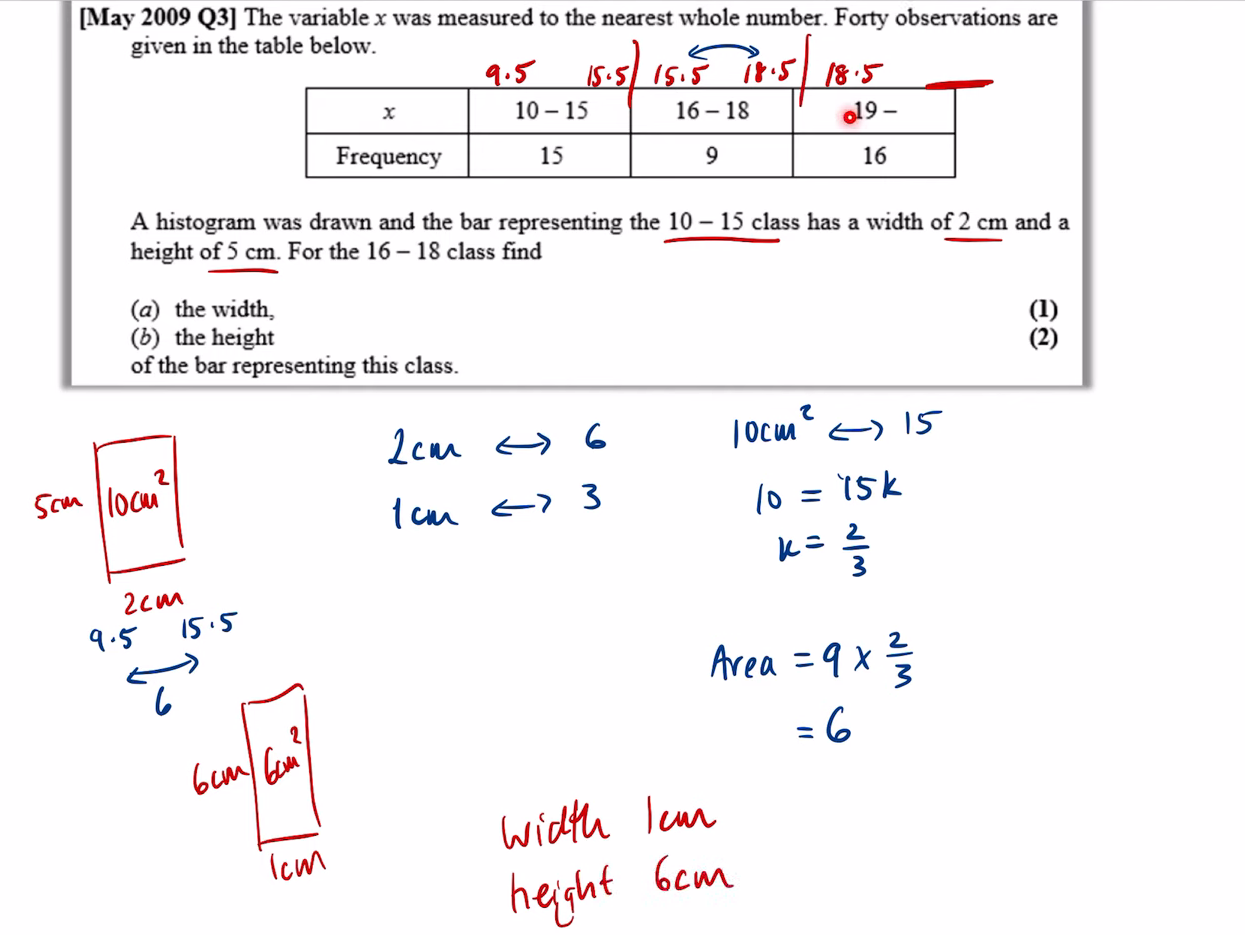
do this question
what are outliers marked with? (on a box plot)
a cross
what is the equation to find upper outlier.
what is it to find lower outlier
for both, assume k = 1.5
upper: Q3 + 1.5 IQR
lower: Q1 - 1.5 IQR
what is the acc term/ name when removing anomalies / outliers
cleaning the data
when there is an outlier for a box plot, what are the 2 acceptable ways of plotting the “max” value line?
where the green one is indicated by the red max upper
and the blue is represented by max blue upper
when comparing box plots, what 2 things must u compare
a measure of spread (IQR or range)
a measure of location (median is best)
when doing cumulative freq diagrams, do u plot against midpoint, or upper boundary
upper boundary
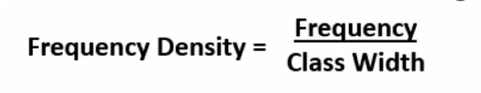
what is on the y axis of a histogram
frequency density
what is the equation that links FD, F, CW
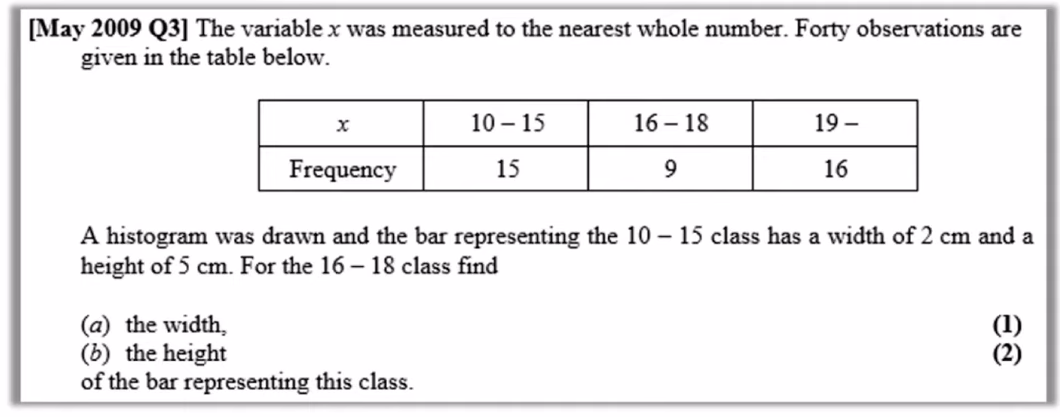
do this question
how do you draw a frequency polygon from a histogram?
the points will be the centre of the top of each bar, and then u connect every single point linearly
for correlation graph, which axis is the independant variable, and which axis is the dependant variable?
independent on x axis
dependent on y axis
what is extrapolation.
it can produce an ____________ result
prediciting a y value (dependent value) using x axis / independent variable outside the given range
an unrelaible result
_______ does not imply ________
correlation does not imply causation