HCS 202 Exam 2
1/92
There's no tags or description
Looks like no tags are added yet.
Name | Mastery | Learn | Test | Matching | Spaced |
|---|
No study sessions yet.
93 Terms
Purpose of hypothesis testing
Determine whether there is sufficicent evidence to make a sound scientific conclusion
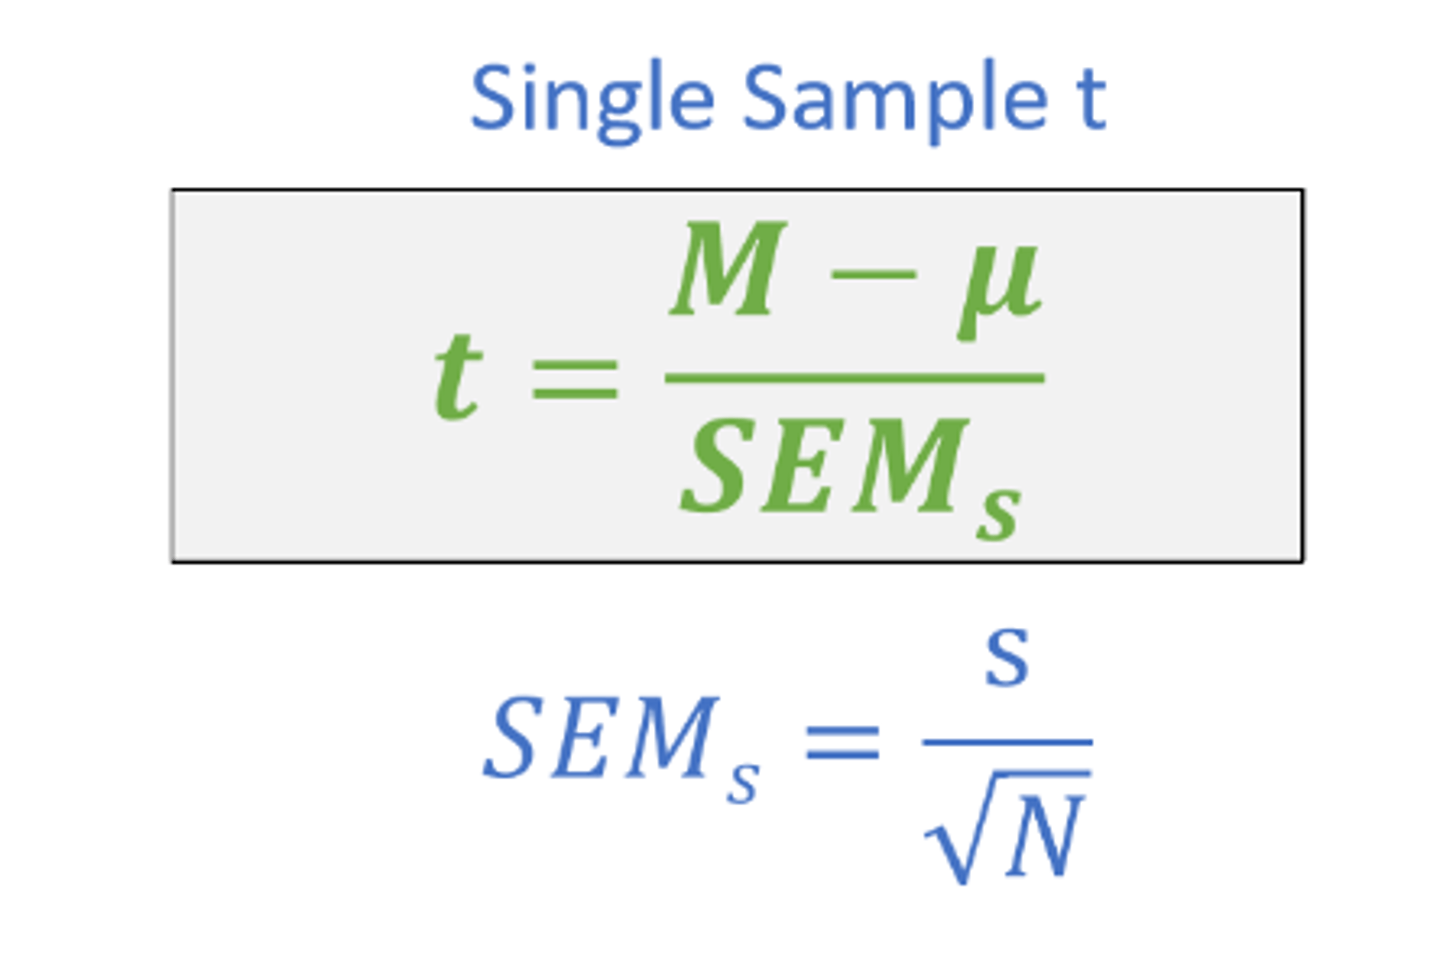
what does a single sample t test compare
a sample mean to a population mean when the population standard deviation is unknown
what is required for a single sample t test
sample mean, sample standard deviation, and population mean
statistical assumptions
Characteristics about the data that need to be met before performing selected types of inferential statistics.
4 common assumptions
independence of data, appropriate measurement variables, normality of distributions, homogeneity of variance
independence of data
no two observations are related in a dataset (not robust)
appropriate measurement variables
the variables of interest must be measured on the appropriate scale (not robust)
normality of distributions
The distribution of sample means for each condition must have a normal shape (robust if sample size is over 30/large)
homogeneity of variance
standard deviations from the sample and population are similar (robust)
Non-robust assumptions
must be met in order to proceed
robust assumptions
assumptions can be violated to some degree and still continue with test
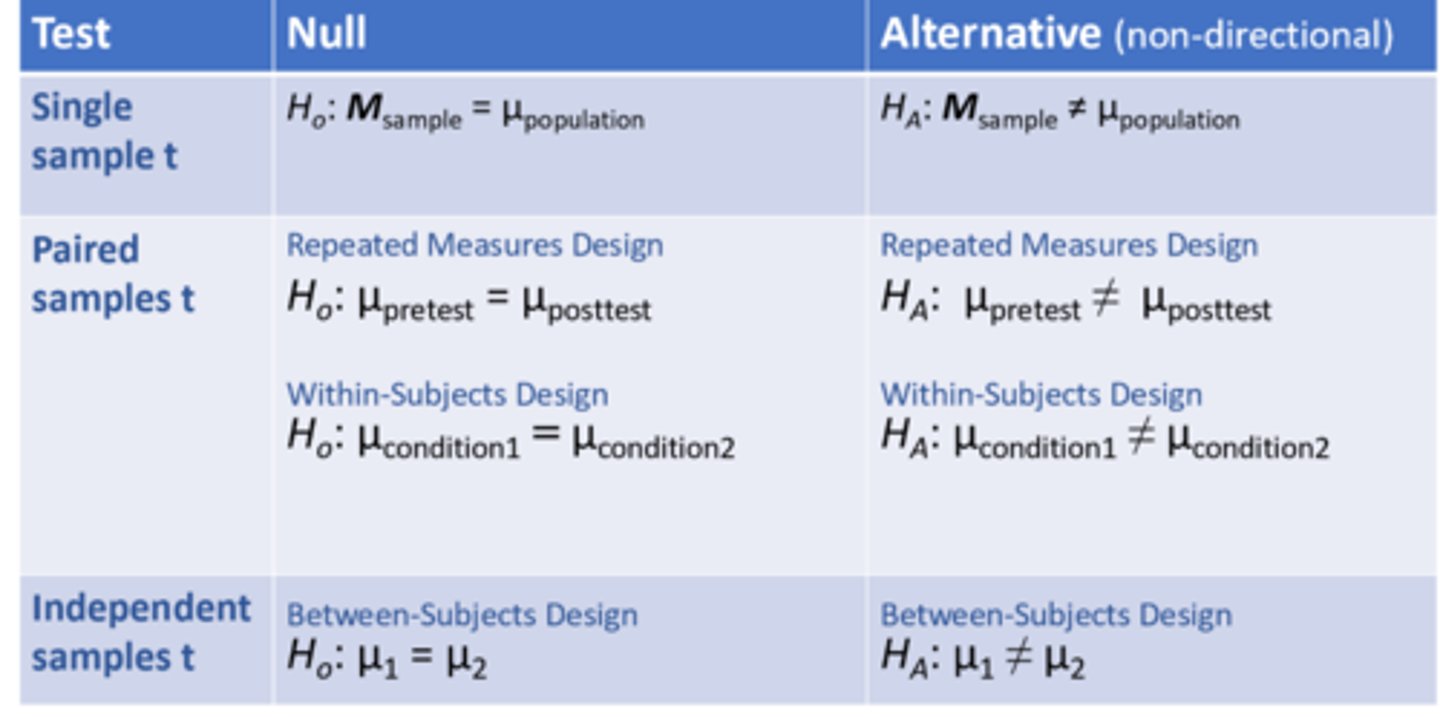
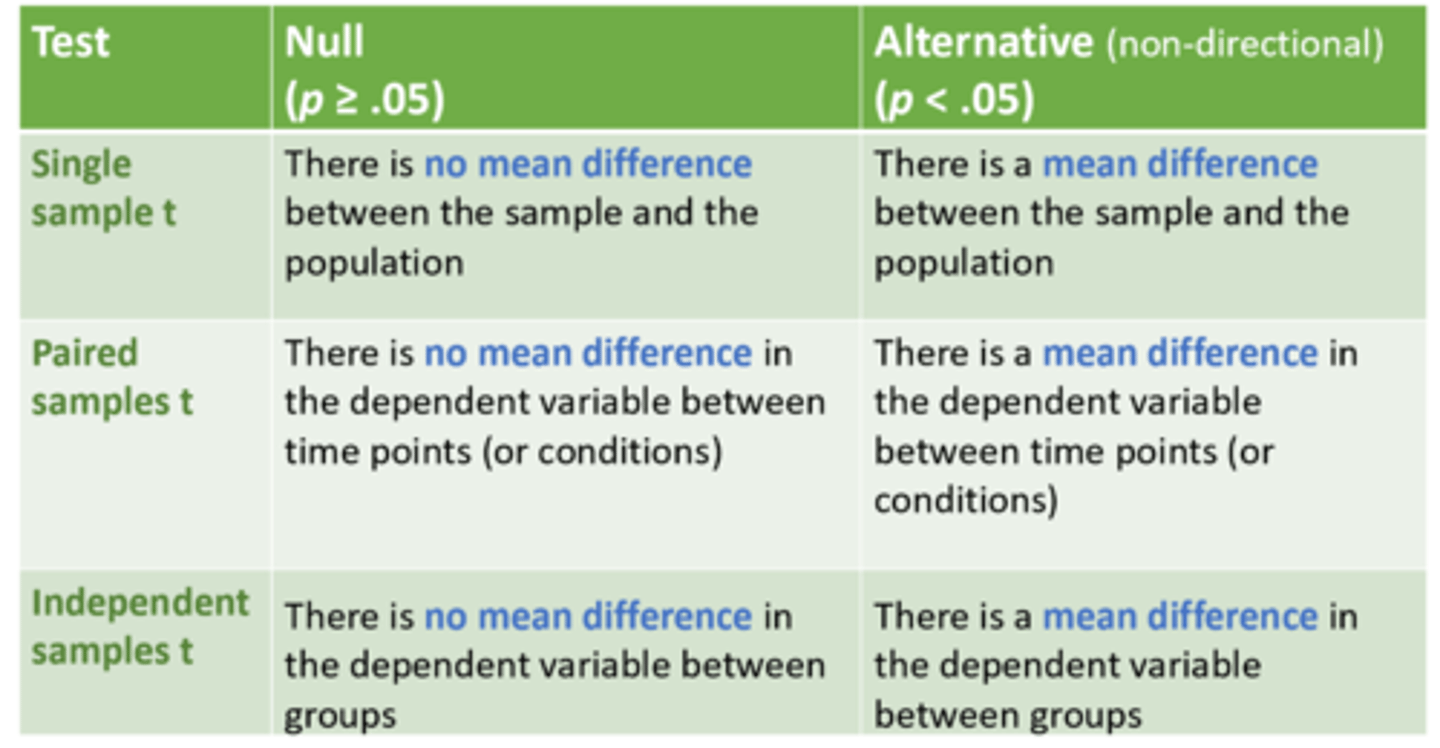
Null Hypothesis
states there is no effect on the population/ no difference between the sample mean and the population mean
alternative hypothesis
states there is an effect on the population/ a difference between the sample mean and the population mean
If data is incompatible with null hypothesis
we reject the null
if data is compatible with the null
we fail to reject the null
Two kinds of alternative hypothesis
one tailed or two tailed
One-tailed hypothesis
the direction of the affect is specified, used when there are no outcomes in a direction not studied, more powerful
two-tailed hypothesis
non-directional, used when outcomes can be in either direction, most common
Decison Rule
the rule that determines wether or not we reject or fail to reject the null
alpha (a)
the significance level or critical region used to set the descisison rule/ reject or fail to reject the null
If an observed statistic is greater than alpha/ inside the critical region
we reject the null
if an observed statistic is less than the crititcal value and falls inside the unshaded region
we fail to reject the null
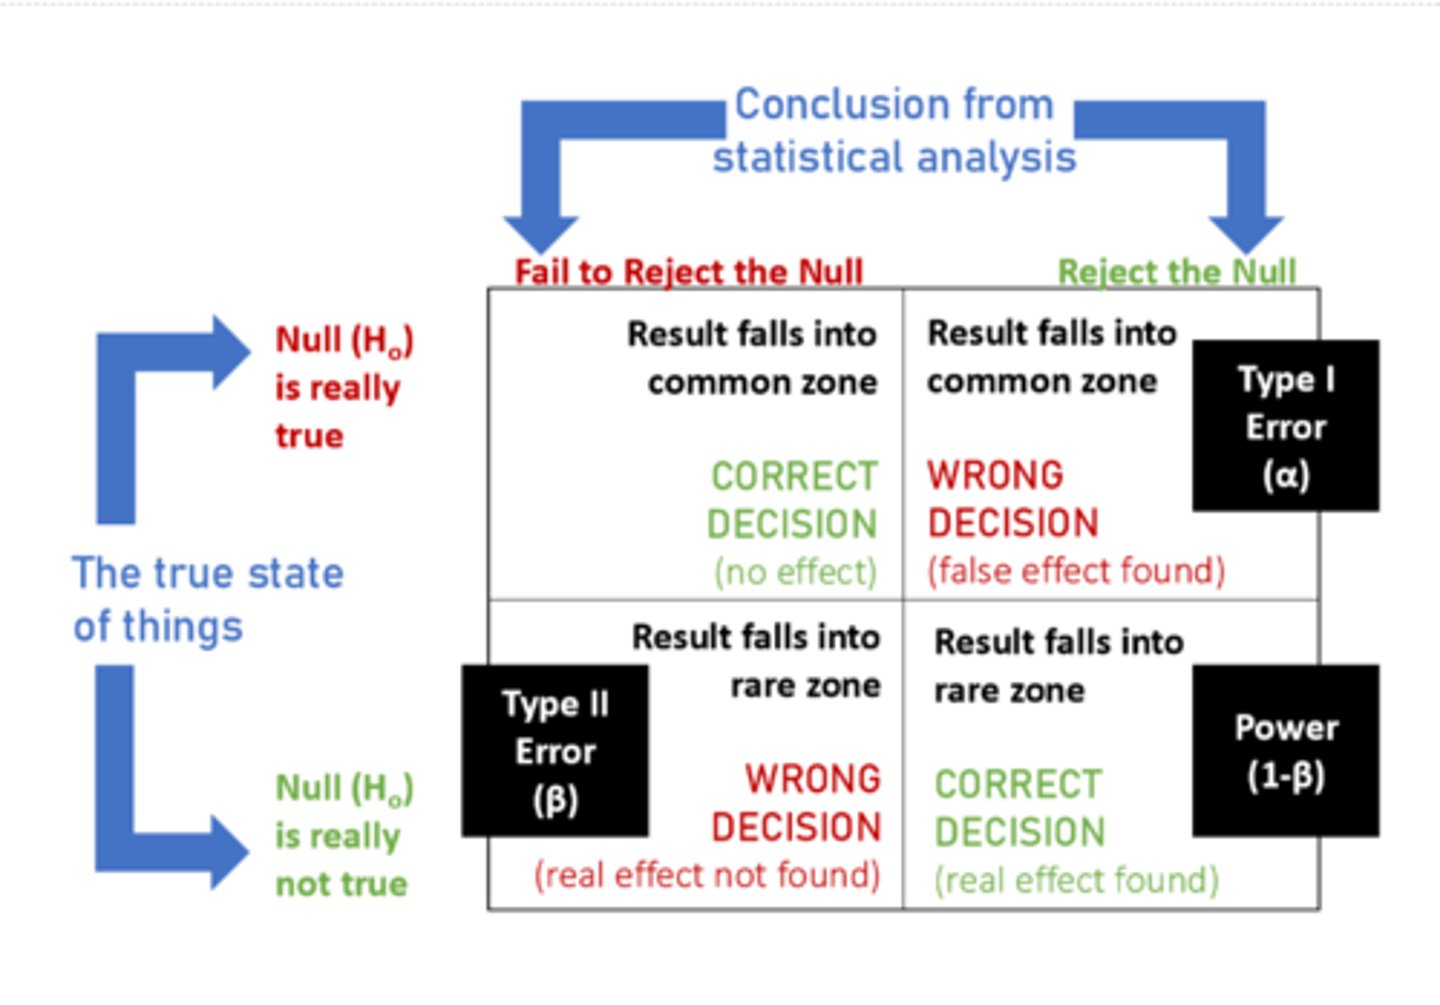
alpha represents the probability of what kind of error
type 1 error
common practice alpha value
5%, 5% possibility of being wrong
beta represents the probability of what type of error
type 2 error
type 1 error
Rejecting null hypothesis when it is true
type 2 error
failing to reject a false null hypothesis
power
1-B, also known as a true positive
power is influenced by
sample size, effect size, alpha
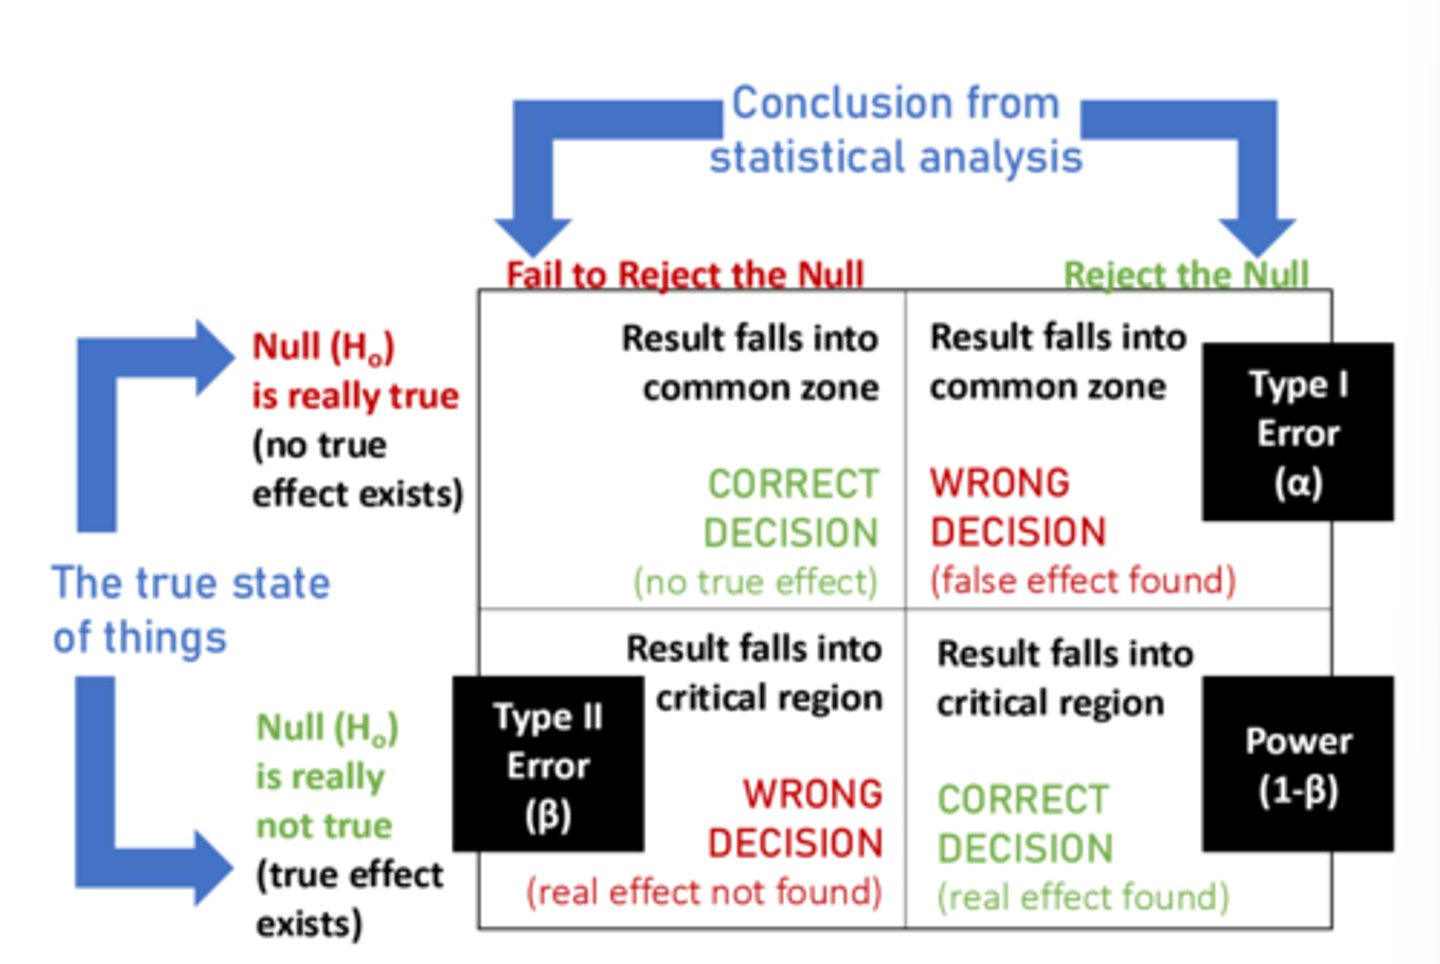
4 Possible Outcomes of Hypothesis Test Table
How to identify our critical Value
critical value calculator, in appendix b of textbook
What is needed to input in critical value calculator
is the test one tailed or two tailed, what is our a value, and the n value
p value
The probability level which forms basis for deciding if results are statistically significant (not due to chance).
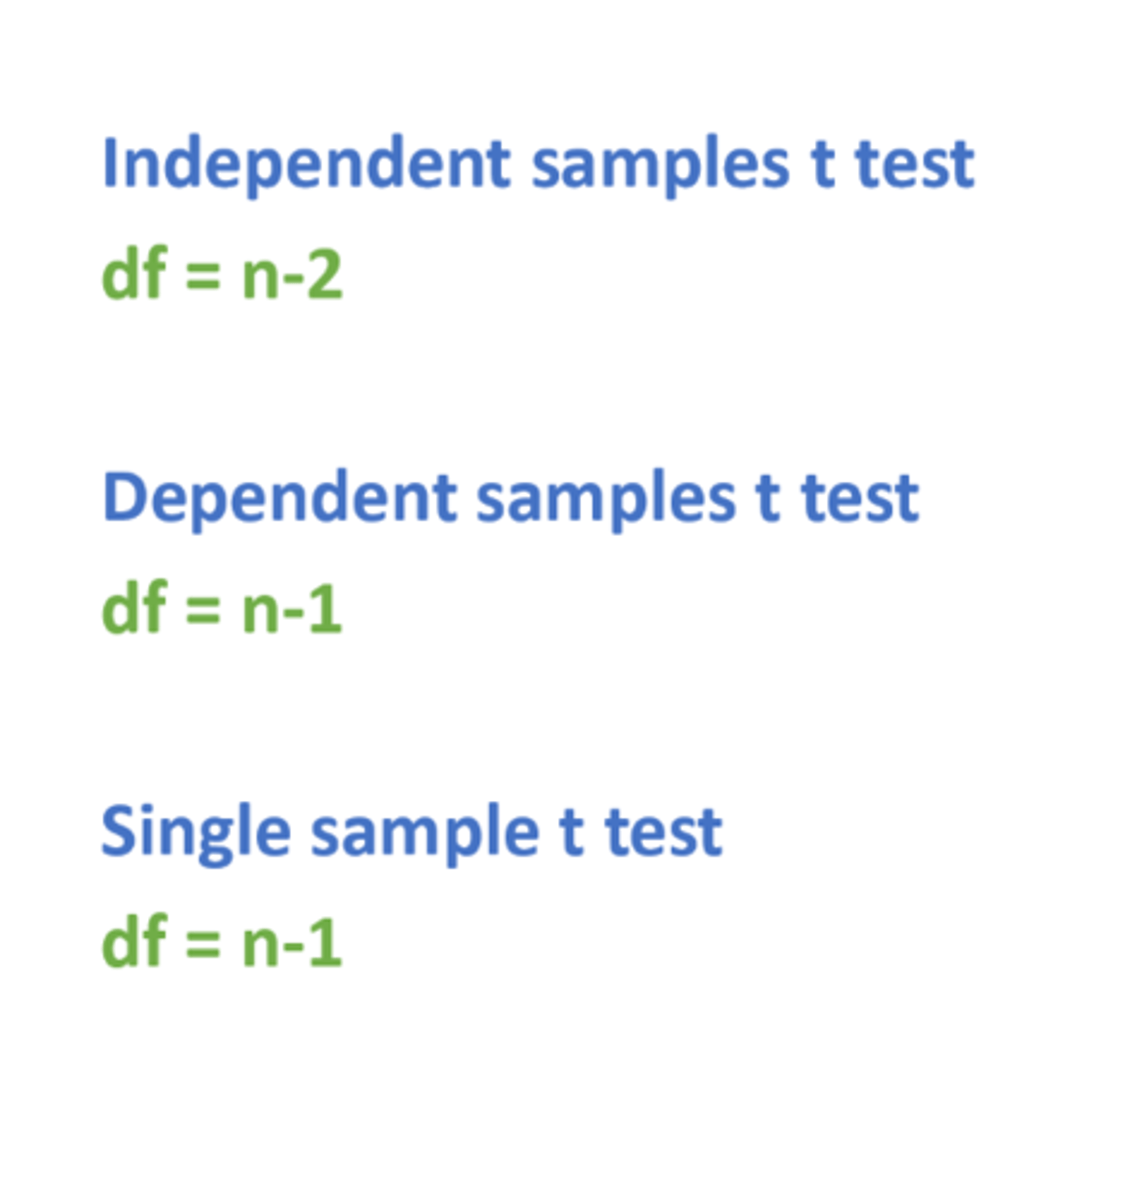
degrees of freedom for a single sample t test(df)
n-1
what df represents
the number of independent choice of values in a sample
T test equation
t value = (sample mean - population mean) / standard error of sample mean

SEM (standard error of sample mean)
(SD / square root of N)
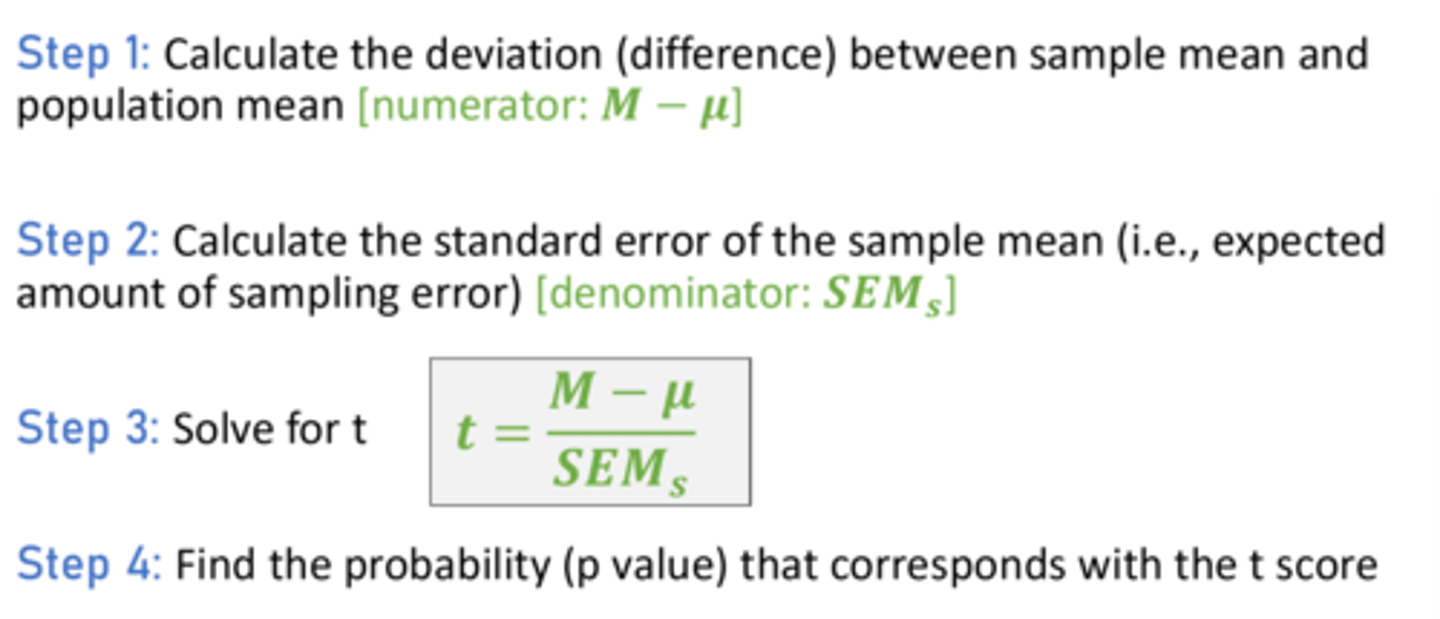
4 Steps to calculate a single sample t score
1. Calculate Sample Mean - Population Mean
2. Calculate SEM
3. Divide step 1 over step 2
4. Find p value corresponding with t score from t table online
population mean symbol
μ
p-value < alpha
we reject the null
p-value > alpha
we fail to reject the null
standardized mean difference
(sample mean- population mean)/ standard deviation
d variable represents
standardized mean difference
d=
(m-u)/s
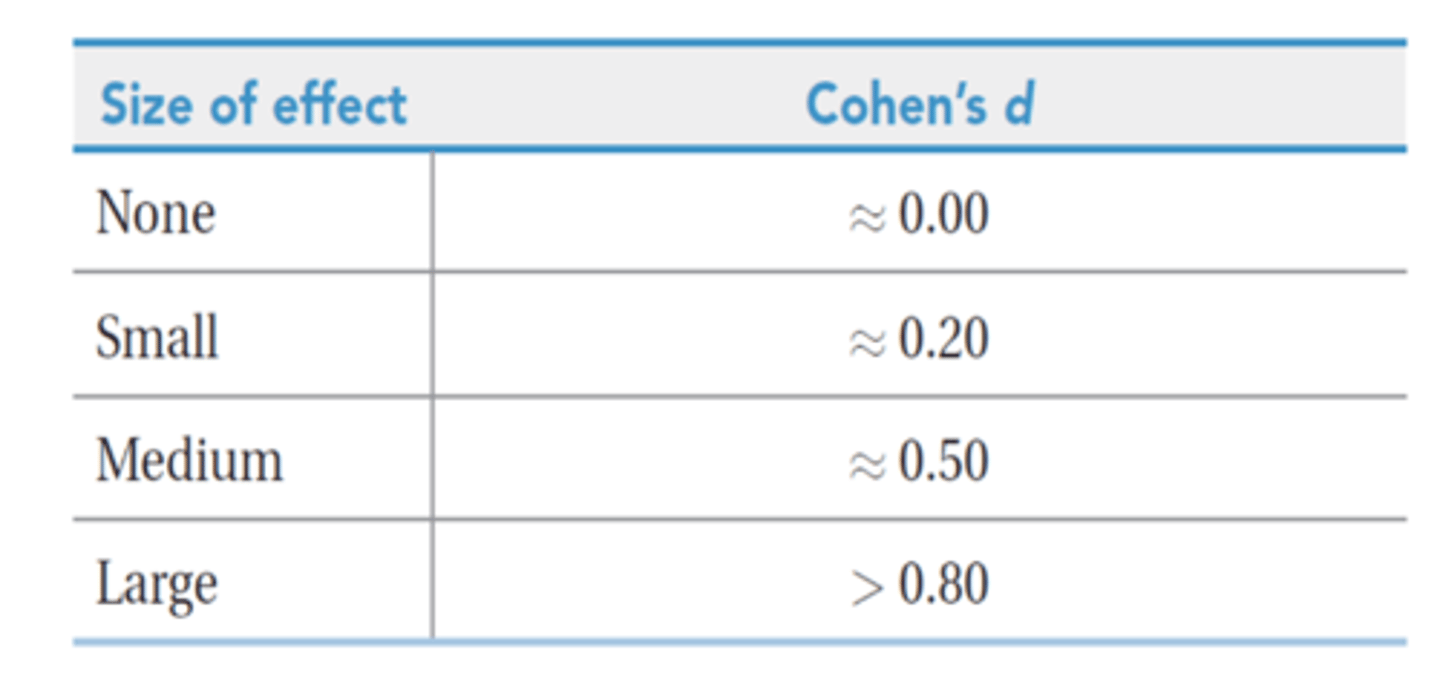
cohens d
a measure of effect size that assesses the difference between two means in terms of standard deviation, not standard error
effect size determined through
cohens d
d=0
no effect size
d=.20
small effect size
d=.50
medium effect size
d>.80
large effect size
confidence interval
estimates the likely values that might occur in a a population given sampling error
margin of error calculation
(t score from textbook appendix)(SEM of sample)
Confidence interval has
upper bound and lower bound
Calculation of CI
(sample mean-population mean) +- MOE
If the null is located within the confidence interval
we fail to reject the null, not enough evidence to suggest a mean difference
if the null is located outside the confidence interval
we reject the null, as evidence suggests a mean difference
Sample size effect on CI
Larger sample size will narrow the CI
The closer a value is to the middle of the CI
The more plausible it is
Wide CI
Are imprecise estimates
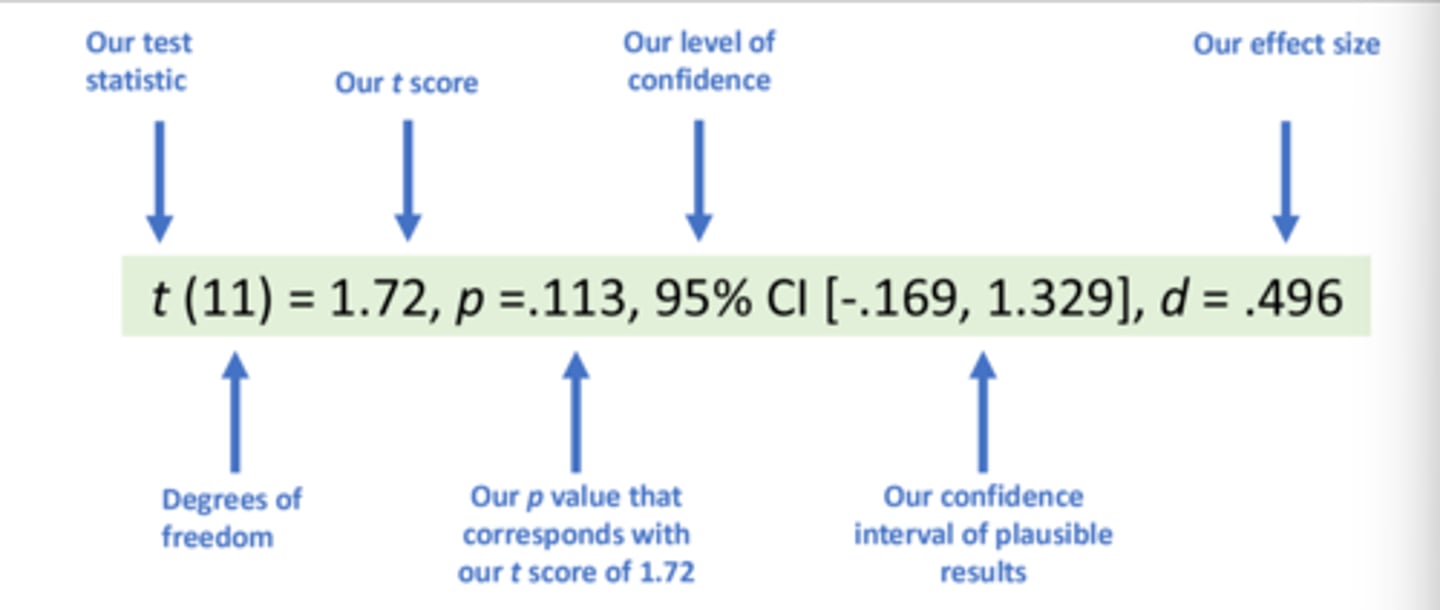
Slide for meaning of variables in a single sample t test
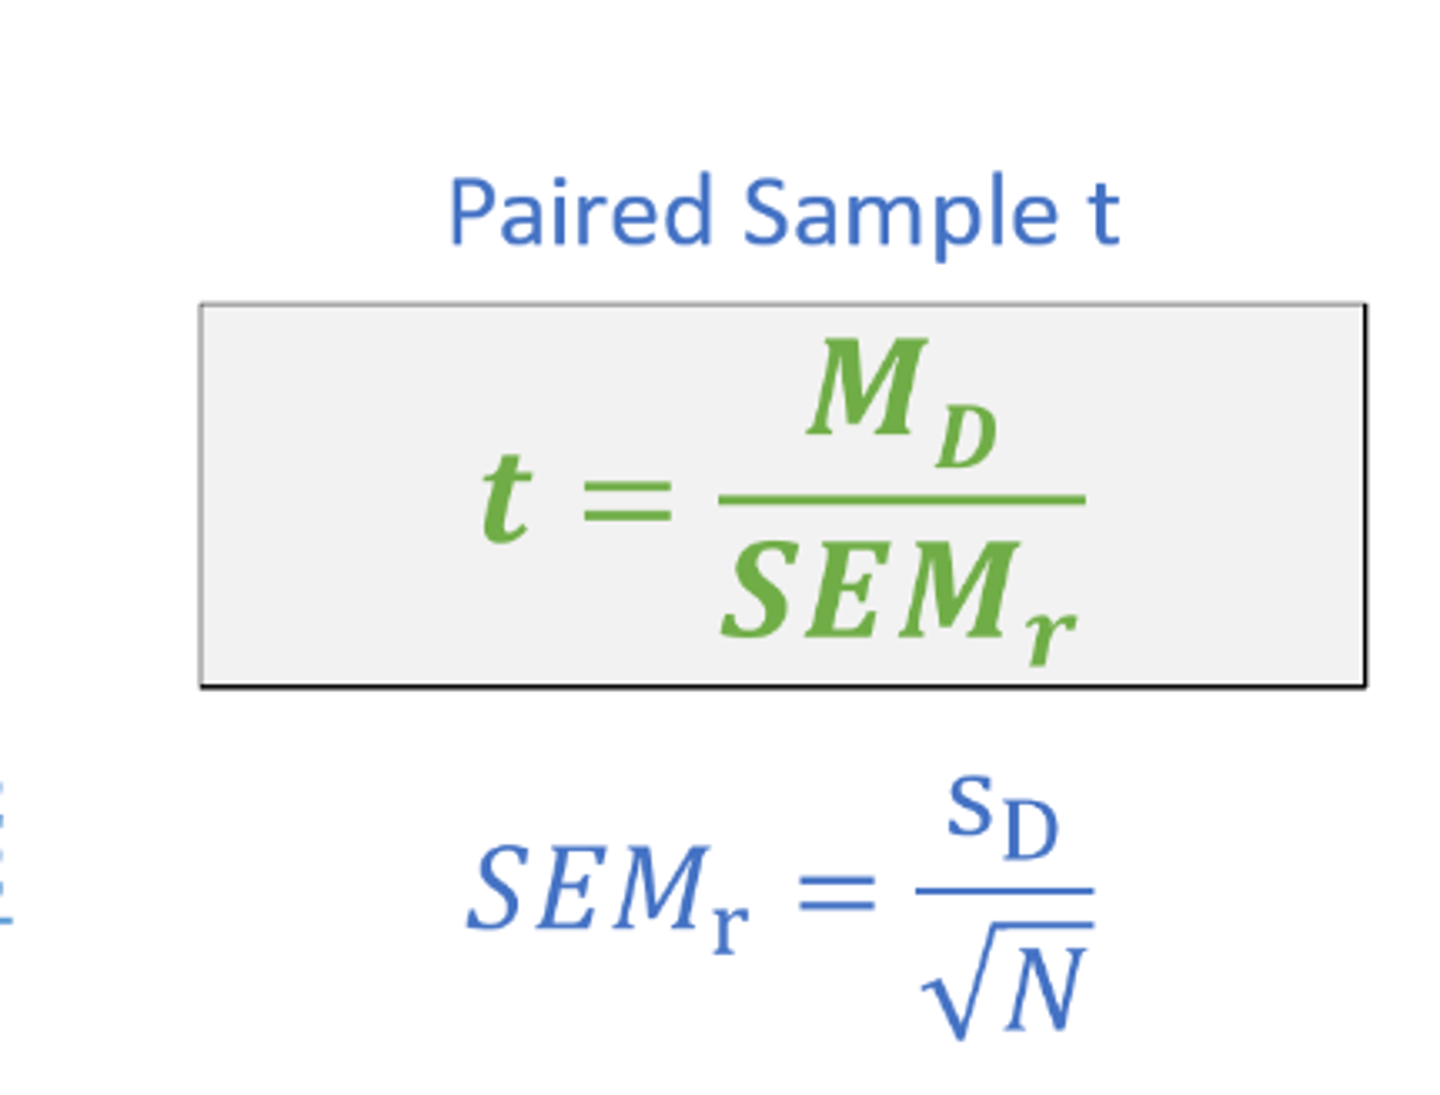
Related samples t test
compares two sample means which are related to eachother
Hypothesis testing steps diagram
advantages of using a repeated measures design
requires a smaller sample and has higher probability to reject the null
Assumptions for a related samples t test
independence of data (not robust), appropriate measurement of variables (not robust), normality (robust, especially with large n)
Steps for related samples t test
1. Choose one or two sample t test
2. Check assumptions
3. Identify the null and alternative hypothesis
4. Set the descisision rule
5. Calculate t statsistic
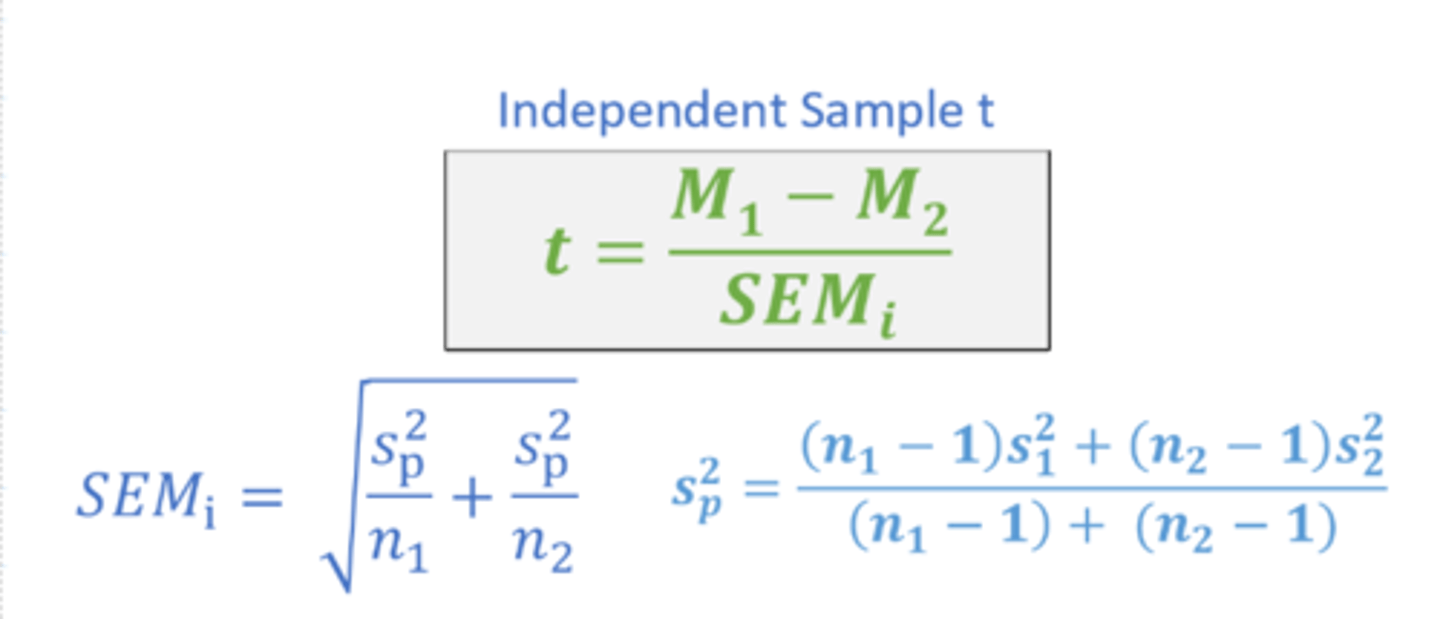
Independent samples t test
compares two sample means that are unrelated
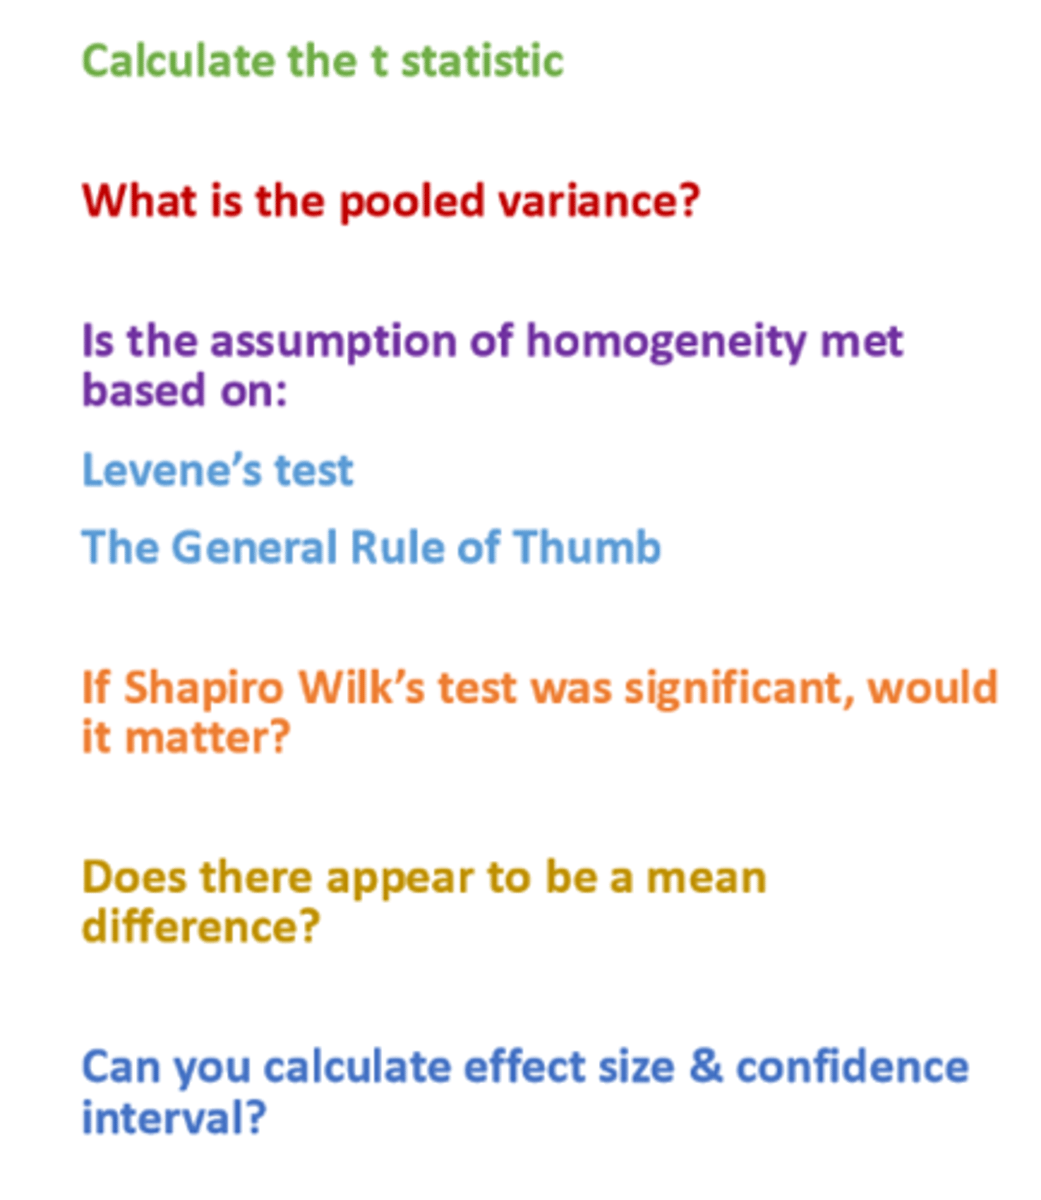
pooled variance
A weighted average of the two estimates of variance—one from each sample—that are calculated when conducting an independent-samples t test.
different kinds of t tests
single sample, paired samples, independent samples
paired samples t test
compares two sample means from the same group or matched groups
independent sample t test
compares two sample means from different groups
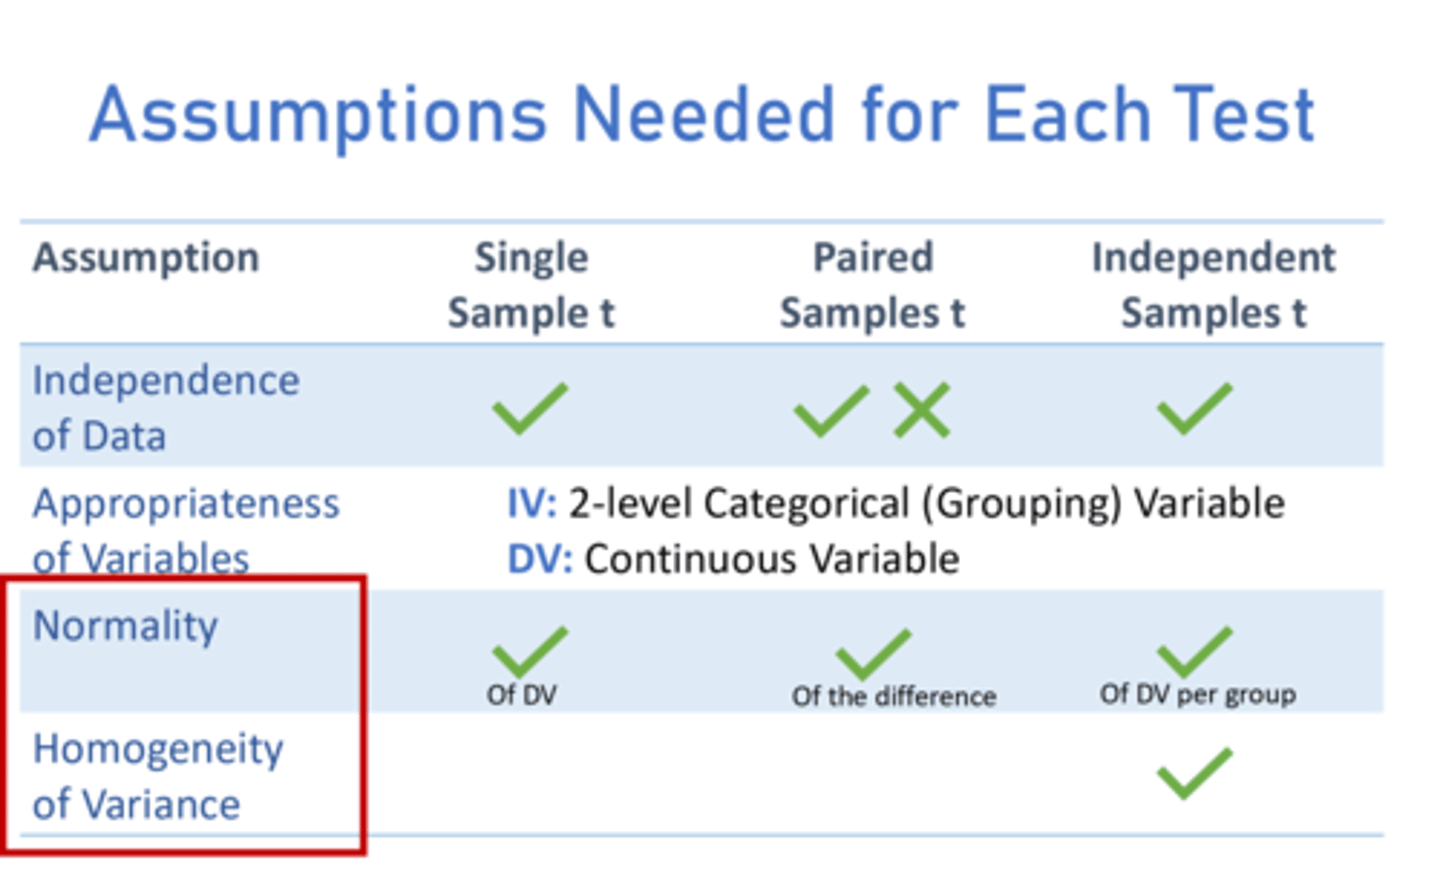
Assumptions needed for each test
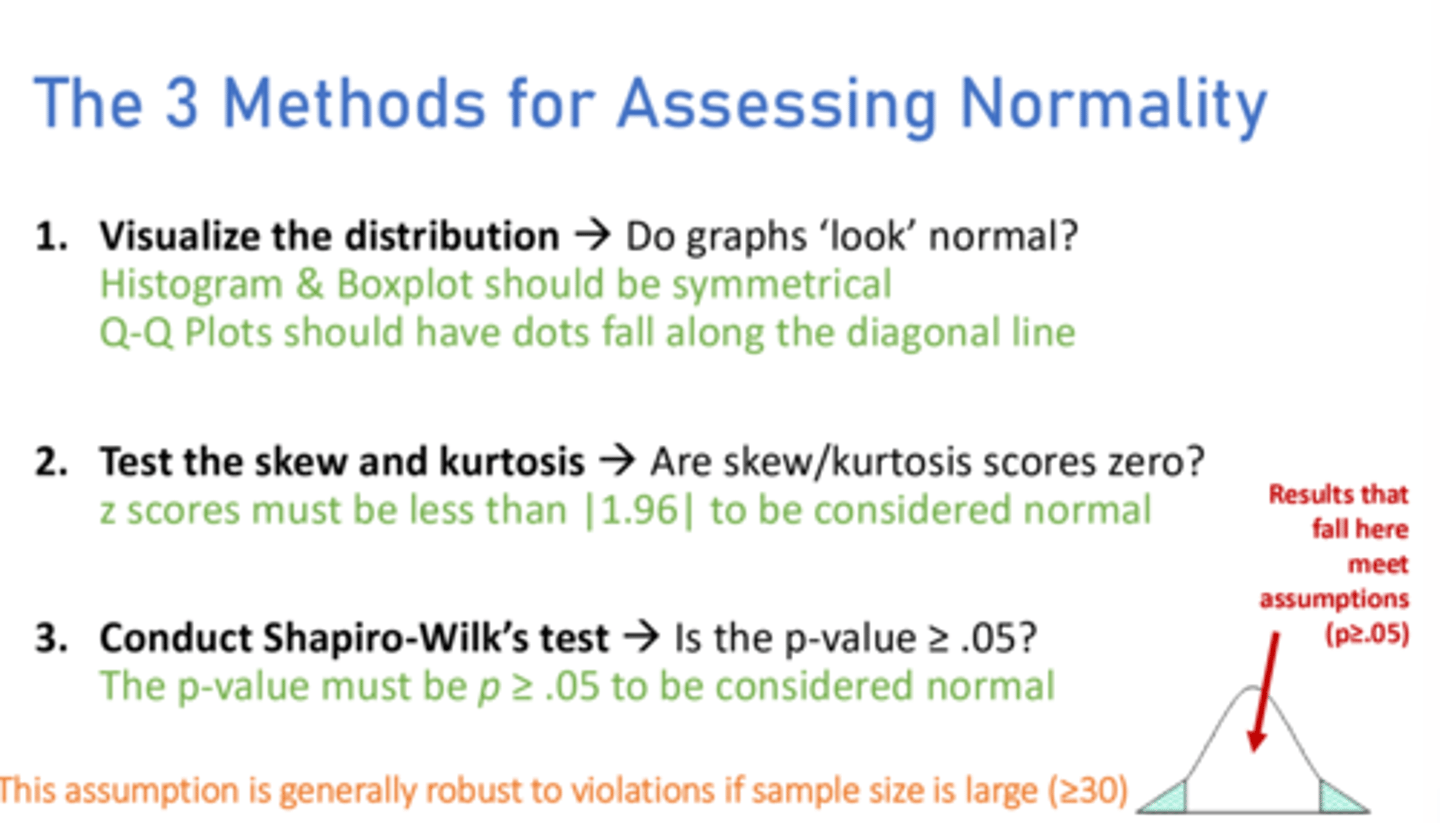
Methods for assessing normality
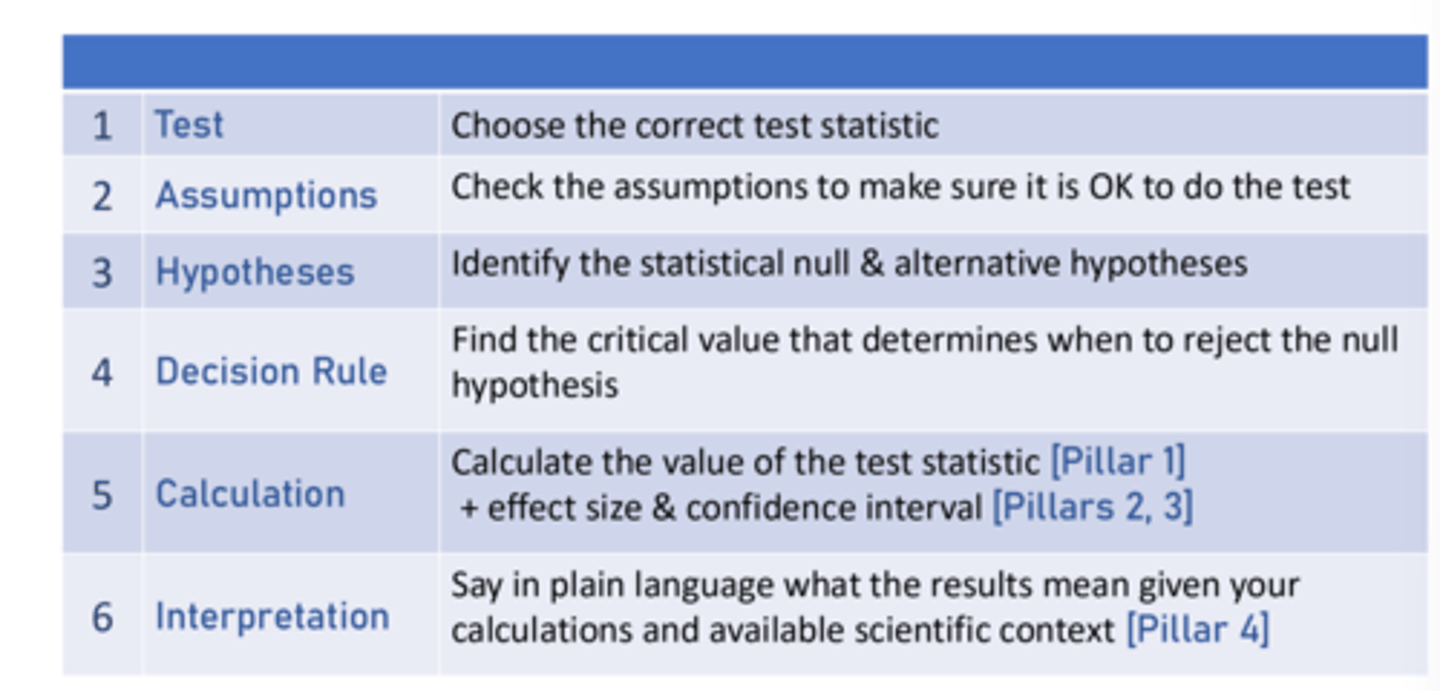
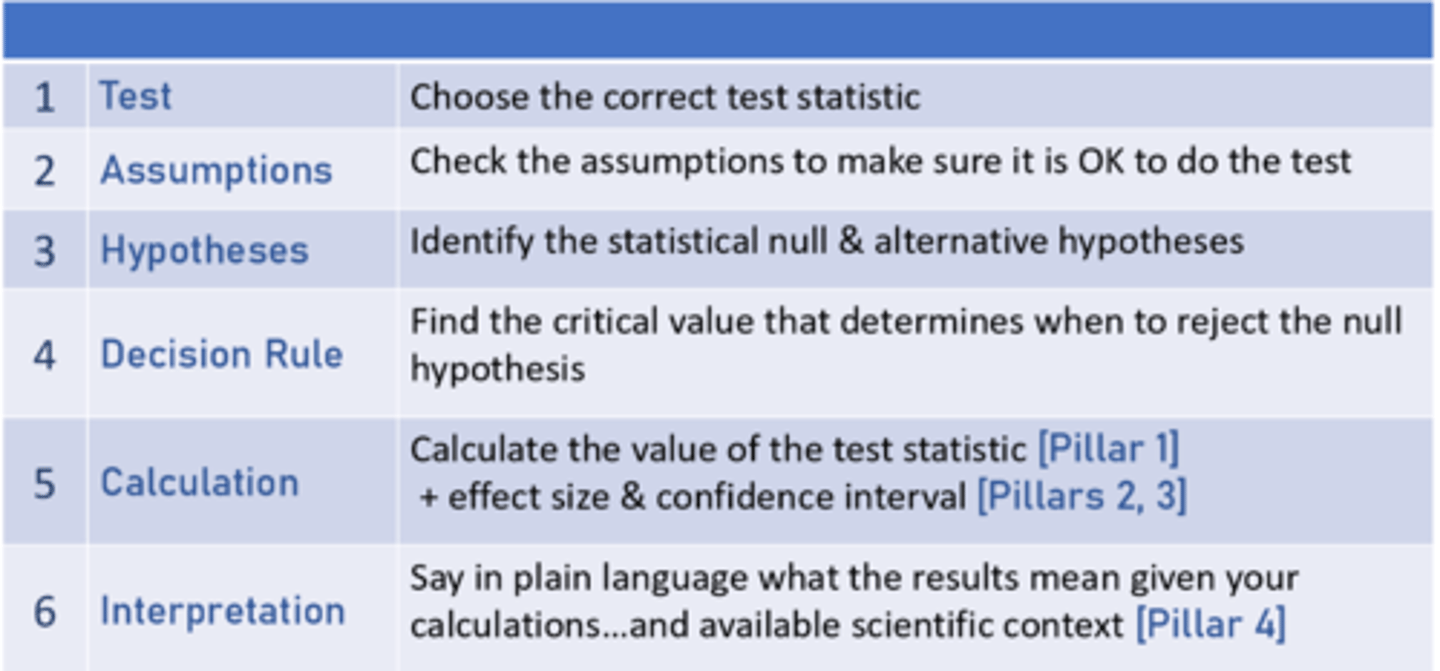
Steps For All Statistical Analyses
Two testable assumptions
normality, homogeniety of variance
2 Methods to assess homogeneity of variance
general rule and levenes test
general rule for assessing homogeneity of variance
difference in variance should be no less than 3
Levene's test
determine if the p value is greater than or equal to .05 to be considered equal variance (robust if group sizes are equal)
Shapiro-Wilks test for normality
A statistical test used to determine if the shape of a data set approaches a normal distribution. Used when the number of subjects is equal to or greater than fifty.
How to calculate shapiro wilks test
calculates W statistic, and determines how well the data matches a normal distribution
W use
W closer to 1 means normality, W closer to 0 means not normal
Hypothesis Specific for each test
P values for each test
degrees of freedom calculation for different tests
Possible outcomes for hypothesis testing
Power is influenced by
alpha, effect size, and sample size
t calculation
mean difference/ SEM
t calculation for single sample t
t calculation for independent sample t
t calculation for paired sample t
cohens d for different tests
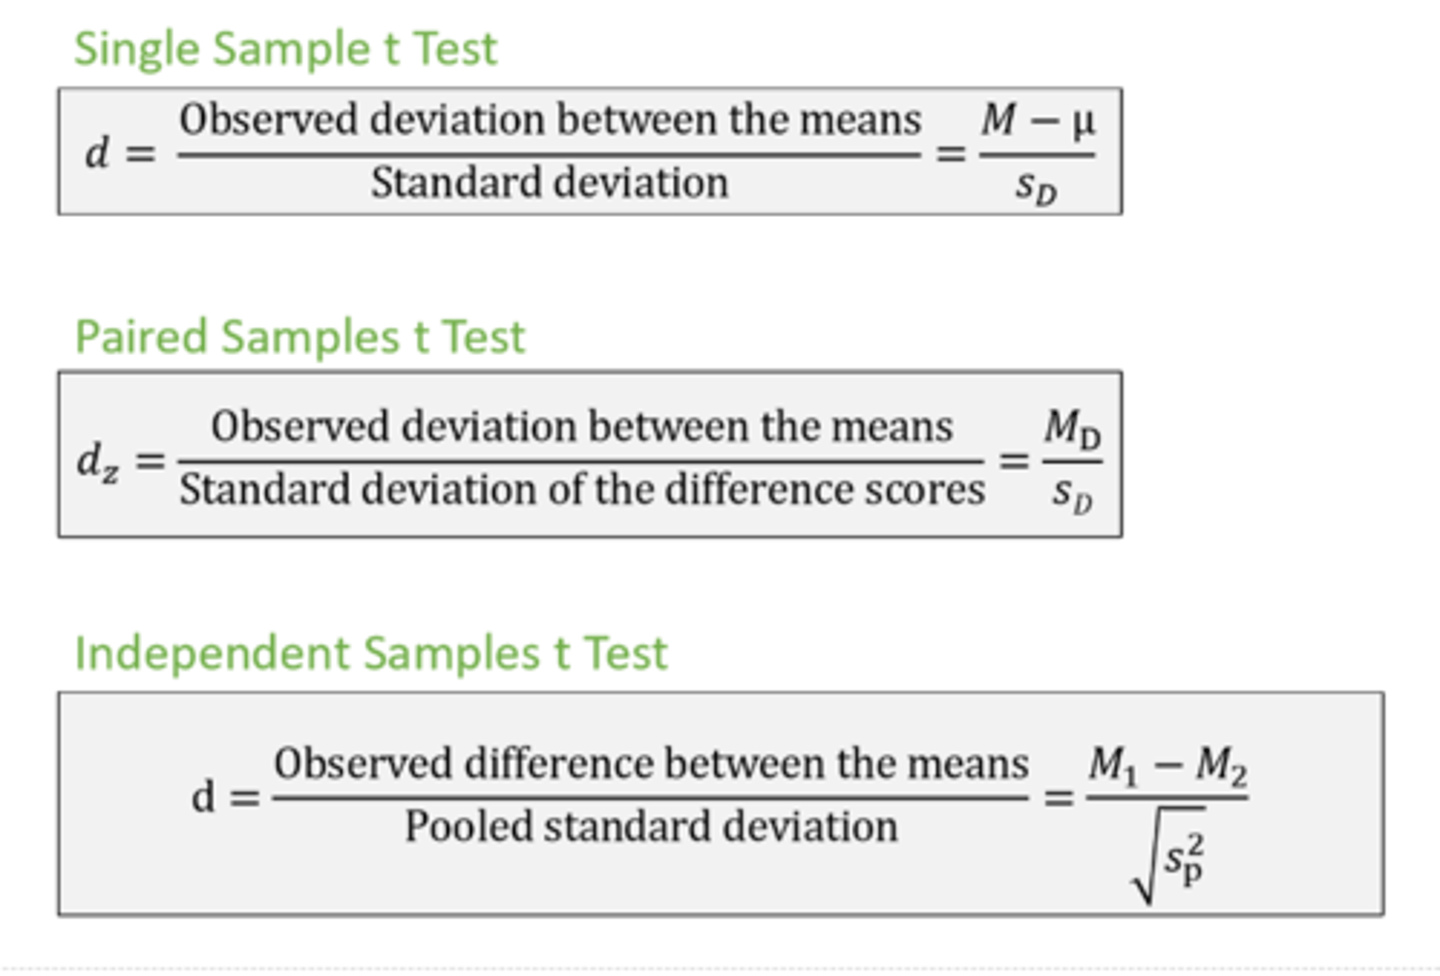
cohens d values
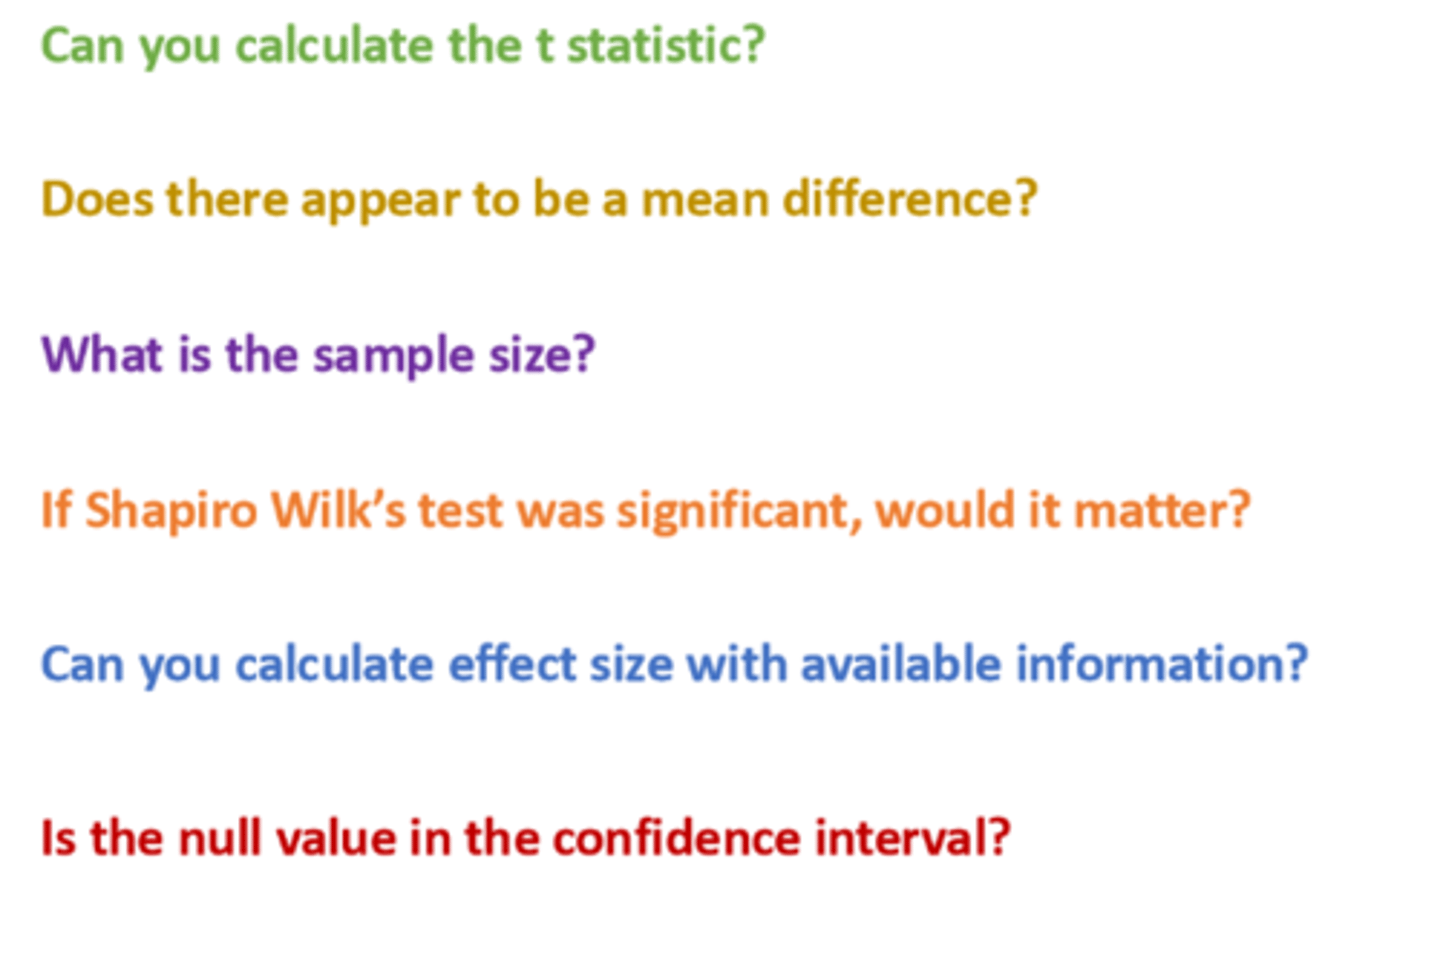
Be able to
Can you