GW Blok 6 Seminar 3.2 Statistical inference for one or two samples
1/7
There's no tags or description
Looks like no tags are added yet.
Name | Mastery | Learn | Test | Matching | Spaced |
|---|
No study sessions yet.
8 Terms
What are the types of hypothesis testing problems?
Type of Problem | Description |
|---|---|
One Sample Problem | Compare one sample mean to a known or hypothesized population mean |
Two Dependent Samples (Paired) | Compare two related (paired) measurements on the same subject |
Two Independent Samples | Compare means from two different, unrelated groups |
More Than Two Groups (ANOVA) | Compare means across 3 or more independent groups |
What is the two dependent samples (paired) problem?
Each subject is measured twice, or pairs are matched on same characteristics that can have an influence on the dependent variable
Focus on the difference between the two related measurements of one variable
Analysis: paired sample t-test
Example: Are students happy with their weight (separately for males and for females)?
The actual weight and wished weight is measured for each student
Dependent samples, because the variable weight is measured twice
Uses the hypothesis testing approach with t-values
What is the two independent samples (paired) problem?
Each subject belongs to one of two separate groups, and each group provides one measurement on the same variable. The two groups are independent, meaning measurements from one group do not influence or pair with those in the other group.
Focus on the difference between the means of two independent groups
Analysis: Independent Samples t-test
Example: Does the average difference between wished and actual weight of females differ from that of the males in the population?
Variable measured: Weight difference (wished weight – actual weight)
For group 1: male students and group 2: female students
Independent samples, because each student belong to one group, no pairing or matching individuals and variable is independently compared for each group
Uses the hypothesis testing approach, but with a pooled and unpooled t-test
Two sample t-test (with equal variances) produces the same results as a linear regression model when the x-variable is a dummy (0/1) variable
What is the difference between a pooled and unpooled t-test?
Pooled t-test: when equal variances are assumed - first line
De Sig. is 0.189 > 0.05 dus het is geen significant verschil -> H0 van variantie niet verwerpen -> eerste rij kijken
Unpooled t-test: when equal variances are not assumed - second line
Used Levene’s test to determine which line to look at
How do you decide to use a pooled or an unpoold t-test?
Homogeneity of variances between the two populations
H0: σ2group 1 = σ2 group 2
H0: σ2group 1 ≠ σ2 group 2
Look a the independent samples t-test and the Levene’s test
Equal variances are assumed: p-value > α (=0.05) → pooled t-test → first line
Equal variances are not assumed: p-value ≤ α (=0.05) → unpooled t-test → second line
What is the more than groups problem?
Each subject belongs to one of more than two independent groups, and each group provides measurements on the same variable. The groups are independent, meaning measurements from one group do not influence or pair with those in other groups.
Focus: Compare the means of more than two independent groups to determine which groups differ significantly.
Analysis: Multiple pairwise comparisons between groups, often involving corrections to control for increased type I error (false positives) → oneway anova with post-hoc Tukey test
Example: Does the average well-being differ between male carers, female carers, male widowers, and female widowers?
Variable measured: Well-being scores for each group.
For groups: Group 1: male carers, Group 2: female carers, Group 3: male widowers, Group 4: female widowers.
Independent groups, because each subject belongs to only one group with no pairing or matching, and variables are compared independently.
Uses the hypothesis testing approach, but requires multiple comparison corrections like Bonferroni or Holm-Bonferroni to control for the increased chance of type I errors due to multiple tests.
What is the difference between unadjusted and adjusted p-values and confidence intervals?
Unadjusted p-values and confidence intervals
Calculated without considering multiple comparisons.
Reflect the probability or interval for a single hypothesis test.
When multiple tests are done, using unadjusted values increases the chance of type I errors (false positives).
Adjusted p-values and confidence intervals
Modified to account for multiple comparisons and control the overall type I error rate.
Methods like Bonferroni, Holm-Bonferroni, or Tukey-Kramer adjust these values.
Result in stricter criteria for significance (e.g., smaller alpha levels or wider confidence intervals).
Help reduce false positives when testing many hypotheses simultaneously.
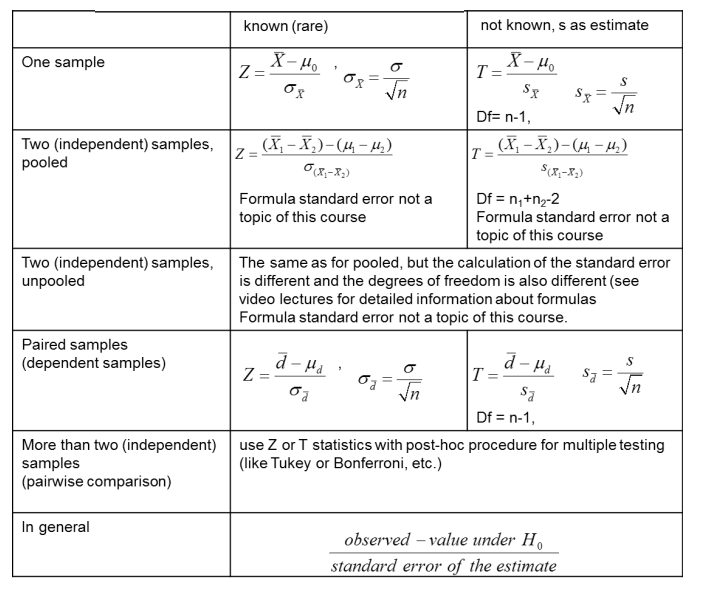
Summary of test statistics for groups comparison
You only need to memorize the standard error formula of the one sample and paired sample t-test.
Further: T: (estimate - value under H0)/standard error of the estimate