AICE Environmental Management Terms & Definitions Study Set
1/46
There's no tags or description
Looks like no tags are added yet.
Name | Mastery | Learn | Test | Matching | Spaced |
|---|
No study sessions yet.
47 Terms
what is the cambridge definition of the scientific method?
interplay between observations and the formations testing and evolution of hypothesis
what words should you use to show trends in data?
increasing, decreasing, plateau, rapidly, slowly, steady
what is a hypothesis?
statement on topic you are investigating, testable prediction that poses a relationship between two variables
what is the dependent variable?
what you are measuring
what is the independent variable
variable that is changed
what is a good hypothesis?
-is a statement (not a question)
-be a prediction with cause and effect
-states relationship with IV and DV
-be short in length
-NO MORE IF THEN BECAUSE
what is a null hypothesis?
states that two variables are not related
what is an alternative hypothesis?
aka an experimental (regular) hypothesis
-shows relationship between two variables
what are the 7 steps to designing an investigation?
1) decide IV and range of values
2) list all control variables
3) decide how to keep controls the same
4) decide number of repeats to carry out
5) decide timeline of experiment
6) plan which measurements to take out of DV and which equipment used to do so
7) analyze data (avg/more takes)
what is qualitative data?
non-numerical, descriptive data
what is quantitative data?
numerical data
what are the two types of quantitative data?
discrete and continuous
what is discrete data?
numerical data that has finite number of values and only includes whole numbers (ex: # of trees)
what is continuous data?
numerical data that has infinite possibilities and can take any value (ex: time, speed, temperature)
what is primary data?
data collected by you or a group doing investigation (first-hand)
what is secondary data?
information that already exists somewhere collected by other people that is still relevant and useful (second hand)(ex: web, papers)
what is a target population?
subset of people or organisms to which the conclusion of the study can be applied
*sample should be representative of target population
what are some limitations of an experiment?
time, money, equipment, ICT, transportation requirements, # of people required to collect data
what are the guidelines to drawing a table?
-two or more columns
*1st is IV
*2nd+ are DV
-column must be headed with names of variables and appropriate units
-numerical values only in table (no units)
when is a line graph used?
when there is a continuous change in data (usually over time)
describe line graphs
-points plotted as x or o (no blobs)
-IV put on x-axis, DV put on y-axis
-use 75% of graph
when are bar graphs used?
to show data that fits into two categories
describe bar graphs
-has 2 axis
-bars must be drawn with equal width and equal spaces between them
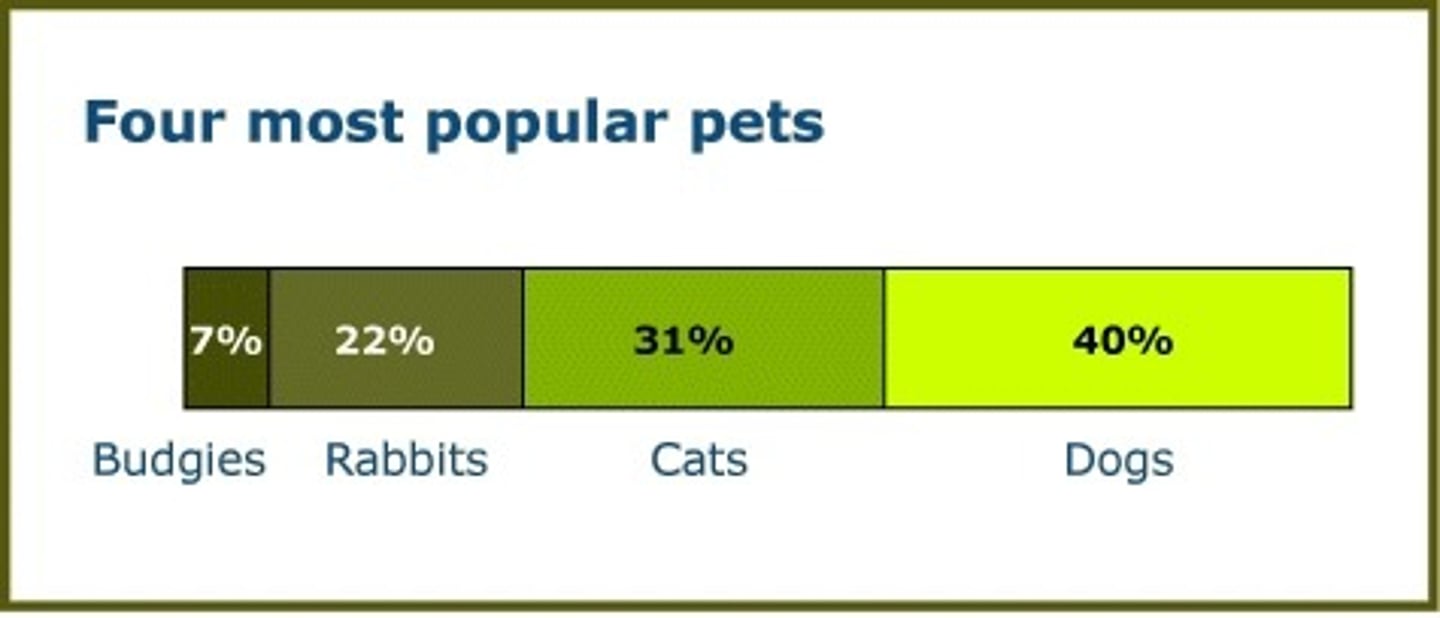
when are divided bar graphs used?
used to show set of data represented by percentages

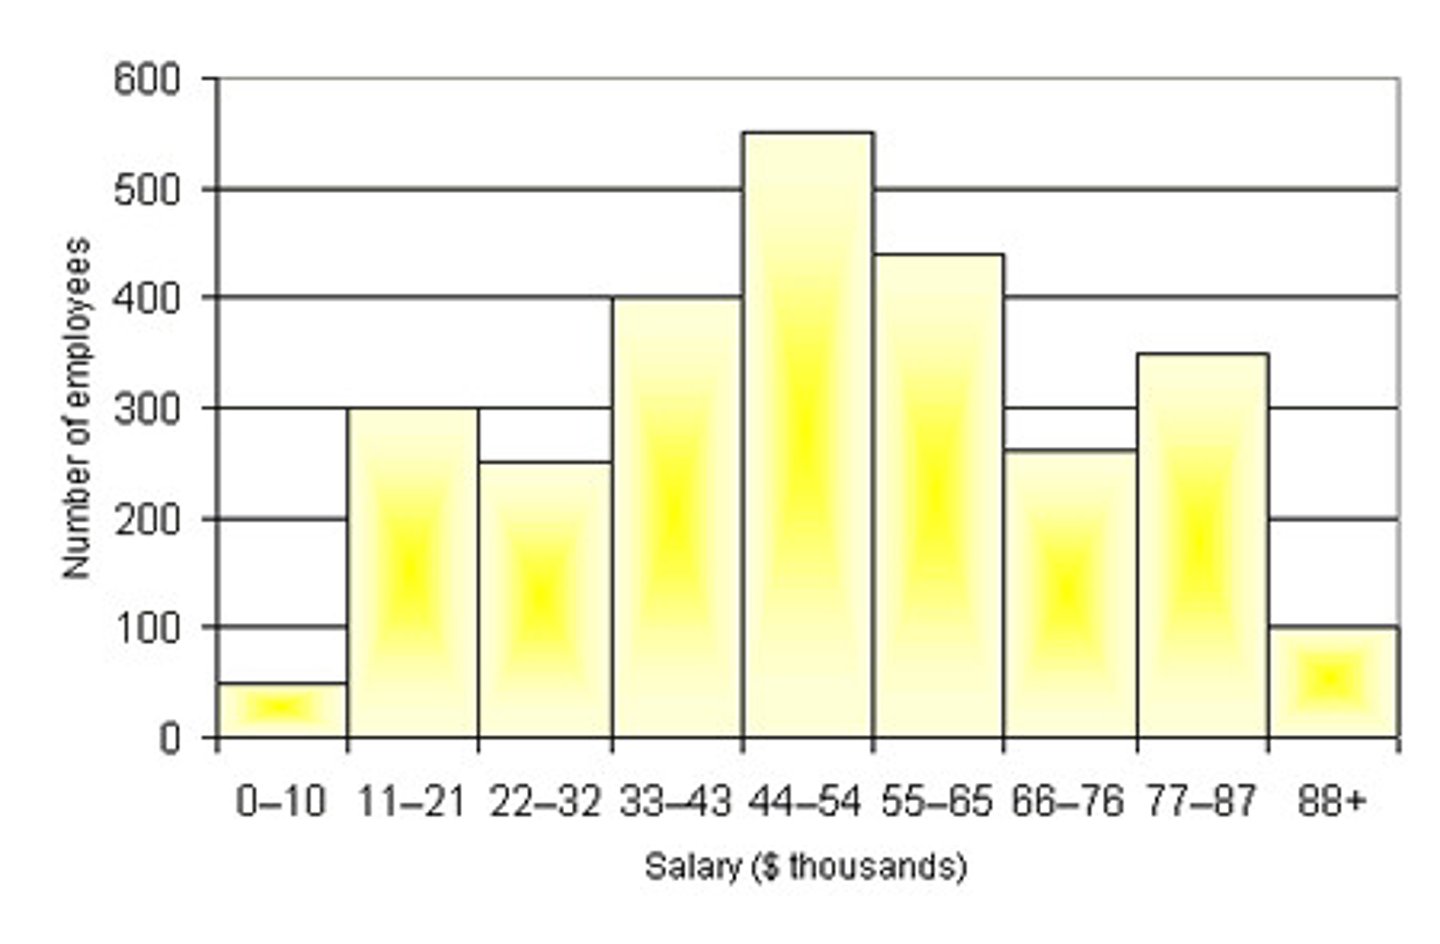
when are histograms used?
show frequencies of data in different categories or changes over a period of time
describe histograms
-x-axis: range of values divided into intervals (values do not overlap
-y-axis: shows frequency or percent of data collected by falling into each of the intervals
-bars represent each interval (no gaps)

when are pie graphs used?
shows proportions that relate to the data in each category (no more than 6 sections, no less than 2)
when are scatter plots used?
to see if a relationship exists between two sets of data
*helps to see if one set of data is likely to change in relation to a second set
describe scatter plots
-correlation does not mean causation!!
-plotted the same as a line graph but don't connect points
-sometimes make a line of best fit (do NOT pass through points)
what does the lincoln index measure and what is the equation?
-shows population sizes of individual animal species
*uses capture mark recapture method
- equation: N=(n1*n2)/m2
N=estimated pop. size
n1= 1st sample size
n2= 2nd sample size
m2=# of marked individuals recaptured in 2nd sample
what does simpsons diversity index measure and what is the equation?
-measure diversity of ecosystem (evenness and diversity)
- D = 1 (En(n-1)/N(N-1))
N=total # of organisms of all species
n=total # of organisms of a particular species
what is percent frequency and what is the equation?
-probability that a species will be found in a single quadrant
- % frequency = # of quadrants in which species is found/total # of quadrants
what is big data?
-collections of data that have become so large that traditional means of analysis or processing are ineffective
what are some benefits of big data?
-quickly processes lots of data in several forms
-cost savings
what are some limitations of big data?
-needs to be adequately processed
-data quality control takes lots of time, effort, and money
-security issues
describe pitfall traps
measures species occurrence by digging hole and waiting for animals to fall in (only used for invertebrates) 1 covered container
2 rim level with surface
3 baited
4 preservatives in traps checked frequently
Limitations:
-only mobile animals will be caught
-trapped animals may kill other organisms
-if preservatives are used it may attract or repel
-some species may avoid/ escape the trap/ die
describe sweep nets
swing net back and forth, when you catch something you count it (catches lots of animals, inexpensive) -swept through vegetation or air to collect invertebrates
-standardisation of the method can be attempted by using the same number of sweeps of the same length
-limitations:
Mobile species may escape such as flying insects
describe transects
line or stick laid on ground to measure on the line, shows patterns of change for animals, gives indication on plant density
describe plankton nets
sweep plankton and nothing else up, used to sample diversity (is expensive)
describe the electronic meter
pH measure voltage produced by solutions like soils
capture-mark-recapture
estimates population size, helpful for animals that migrate
describe light traps
used to survey nocturnal moth, learn about wildlife -high flying insects attracted to light
-use light traps
-identify moth species and count individuals
-set traps in representative areas
-repeat at different times/seasons
Limitations
-moths only fly during their adult phase and activity is affected by weather and seasons so not finding a species doesn't mean it's absent
describe beating trays
shake branch area and knock off insects to count wildlife -used to sample invertebrates present on vegetation or above ground
- a sheet or tray is placed beneath the vegetation which is beaten several times with a stick. The invertebrates that are dislodged fall onto a sheet and are collected
Limitations:
-thicker branches shake less
-some species fly away
-higher branches can't be reached
describe questionnaires and surveys
measures opinions
describe quadrats
open frame: put square on ground and count, grid: measures population density, study plants and animals in small area -number of species
-percentage plant cover
-density-number is species per unit area
-to standardise the method and allow comparisons between sites it may be used in a specific sample area
-can categorise them in the following categories
A abundant
C common
F frequent
O occasional
R rare
describe kick sampling
sampling taken in full tray of water after stones of rivers are agitated, primary qualitative, looks at diversity of species or species presence Presence of aquatic organisms
1.net placed downstream of sample site so current flows into the net
2.sediment disturbed by repeatedly scraping boot over the river bed so invertebrates flow into the net
3. Defined area and time if substrate disturbance to standardise method
4.species identified
5.individuals counted
Limitations:
-accurate standardisation is difficult
-burried organisms or those fixed to stones may not be dislodged
describe water turbidity
measure of relative clarity in water, determines contaminants in water, keeps pipes unclogged Secchi disk
Lower a secchi disk into the water until the black and white sectors cannot be distinguished
Record the depth of the disk
Limitations
-the depth judgment is subjective
-sunlight levels may affect visibility
-the water may not be deep enough for the segments to become indistinguishable
Need to control
-time of day and weather conditions
-same person and disk
-replicates for statistical tests
-water is a safety hazard