Week 5 - Distributions of probability II
1/7
Earn XP
Description and Tags
Your Learning Objectives for the week are: LO1: Z-Score distribution LO2: Student T distribution LO3: Normal distributions in Excel
Name | Mastery | Learn | Test | Matching | Spaced | Call with Kai |
|---|
No analytics yet
Send a link to your students to track their progress
8 Terms
What is the Z-score distribution used for and what does it look like?
hypothesis testing and diagnostics of the linear regression model its role is essential. It
is also called the Standard Normal distribution to stress the fact this is a particular,
Standard, version of the Normal distribution.
How can a normal probability distribution be converted into a Z-score probability distribution?
Any Normal probability distribution can be converted into a Z-score probability distri-
bution by calculating the Z-values. Informally we say that we standardise the data. A
Z-value (or Z-score) is the distance between a selected value, designated Xi
, and the
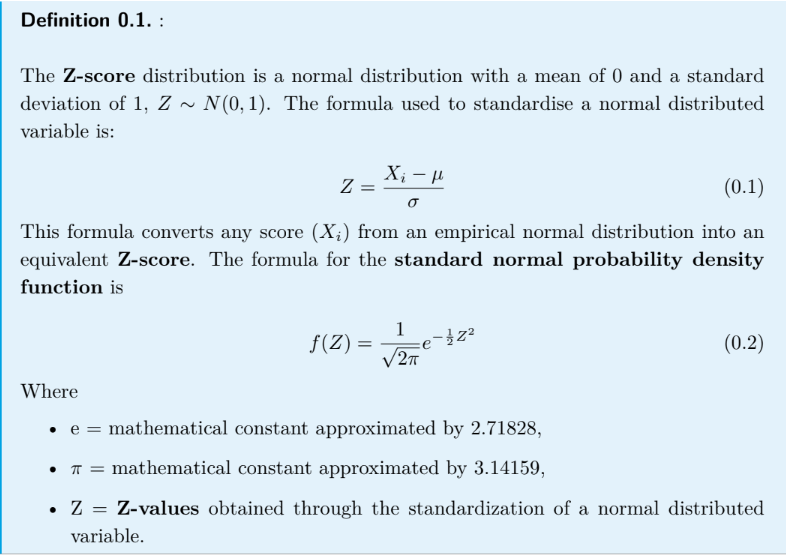
population mean μ, divided by the population standard deviation, σ.
What are Z-scores?
Standardised and unitless, they are the number of standard deviations from the mean. A Z-score of 1 indicates that the original score (Xi) lies one
standard deviation above its mean. While a Z-score of -1 means that the original score
(Xi) lies one standard deviation below the mean. The Z-score tells us the umber of stan-
dard deviations the original score (Xi) lies above or below its mean.
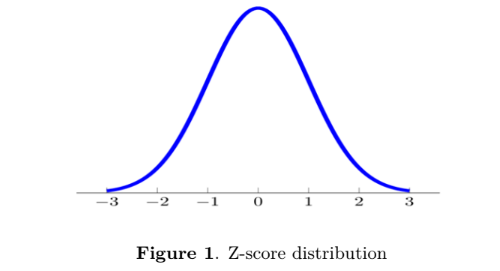
Explain what different areas under the curve show about the Z-score distribution
In the area under the curve between 1 and -1 standard deviations lies 68.26%
of the probability of the Z-score distribution.
• In the area under the curve between 2 and -2 standard deviations lies 95.44%
of the probability of the Z-score distribution.
• In the area under the curve between 3 and -3 standard deviations lies 99.72%
of the probability of the Z-score distribution.
Why are Z-scores used?
Z scores give the relationship between a data point, the mean, and the standard
deviation. Therefore, they help place a data point within the context of the
entire dataset.
• The goal in inferential statistics is to learn about the characteristics of the pop-
ulation (parameters) using the characteristics of the sample (statistics). With
the Z-score distribution we avoid having to do empirical research on the whole
population.
How do you calculate the t-score?
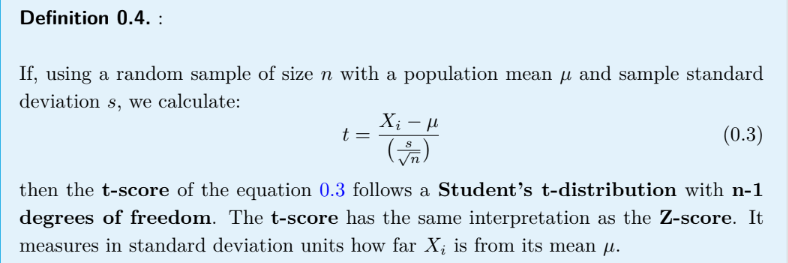
To calculate t-score we had to calculate another statistics, the sample standard devi-
ation s, which results in losing some information and, therefore, the degrees of freedom
are n-1.
What are some characteristics of the student’s t-distribution
The graph for the Student’s t-distribution is similar to the standard normal curve
and at infinite degrees of freedom it is the Z-score distribution, see Figure 12.
8
• The mean for the Student’s t-distribution is zero and the distribution is symmetric
about zero, again like the Z-score distribution.
• The Student’s t-distribution has more probability in its tails than the standard
normal distribution because the spread of the t-distribution is greater than the
spread of the standard normal.
• Because the Student’s t-distribution has a greater spread than the Z-score d
distribution, the value of t for a given α significance level is larger in magnitude than
the corresponding Z value,
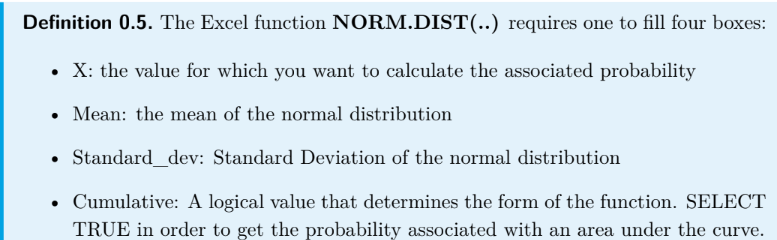
What does the excel function NORM.DIST(..)?