AP statistics unit 1
1/21
Earn XP
Description and Tags
Name | Mastery | Learn | Test | Matching | Spaced | Call with Kai |
|---|
No analytics yet
Send a link to your students to track their progress
22 Terms
5Ws + H
who, when, where, why, what, how
sample
a portion of the entire population
population
the entire group
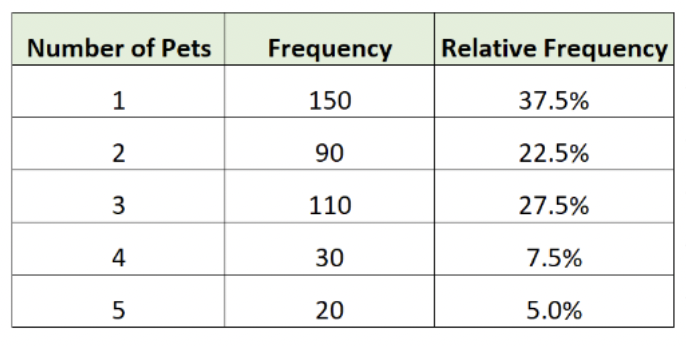
frequency
counts
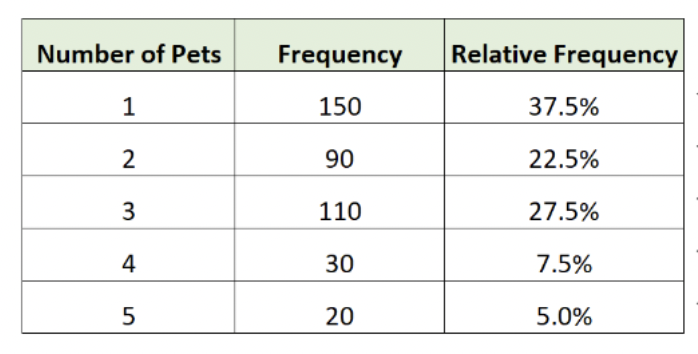
relative frequency
percentages
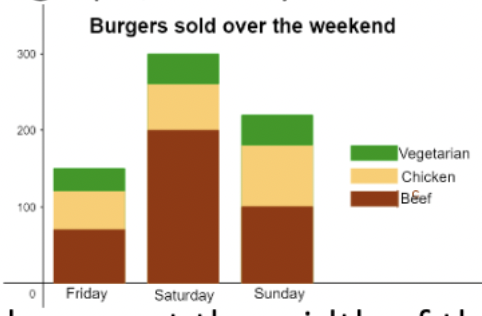
segmented bar graph
stacked vertically
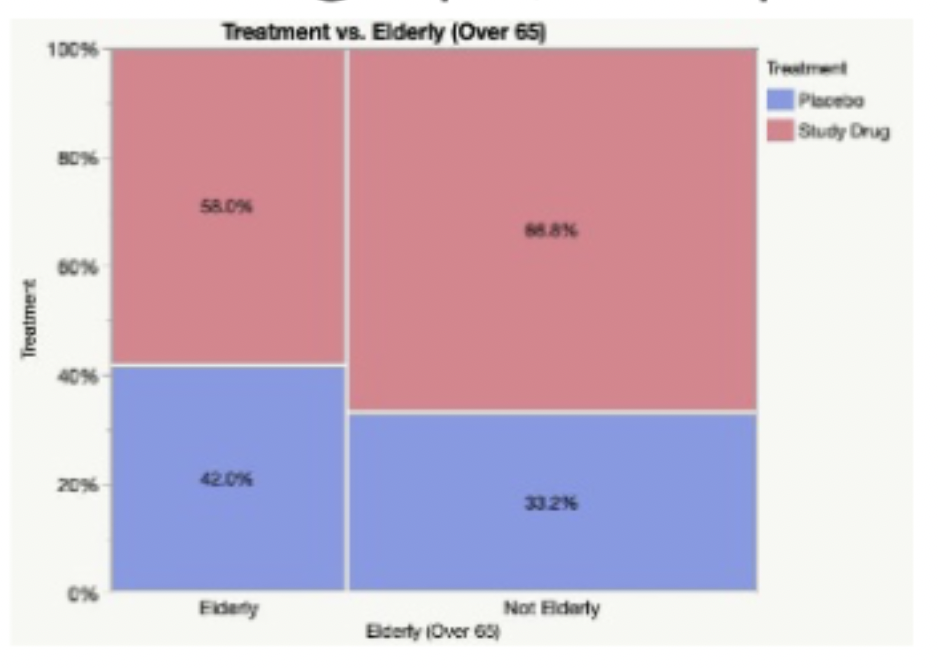
mosaic plot
like bar graph but frequency demonstrated by width
how to describe quantitative data
shape, center (, spread, special conditions
shape
unimodal, bimodal, multimodal, or uniform
symmetric, skewed left/right
center
median & mean
spread
standard deviation, variance
IQR, range
special conditions
clusters, outliers
5# summary
minimum, Q1, median, Q3, maximum, built for box-whisker plot
when comparing distributions, when both symmetrical…
use mean & SD
when comparing distributions, when both skewed…
median & IQR
when comparing distributions, when one symmetrical one skewed…
mean & IQR
shifting data
adding/subtracting the same number from each data value, shift the 5# summary and mean by that amount. IQR, range, SD, and shape stays the same.
scaling data
multiplying/dividing each value in a dataset by a constant, multiplies/divides the measures of position, mean, and measures of spread by that amount. The shape of the graph will stay roughly the same, but it will be scaled
empirical rule
68-95-99.7
z score =
(n - mean)/SD
z score to %
normalcdf(-99, z score) or (z score, 99)
% to z score
invNorm (percentage)