Stat. Week 2 - BIVARIATE PEARSON CORRELATION
1/11
There's no tags or description
Looks like no tags are added yet.
Name | Mastery | Learn | Test | Matching | Spaced |
|---|
No study sessions yet.
12 Terms
Pearson Correlation
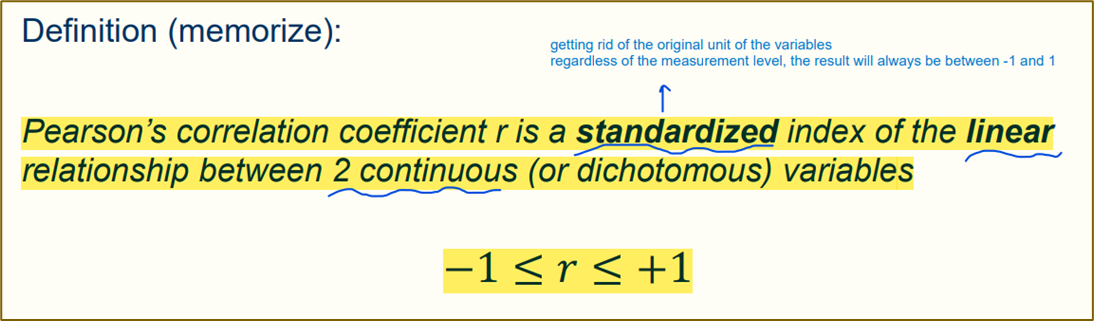
Main idea:
If two variables are dependent of each other, Pearson’s r gives us information about the strength of this association
We don’t know if one variable causes the other (no causal direction)
Changes in one variable are associated with changes in the other variable
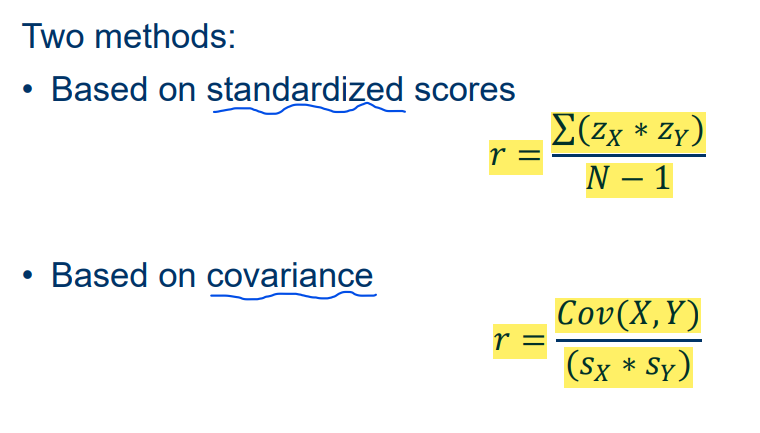
Calculation Pearson’s r
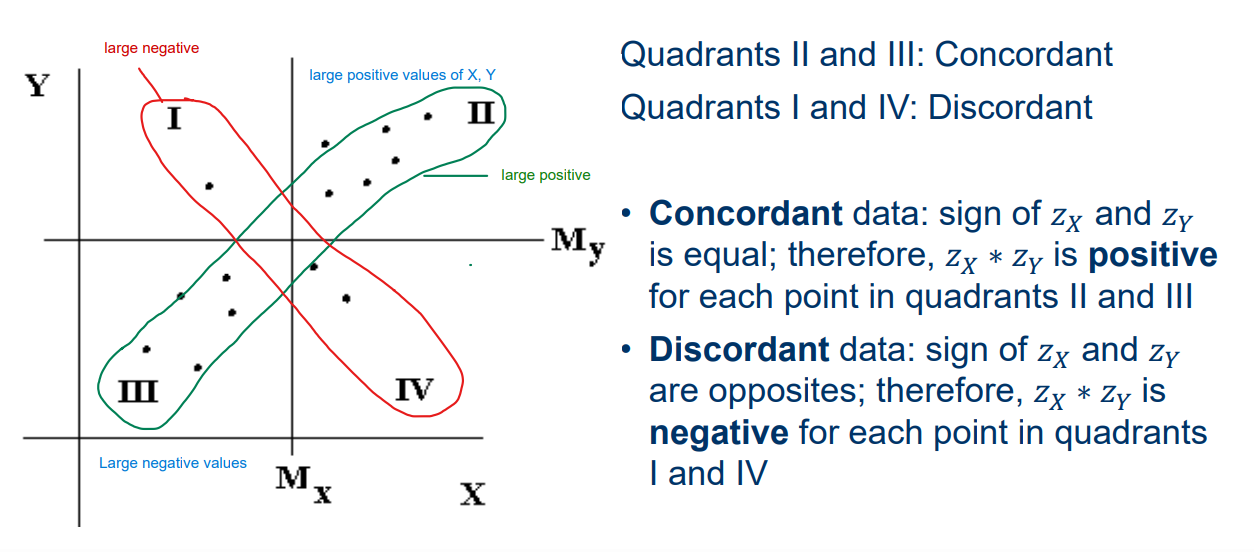
It is helpful to divide a X, Y scatterplot in 4 quadrants
Concordant data points: data points that lie above the mean of both X and Y or below the mean of both X and Y > II and III
Discordant data points: data points that lie below the mean of X and above the mean of Y, or above the mean of X and below the mean of Y > I and IV
Assumptions
Scores of the X and Y variables:
are quantitative (or both dichotomous)
are linearly related
have a bivariate normal distribution
do not have extreme outliers
Homoscedasticity: Y-scores have the same variance across levels of X (and vice versa)
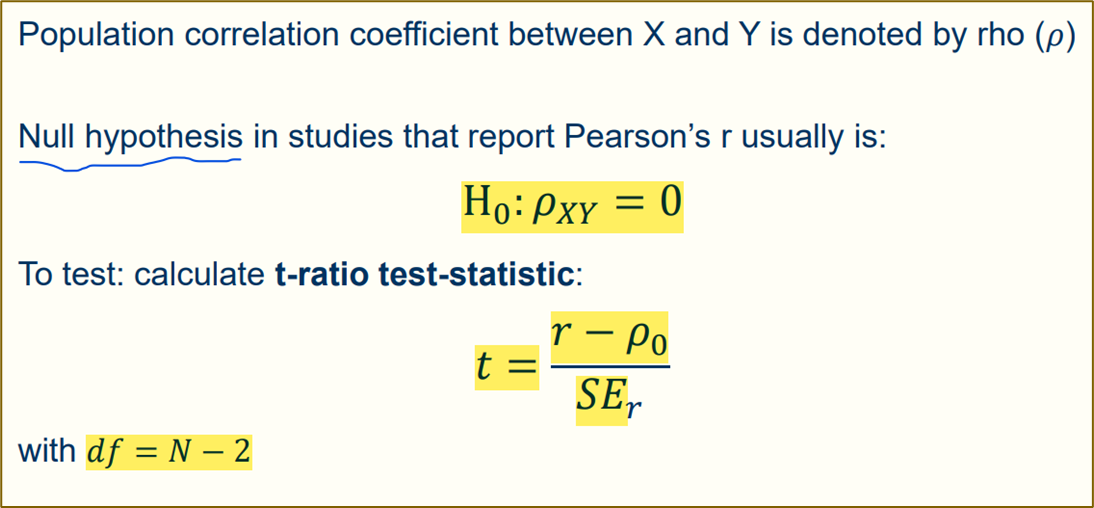
T-test
Factors that can influence Pearson’s
Data patterns in X, Y plot (see ‘The cross’)
Selection of Extreme Groups
Correlations of samples with combined groups
Extent to which r is controlled by other variables
Bivariate outliers
Different shapes of distribution of X and Y (Normality assumption)
Curvilinear or nonlinear relationships
Transformation of data (e.g. log)
Attenuation as a result of unreliability of measurement*; unreliable measurements weaken the correlation between such measurements
Artificial part-whole correlations (e.g. using a sumscore)
Aggregated data (Simpson’s paradox and the ecological fallacy)
Pearson’s and causal conclusions
the following are conditions for interpreting an association between X and Y as causal:
Cause X and outcome Y must correlate
Cause X must precede outcome Y in time
Association between X and Y must not be spurious (no common cause)
A theory is available that explains the association between X and Y
Adding a third variable
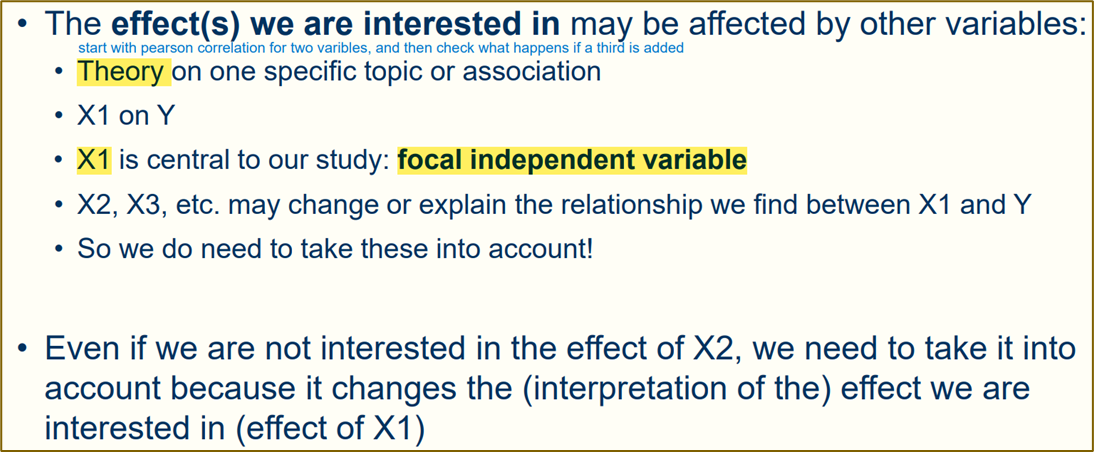
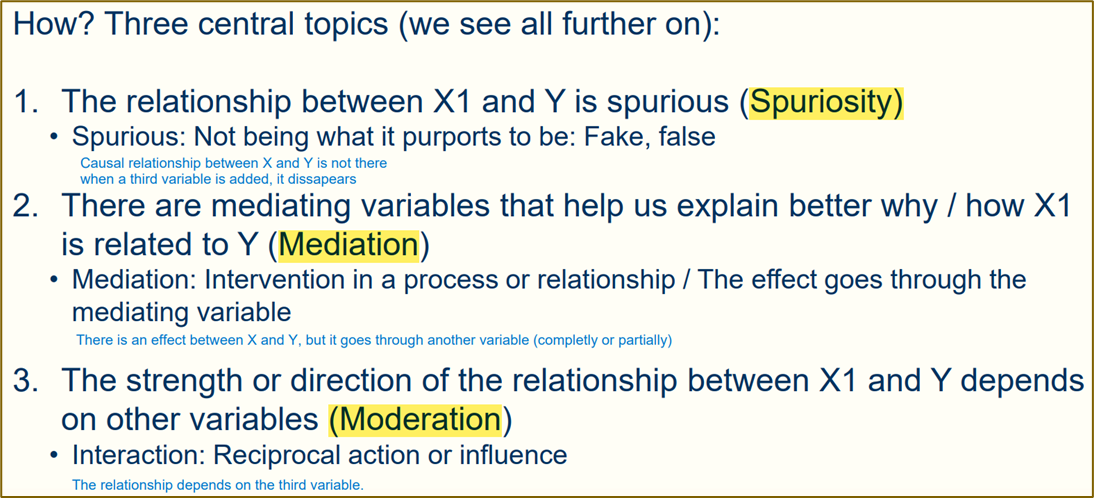
Elaboration of an Association
1. Think about how the variables Y, X1 and control variable X2 are theoretically associated with each other (make conceptual model)
2. Estimate the uncontrolled association between X1 and Y. This yields a measure of association, e.g. 𝑟1𝑌
3. Keep the association between X1 and Y constant for the influence of X2 (control for X2)
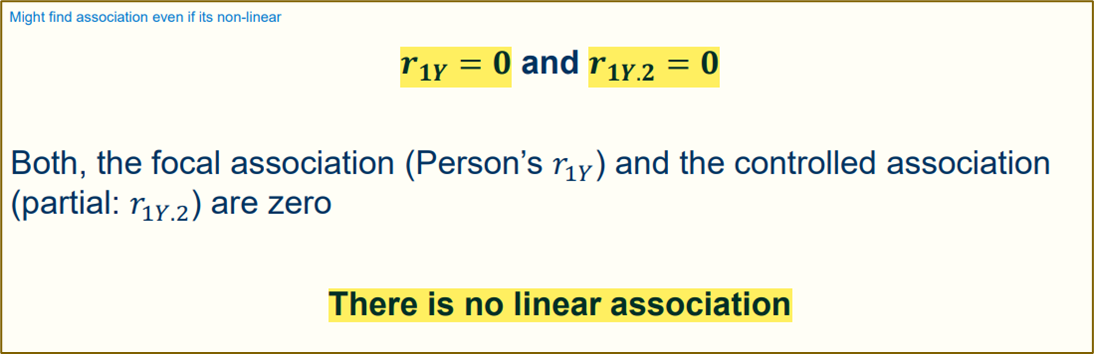
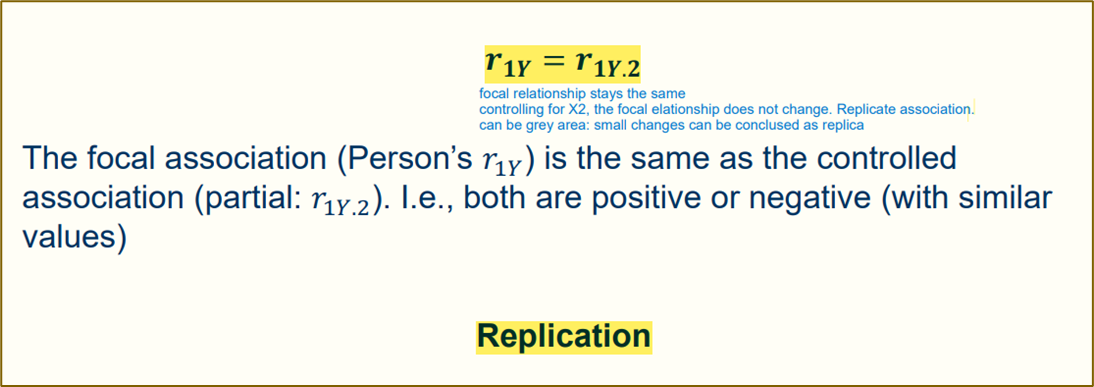
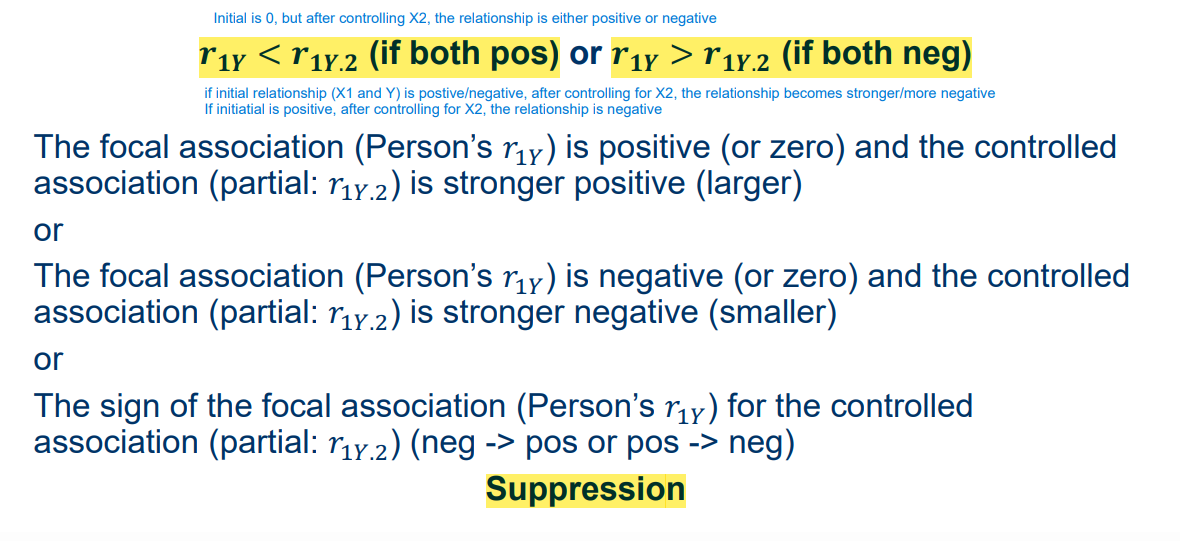
4. Inspect whether the (controlled) association between 𝑟1𝑌 has changed
5. Depending on the nature of the change in association and keeping in mind your theoretical model (step) we decide that there is a particular type of association between the variables
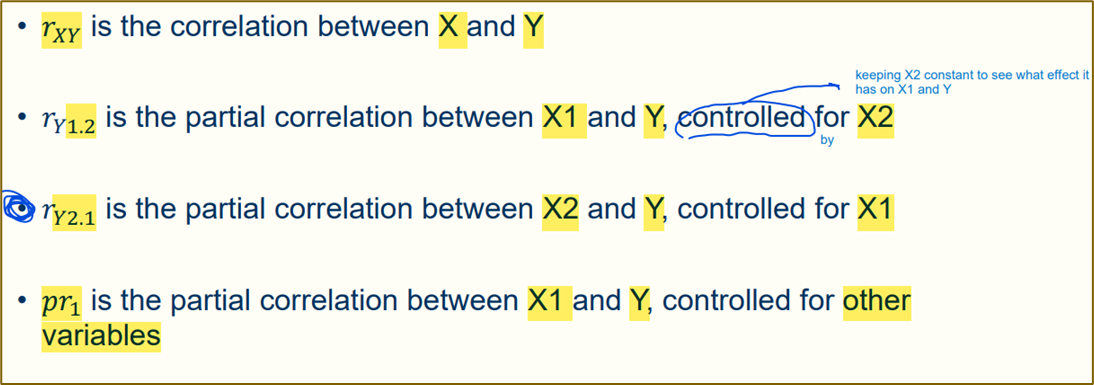
Partial correlation coefficient
It measures the linear association between X1 and Y while controlling for X2.
Partial: That specific part of the total correlation associated with X1, and not associated with X2.
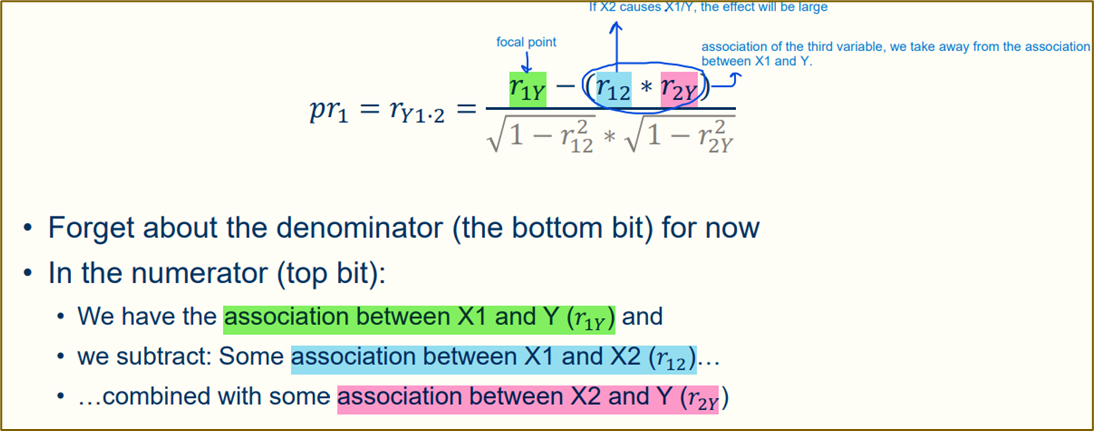
Bivariate Pearson Correlation
The numerator rY1−(r12×r2Y) adjusts the raw correlation rY1 by removing the effect that X2 has on both X1and Y.
This adjustment helps isolate the unique relationship between X1 and Y, independent of X2.
How It Works:
r12×r2Y is subtracted from rY1 because it represents the indirect association between X1 and Y through X2. This part accounts for any confounding effect of X2 on the observed correlation between X1 and Y.
Interpretation:·
If the partial correlation pr1 is significant, it indicates that X1and Y are correlated even after controlling for X2.
· A larger effect of X2 (reflected in r12 and r2Y would decrease the value of the numerator, reducing the partial correlation pr1.
Results