UNIT 4 THE GLOBAL ECONOMY- The best ones
1/108
There's no tags or description
Looks like no tags are added yet.
Name | Mastery | Learn | Test | Matching | Spaced | Call with Kai |
|---|
No analytics yet
Send a link to your students to track their progress
109 Terms
4.1 Benefits of international trade
Define international trade
Trade that involves the exports and imports of goods or services between countries.
List the benefits of international trade
- Increased competition: Domestic firms compete with foreign firms, which leads to increased efficiency
- Lower prices: Consumers can buy cheaper products and producers can buy cheaper raw materials. Prices are lower in some countries because of access to natural resources, differences in the quality of the labour force/capital, levels of technology.
- Greater choice: International trade enables consumers to have greater choice of products (domestically + internationally produced)
- Acquisition of resources: Different countries possess different resources. International trade enables the obtention of resources a country doesn't possess.
- More foreign exchange earnings: : International trade enables countries to obtain foreign exchange. If a country exports products, then that country will be paid in foreign currencies.
- Economies of scale: When producing for an international market and a domestic one, the size of the market and demand will increase.
- More efficient resource allocation: (assuming free trade) Countries that are best at producing certain goods and services will produce them; they will be able to produce them at the lowest cost and take advantage of their efficiency
- More efficient production
- Access to larger markets
Free trade
International trade that is not subject any kind of trade barriers
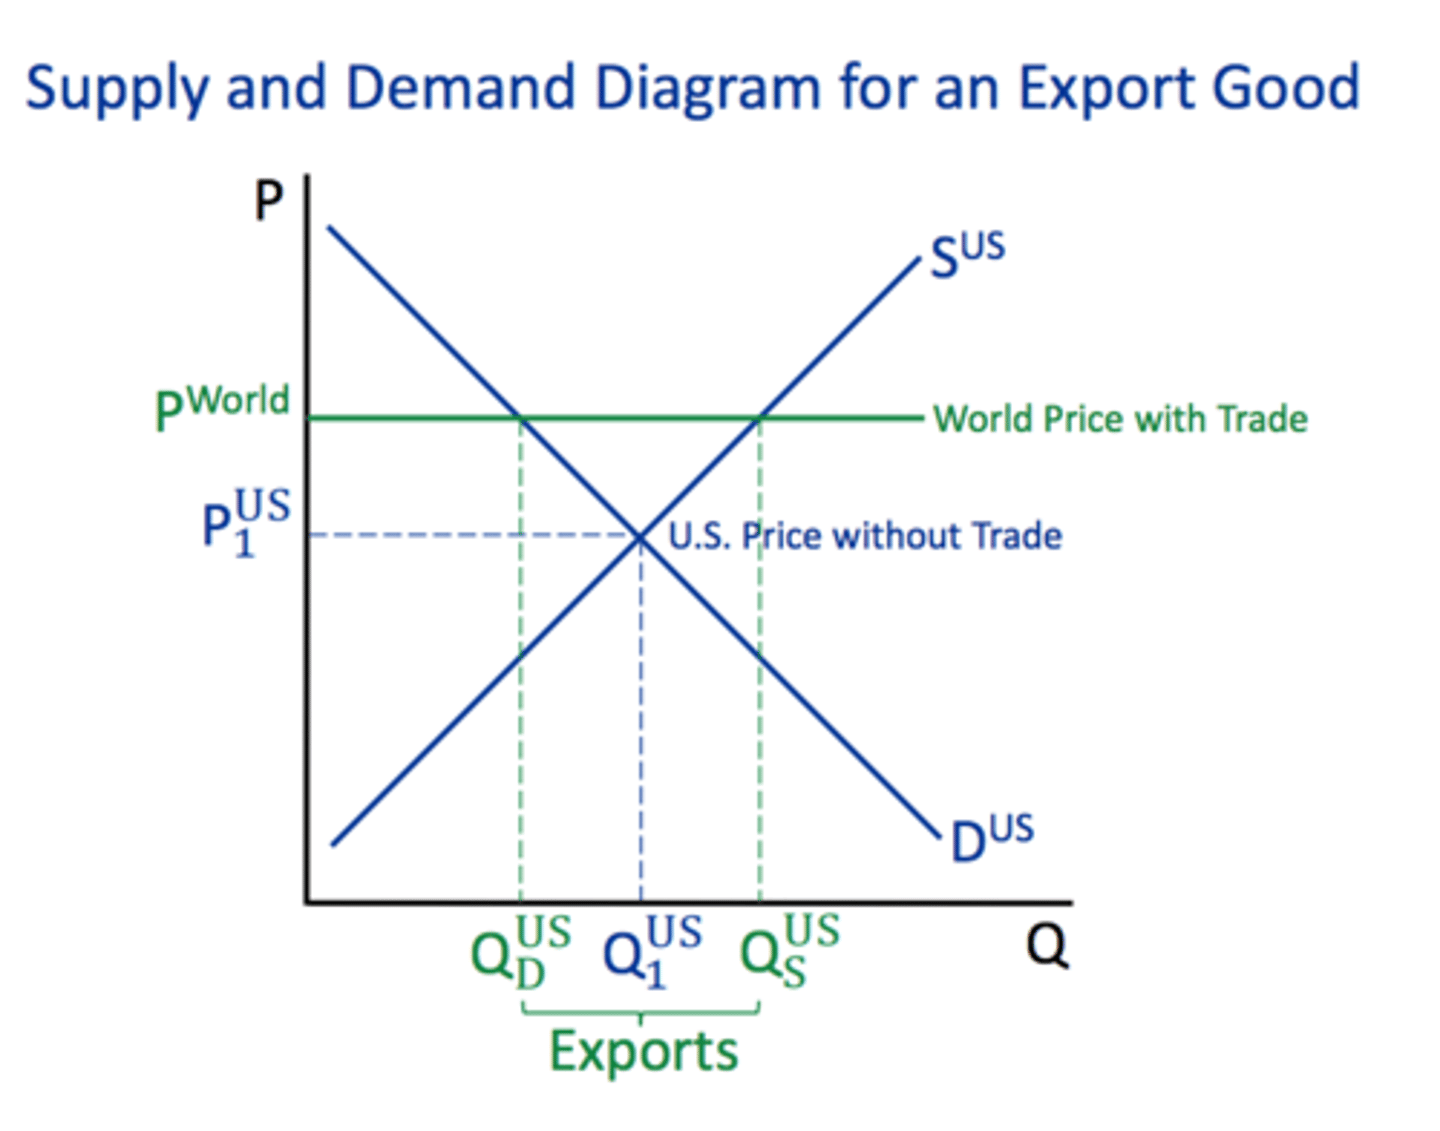
Draw a free trade diagram illustrating exports
The domestic country can produce the good more efficiently and cheaply than abroad, so the domestic country export the good. Thus, world price is above domestic price.
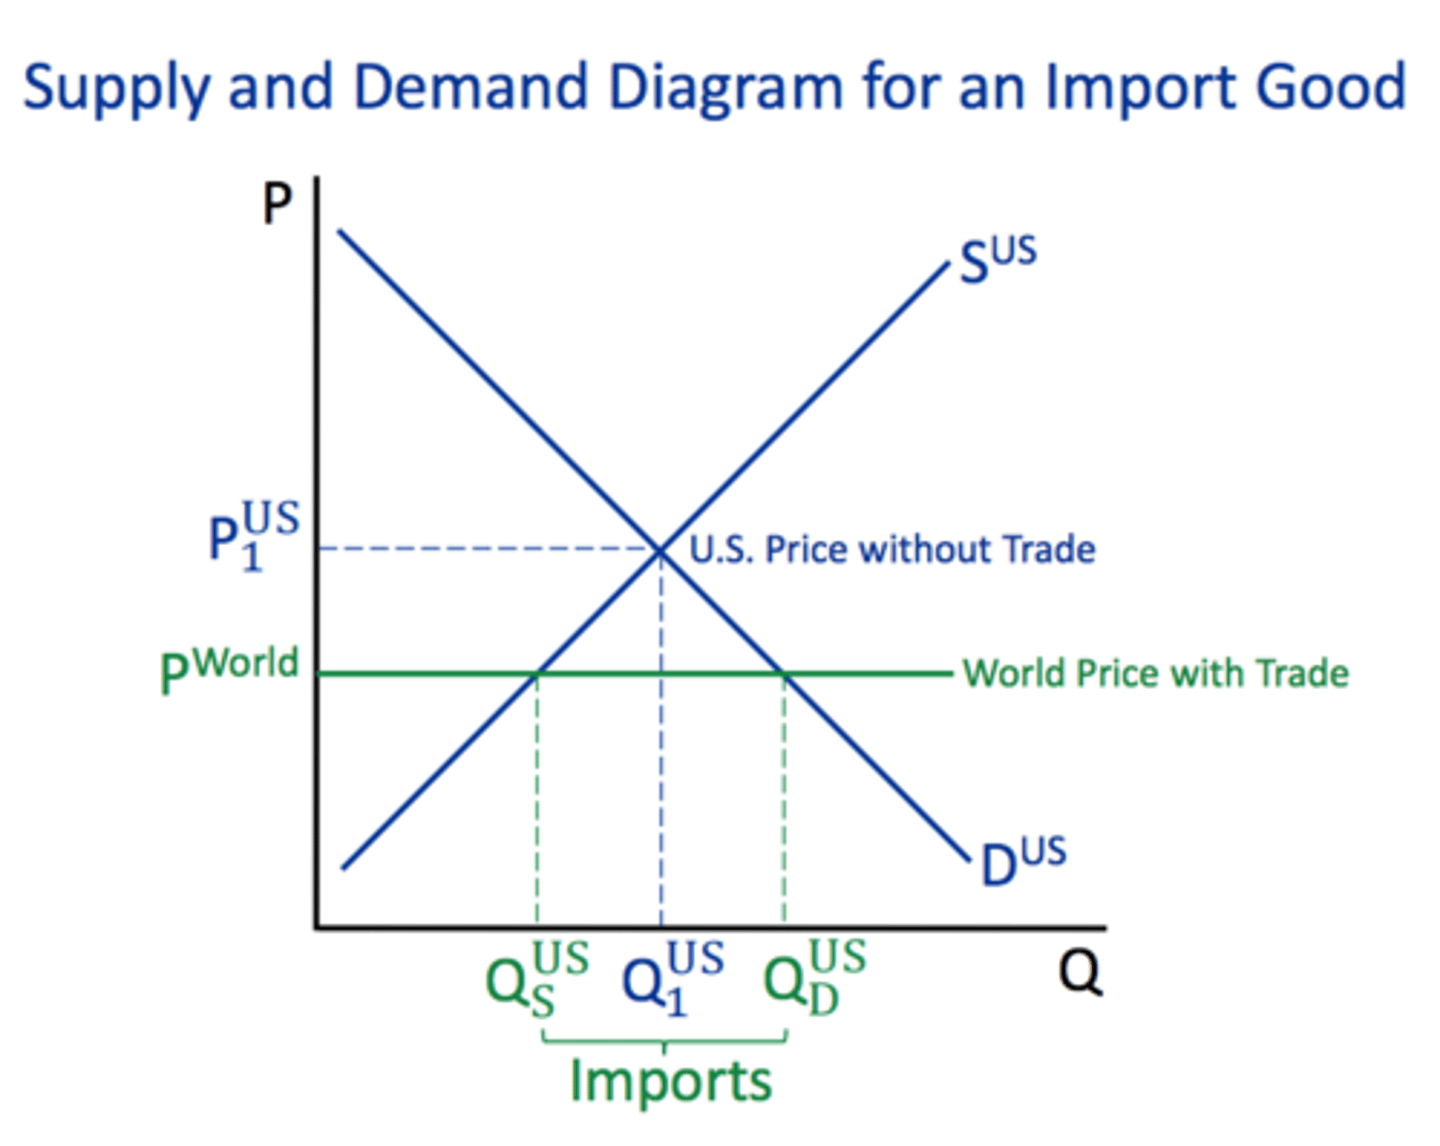
Draw a free trade diagram illustrating imports
The foreign countries can produce the good more efficiently and cheaply than abroad, so the domestic country imports the good. Thus, the world price is below domestic price.
Define free trade
International trade that is not subject any kind of trade barriers, such as tariffs or quotas.
Define exports
Goods and services produced in one country and purchased by consumers in another country.
Define imports
The value of goods and services purchased domestically that are produced abroad.
4.2 Types of trade protection
Define tariff
A tax that is placed on imports to protect domestic industries from foreign competition and to raise revenue for the government.
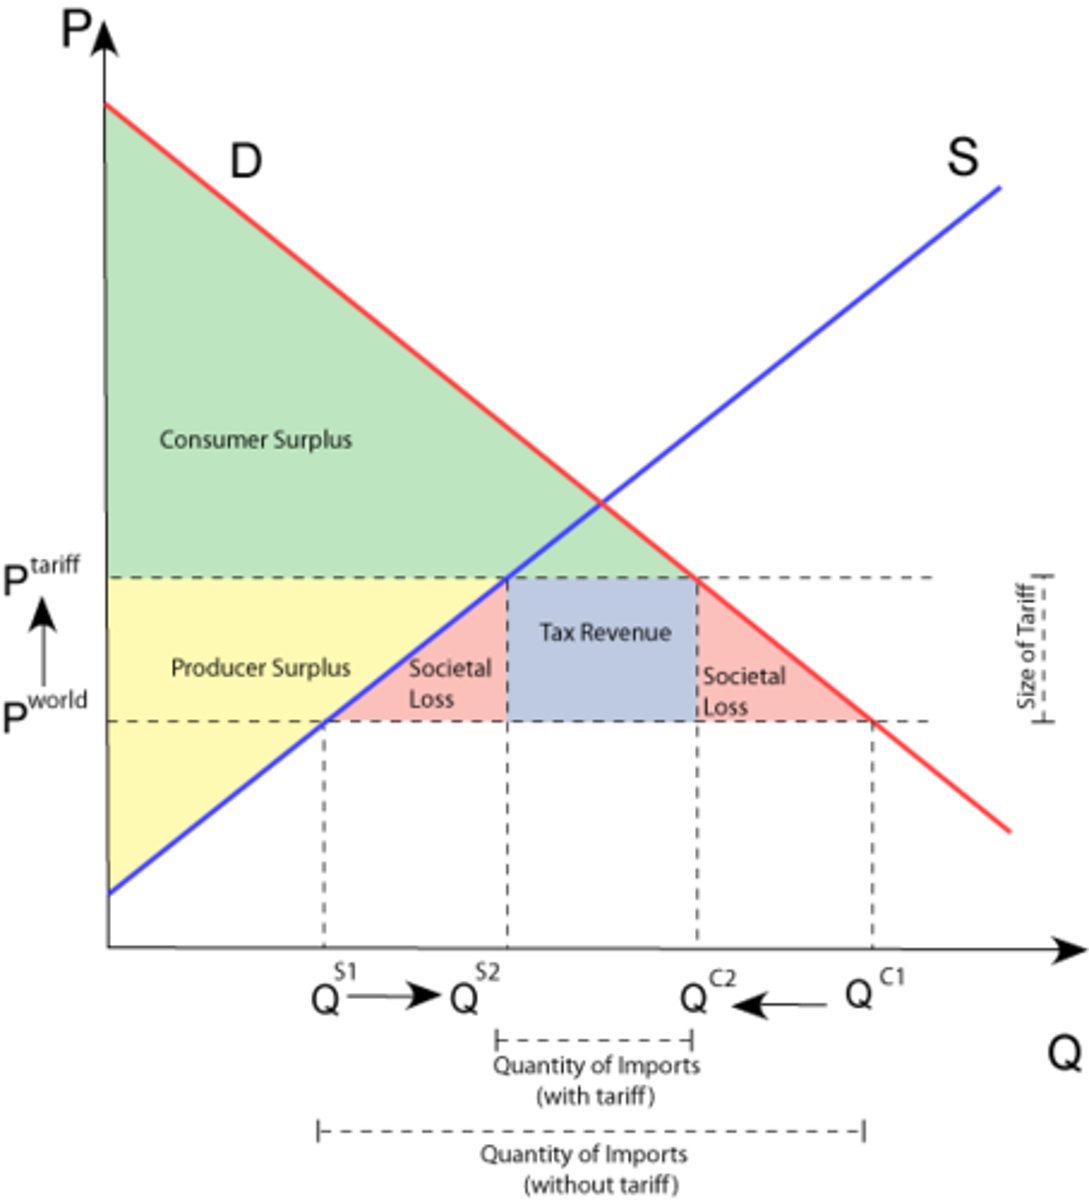
Draw and explain a tariff diagram
- A tariff shifts up the world supply curve by the amount of the tariff (Sw to Sw+T)
- This raises the price of the market from 'Pw' to 'Pw+tariff'
- Domestic quantity supply increases from Q1 to Q3 (LoS: as price increases, supply increases), and domestic quantity demand decreases from Q2 to Q4 (LoD: as price increases, demand decreases)
- Imports decrease from 'Q2-Q1' to 'Q4-Q3'
- Although foreign producers receive Pw+T, they have to pay the tariff to the government.
International tariff impacts on stakeholders
- Domestic production: increases from 0Q1 to 0Q3
- Domestic producer revenue: increases from g to g+a+b+c+h
- Foreign production: decreases from Q1Q2 to Q3Q4
- Foreign producer revenue: decreases from h+i+j+k to i+j
- Price: increases from Pw to Pw+T
- Government revenue: d+e
- Consumer surplus: -(a+b+c+d+e+f)
- Domestic producer surplus: a+b
- DWL: c+f

What are the two DWL areas in the tariff diagram?
- B is the production inefficiency: the goods between Q1 and Q3 could have been produced at a lower price (Pw) by very efficient foreign producers, but they have been produced by less efficient domestic producers, so welfare is lost.
- C is the "consumption inefficiency": this corresponds to the part of consumer surplus lost because the goods between Q4 and Q2 are no longer consumed
Tariff advantages
- Protection of domestic and infant industries: domestic production is increased and imports are decreased
- Anti-dumping: the tariff means that exports can no longer be exported at a price below production cost, which makes them less competitive
- Protects domestic employment: since domestic production is increased, which likely increases employment
- Increased government revenue
- Helps regulate current account position
Tariff disadvantages
- Market distortion: price increases, consumer surplus decreases, choice for consumers is decreased
- Production inefficiencies: allocation of resources has worsened and isn't efficient
- Retaliation: the country on which the tariff has been placed on can retaliate. This causes political tensions.
- Regressive:
Define subsidy (international)
An amount of money paid by the government to a firm, per unit of output, to encourage production and provide the firm an advantage over foreign competition.
Use a diagram to explain an international subsidy
- A subsidy decreases the cost of production of domestic producers, so they can produce more at each price, which shifts supply downwards by the amount of the subsidy
- Domestic production increases from Q1 to Q3
- Foreign producers supply the rest, which is now from Q3 to Q2

International subsidy impacts on stakeholders
- Domestic production: increases from 0Q1 to Q1Q3
- Domestic producer revenue: increases from a to a+b+e+f+g
- Foreign production: decreases from Q1Q2 to Q3Q2
- Foreign producer revenue: decreases rom b+c+d to c+d
- Government spending: e+f+g (opportunity cost)
- Consumer surplus: no change (however, subsidy will be funded by taxes, which might mean higher tax payments)
- Domestic producer surplus: e+f
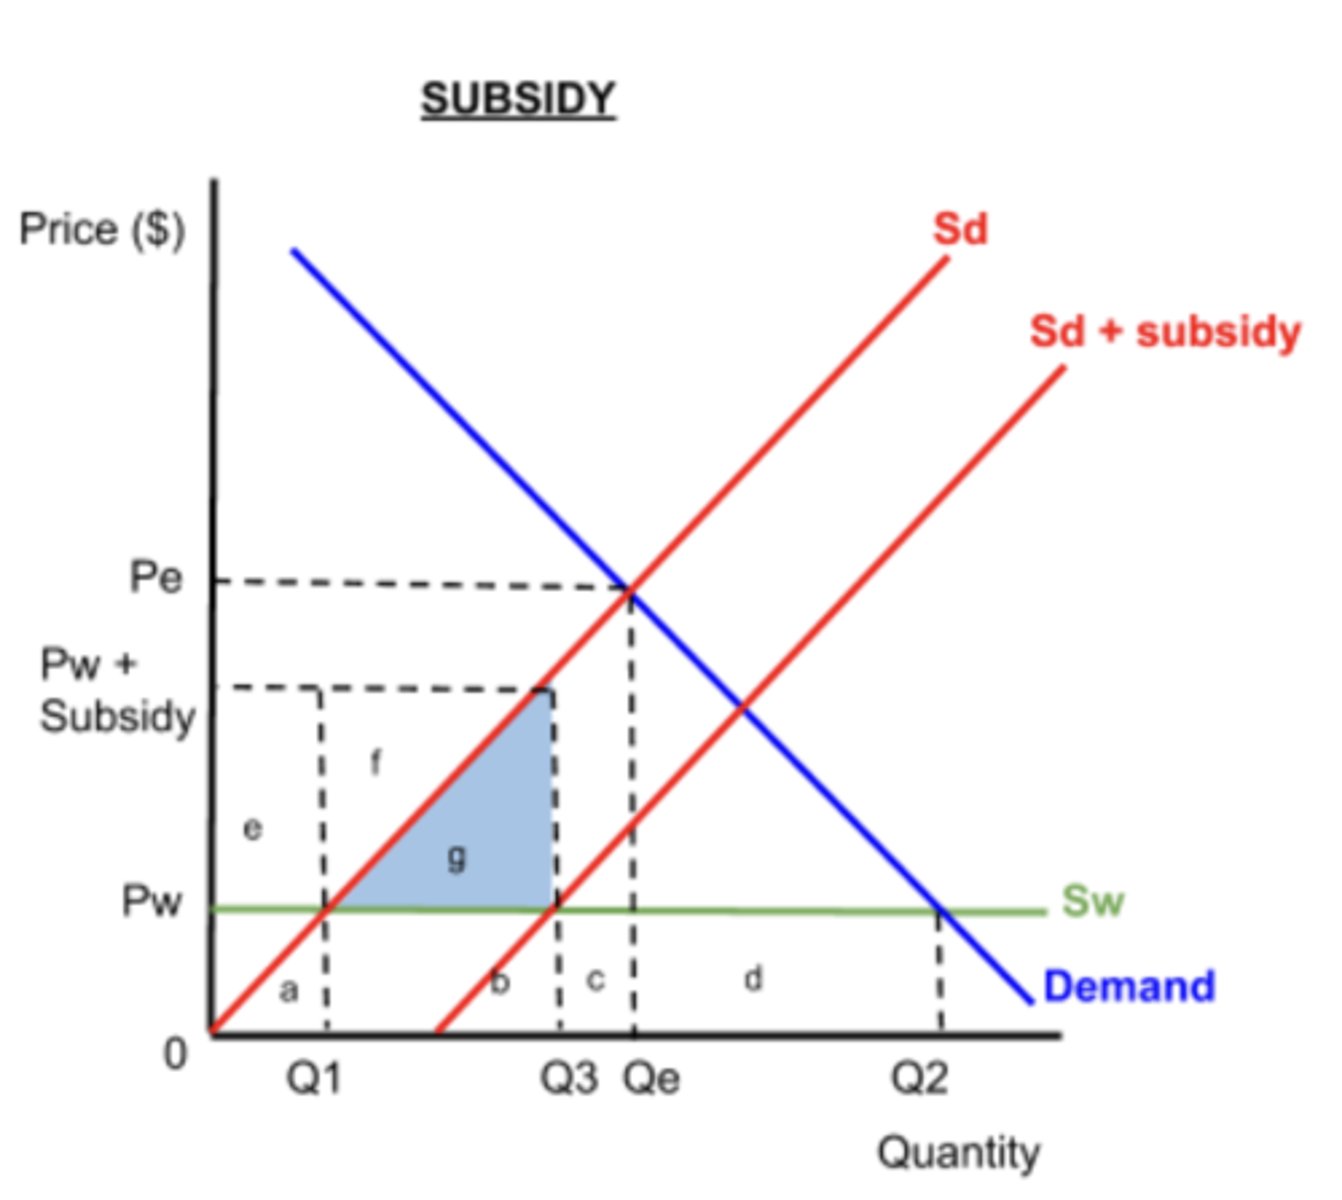
DWL in international subsidy diagram
- The goods between Q1 and Q3 are now produced by inefficient domestic producers, instead of more efficient foreign producers.
- The foreign farmers would produce this quantity for a minimum revenue of b, whereas the domestic producers need minimum revenue of b+g.
- Thus g represents the inefficiency of the domestic producers and a misallocation of the world's resources, since more of the world's resources are being used to produce the good than are necessary

Define quota
An import barrier that set limits on the quantity of goods that may be imported into a country.
Use a diagram to explain a quota
- Government imposes a quota of Q1Q3
- Domestic producers supply 0Q1 at a price of Pw and the importers produce their quota of Q1Q3 .
- However, there is an excess demand of Q3Q2 at the price Pw and so price begins to rise.
- Importers cannot to supply more wheat since they have filled their quota. But domestic producers begin to enter the market, attracted by the higher price of wheat.
- The domestic supply curve shifts to the right, above Pw.
- Eventually, the price settles at PQuota, where D = S and the total quantity of wheat demanded falls to Q4
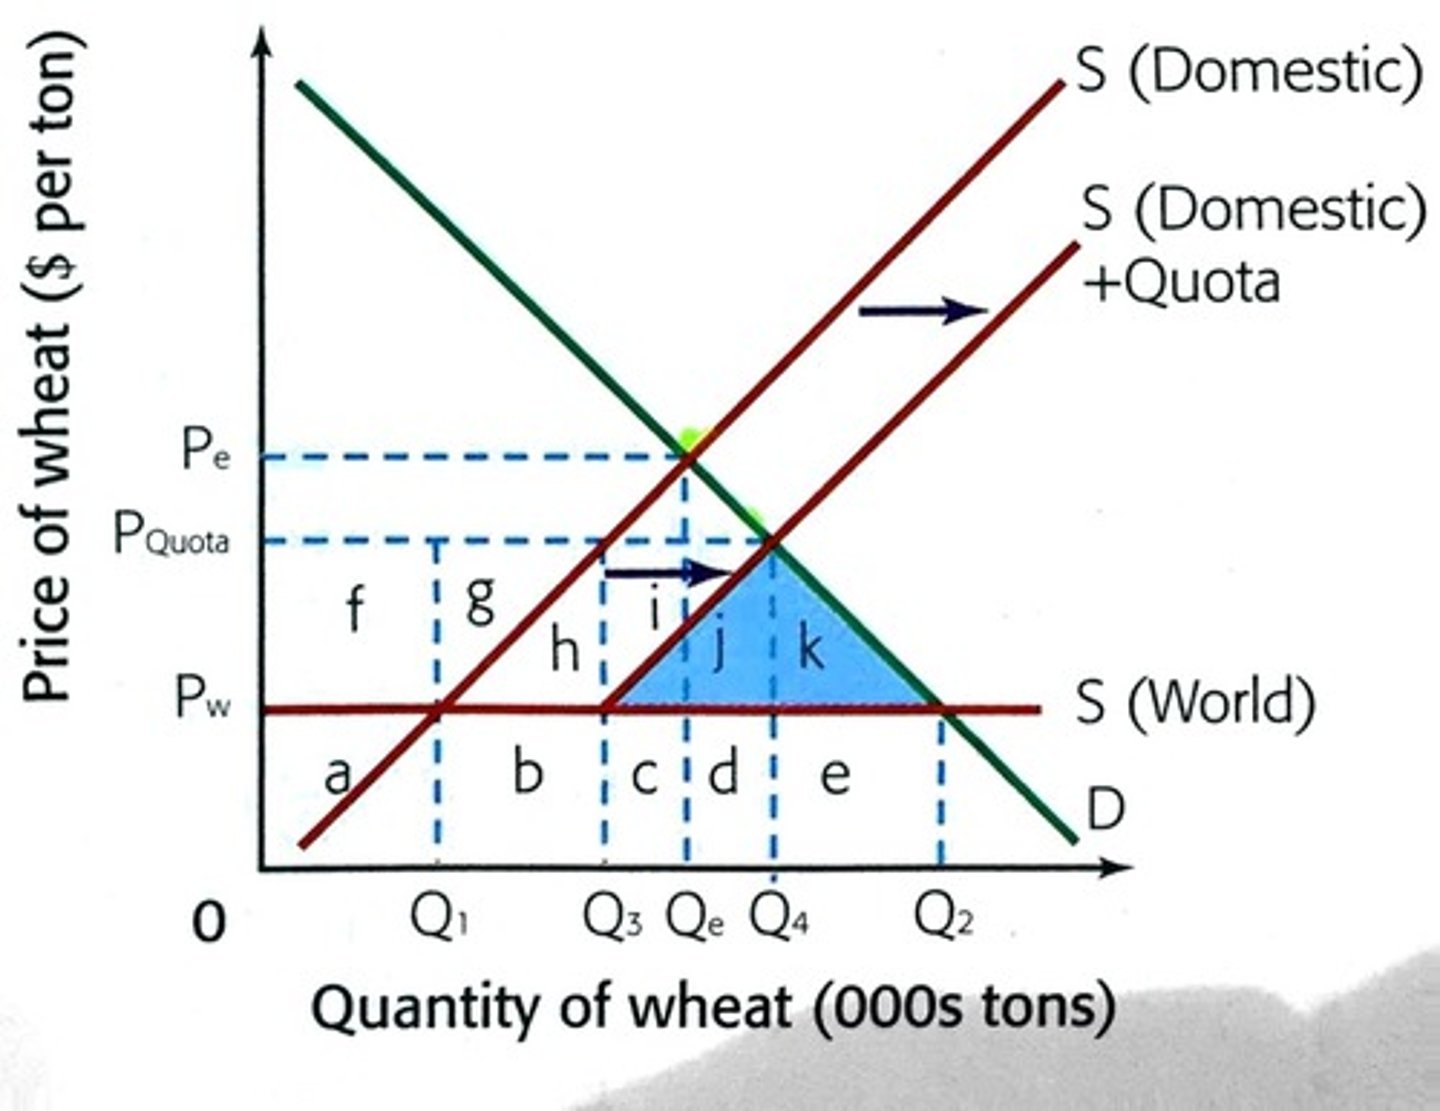
Quota impacts on stakeholders
- Domestic production: increases from 0Q1 to 0Q1 + Q3Q4
- Domestic producer revenue: increases from a to a+c+d+f+i+j
- Foreign production: decreases from Q1Q2 to Q1Q3
- Foreign producer revenue: decreases from b+c+d+e to b+g+h
- Price: increases from Pw to Pq
- Consumer surplus: -(f+g+h+i+j+k)
- Domestic producer surplus: f+g
- DWL: h+i+j+k
DWL from quota
- Area k: Q4Q2 tons of wheat are not now demanded. Consumers keep the amount 'e' that they would have spent on the wheat, but there is a loss of consumer surplus equivalent to k, because the good is not now purchased.
- Area j: The goods between Q1 and Q3 are now produced by inefficient domestic producers, instead of more efficient foreign producers. The foreign farmers would produce this quantity for a minimum revenue of c+d, whereas the domestic producers need minimum revenue of c+d+j. Thus j represents the inefficiency of the domestic producers and a misallocation of the world's resources, since more of the world's resources are being used to produce the good than are necessary
4.3 Arguments for and against trade control/protection
Free trade
International trade that is not subject any kind of trade barriers
Trade protection
Government intervention aiming to limit imports and/or encourage exports by setting up trade barriers that protect from foreign competition.
Arguments for trade protection/advantages of trade protection
- Protection of infant (sunrise) industries
- National security
- Health and safety
- Environmental standards
- Anti-dumping
- Unfair competition
- Balance of payments correction
- Government revenue
- Protection of jobs
- Economically least developed country (ELDC) diversification
https://docs.google.com/document/d/1MOLnKq5_apFJEDQthwvhUW3c6mcXhgytFn9_qkMRD0Y/edit
Arguments against trade protection/disadvantages of trade protection
Similar to those of free trade:
- Misallocation of resources
- Retaliation
- Increased costs
- Higher prices
- Less choice
- Domestic firms lack incentive to become more efficient
- Reduced export competitiveness
4.4 Economic integration
What is economic integration?
Economic interdependence between countries usually involving agreements between two or more countries to eliminate trade and other barriers between them.
Preferential trade agreement
Where a country agrees to give preferential access (for example, reduced tariffs) for certain products to one or more trading partners.
Types of preferential trade agreements
- Bilateral: relating to trade between two countries
- Regional: between two or more countries that are geographically close
- Multilateral (the World Trade Organization): relating to trade between two or more countries
Trading bloc
A group of countries that have agreed to reduce protectionist measures like tariffs and quotas between them.
Types of trading blocs
- Free trade areas/agreements
- Customs unions
- Common markets
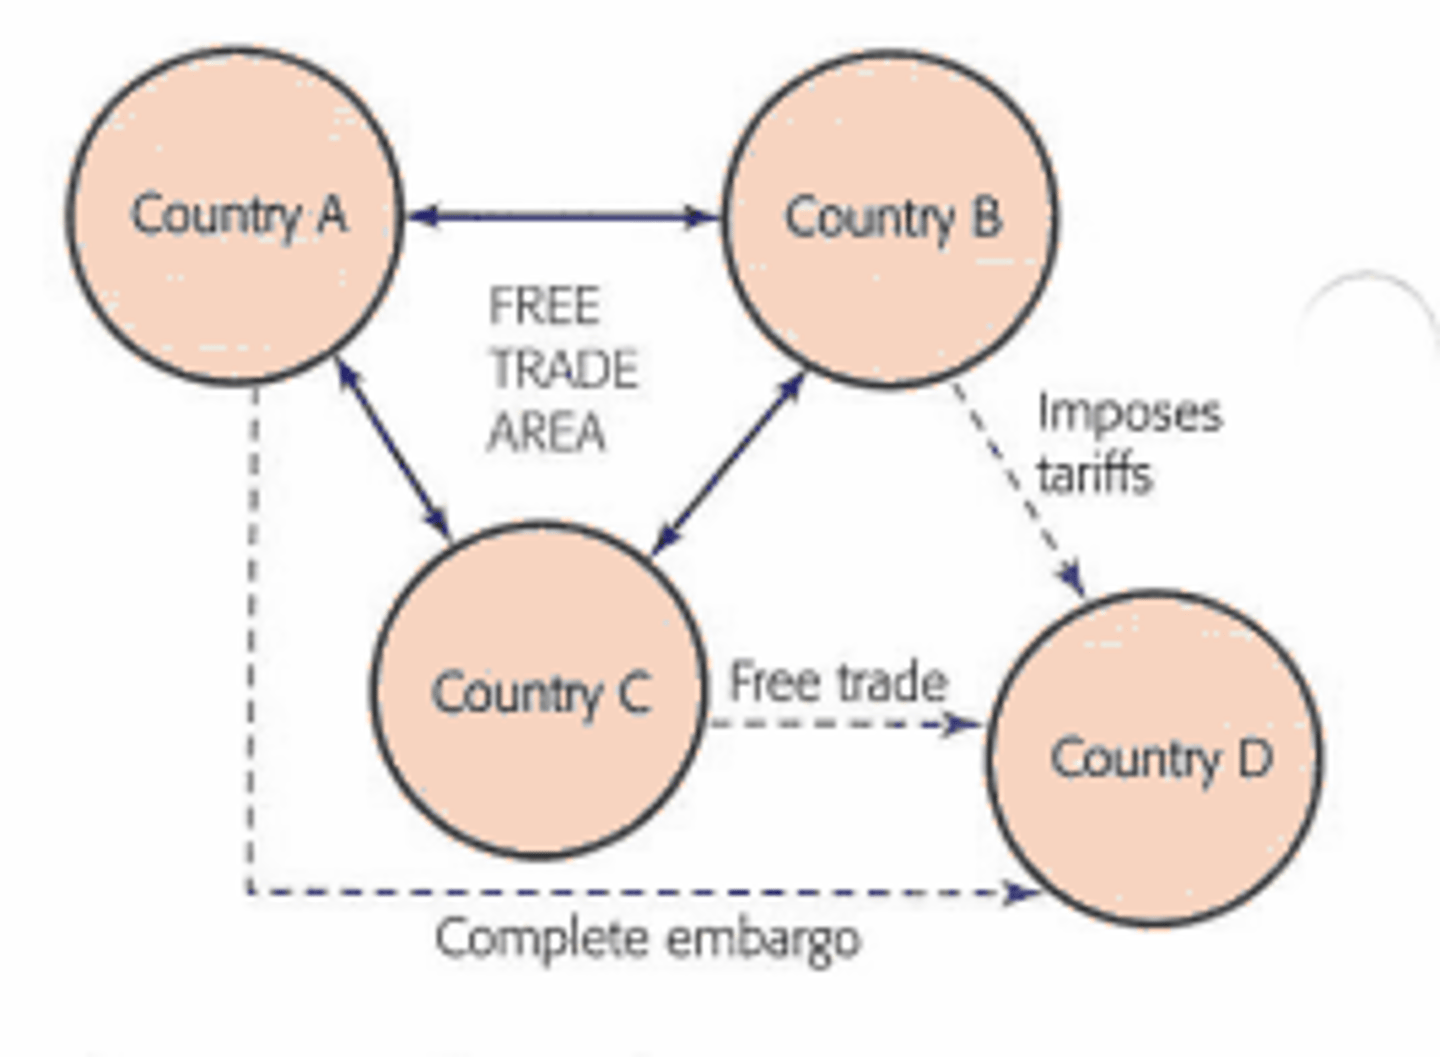
Free trade area/agreement
An agreement between two or more countries to eliminate trade barriers between them where members of the agreement are free to maintain their own trade policy towards non-members.
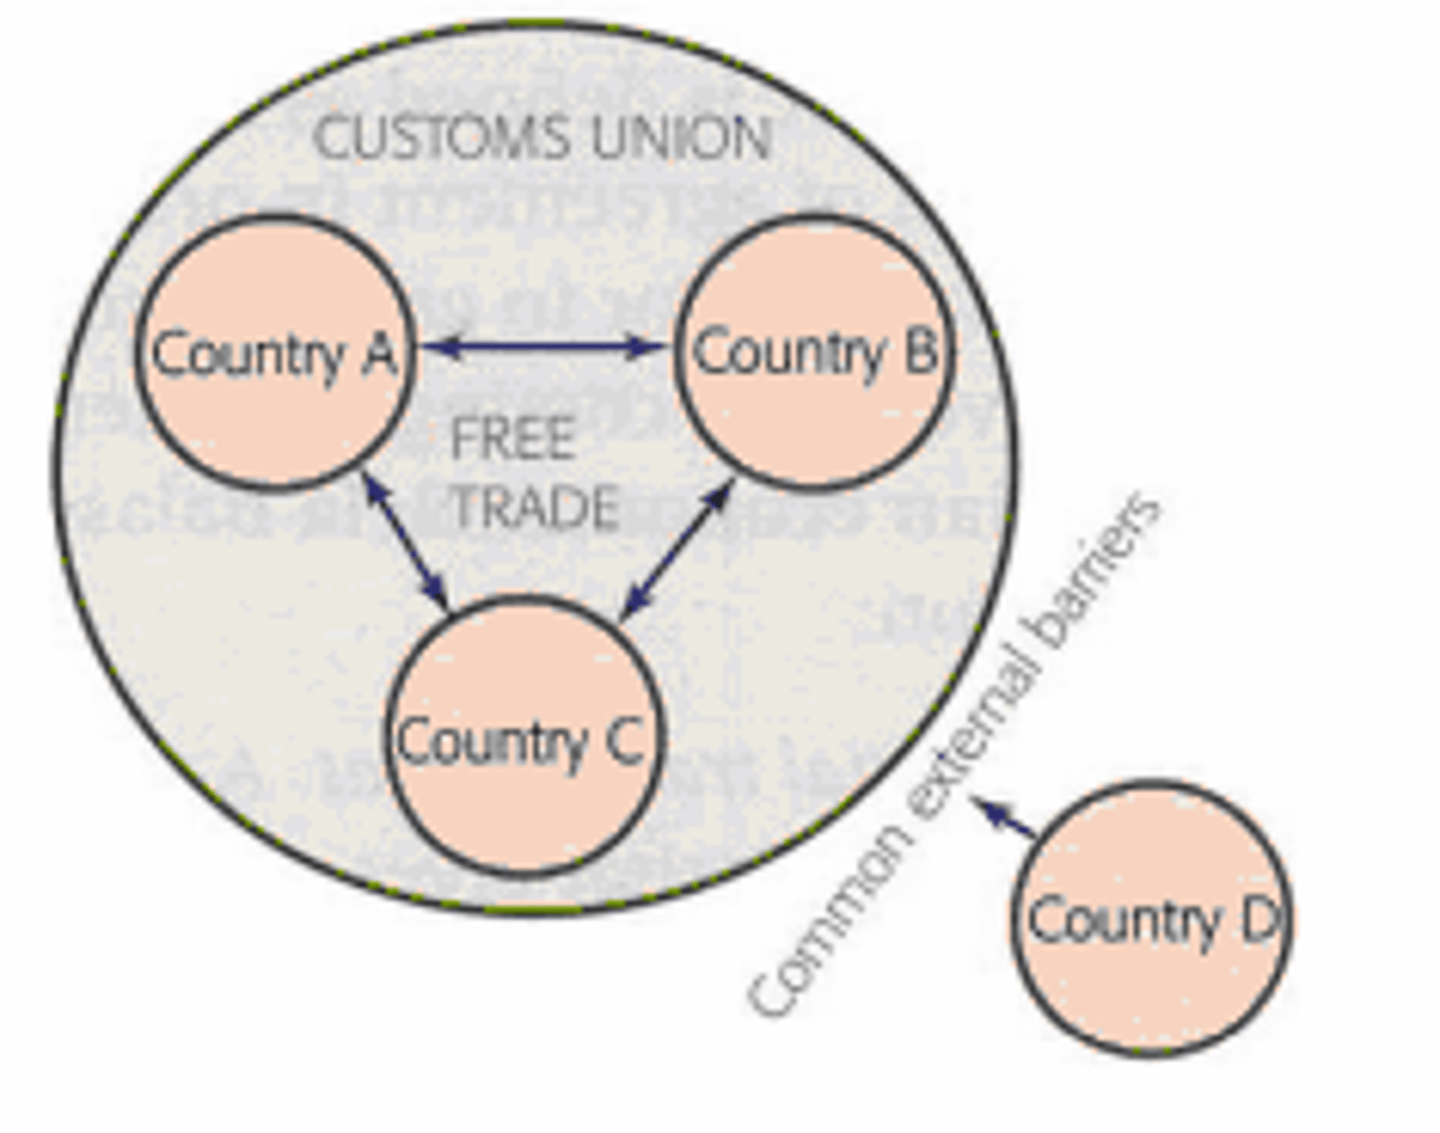
Customs union
An agreement between countries to eliminate trade barriers and establish a common external barrier toward non-members.
Common market
A customs union with common policies on product regulation, and free movement of goods, services, capital, and labour.
Advantages of trading blocs
Similar to those of free trade:
- Greater access to markets offer potential for economies
of scale
- With freedom of labour, there are greater employment
opportunities
- Membership in a trading bloc may allow for stronger
bargaining power in multilateral negotiations
- Greater political stability and cooperation
Disadvantages of trading blocs
- Loss of sovereignty
- Challenge to multilateral trading negotiations
Monetary union
A common market with a common currency and a common central bank.
World Trade Organization (WTO)
An international organization that sets the rules for global trading and resolves disputes between its member countries.
Aims of the WTO
The WTO aims to increase international trade by lowering trade barriers and providing a forum for negotiation.
Functions of the WTO
- Administer WTO trade agreements
- Be a forum for trade negotiations
- Handle trade disputes among member countries
- Monitor national trade policies
- Provide technical assistance and training for developing countries
- Cooperate with other international organizations.
Which factors affect the influence of the WTO?
- Difficulties of reaching agreement on services/primary products
- Unequal bargaining power of members
4.5 Exchange rates
Exchange rate
The value of one currency expressed in term of another currency; for example, €1 = US$1.5.
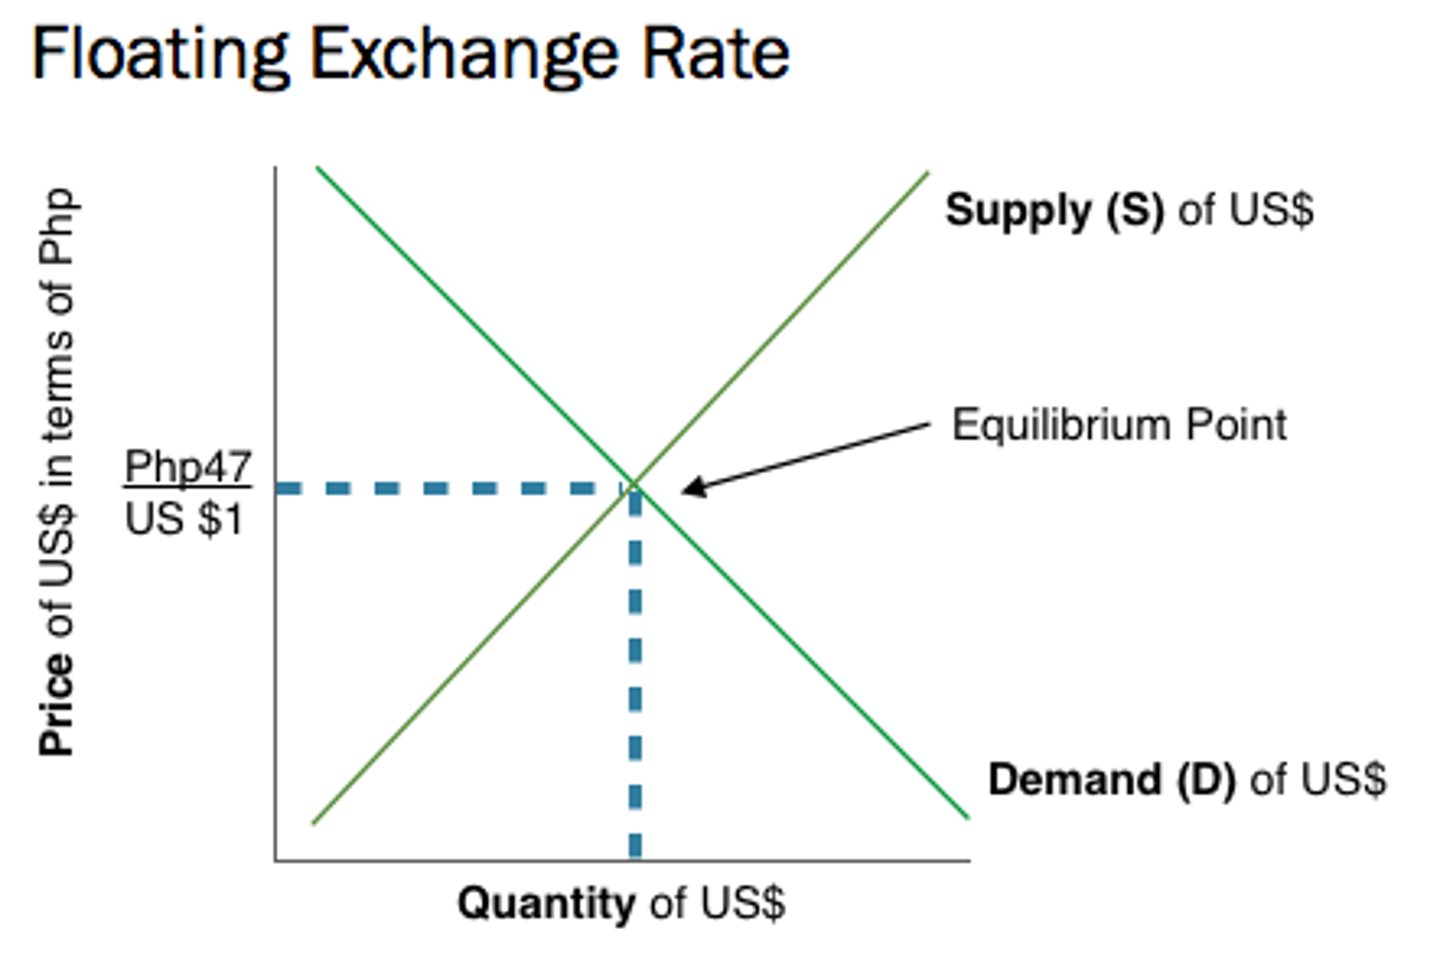
Floating exchange rate
An exchange rate system where the exchange rate is determined solely by the market demand and supply of the currency in the foreign exchange market (without any central bank intervention)
Depreciation
A decrease in the value of a currency in terms of another currency in a floating or managed exchange rate system.
Appreciation
An increase in the value of a currency in terms of another currency in a floating or managed exchange rate system.
Diagram to show the exchange rate determination in a floating exchange rate system
Note: the quantity of currency in the x-axis is not the total quantity of currency in existence. Instead, think of the x-axis as the amount of currency brought to the foreign exchange (Forex) market on a daily basis.
Calculation: using exchange rates, the price of a good in different currencies
Factors that change demand and supply for a currency
- Foreign demand for exports
- Domestic demand for imports
- Inward/outward foreign direct investment
- Inward/outward portfolio investment
- Remittances
- Speculation
- Relative inflation rates
- Relative interest rates
- Relative growth rates
- Central bank intervention
Consequences of changes in the exchange rate on the inflation rate
Consequences of changes in the exchange rate on economic growth
Consequences of changes in the exchange rate on unemployment
Consequences of changes in the exchange rate on the current account balance
Consequences of changes in the exchange rate on living standards
Diagram: AD/AS curves to show potential consequences of changes in
the exchange rate on the economy
Fixed exchange rate
Devaluation
Revaluation
How are fixed exchange rates maintained?
Diagram: showing how a fixed exchange rate is maintained
Managed exchange rates
Overvalued currencies
Undervalued currencies
Diagram: showing the exchange rate determination and changes in equilibrium in a managed exchange rate system
4.6 Balance of payments
Balance of payments
A record of the value of all transactions of a country with the rest of the world over a period of time.
Credit items
Payments received from other countries (lead to an inflow of currency); these transactions enter the account with a plus sign.
Debit items
Payments made to other countries (lead to an outflow
of currency; these transactions enter the account with a minus sign.
Components of the balance of payments
- Current account
- Capital account
- Financial account
Surplus or deficit on an account
Current account components
- Balance of trade in goods = revenue from export of goods - expenditure on imports of goods
- Balance of trade in services = revenue from export of services - expenditure on imports of services
- Income: net monetary movement of profit, interest and dividends moving into and out of the country
- Current transfers: payments made between countries in exchange for no goods or services
Capital account components
- Capital transfers: financial or non-financial assets for items including debt forgiveness, investment, non-life insurance claims.
- Transaction in non-produced, non-financial assets: like land or right to natural resource, purchase of intangible assets (e.g. patents or copyrights), net international sales
Financial account components
- Foreign direct investment (FDI): When a firm acquires
interest (at least 10% of the ordinary shares) in an existing foreign firm
- Portfolio investment: stock and bond purchases
- Reserve assets: reserves of gold and foreign currencies which all countries hold
- Official borrowing: international borrowing by a government
Interdependence between the accounts
- Zero balance in the balance of payments: when all accounts are added up they equal 0
- Credits matched by debits
- Deficits matched by surpluses
- Current account balanced by capital account and financial account
4.7 Sustainable development
Sustainable development
Development that meets the needs of the present without compromising the ability of future generations to meet their own needs
Sustainable Development Goals (SDGs)
17 global goals set by the United Nations including those
that aim to end all forms of poverty, fight inequalities and tackle climate change.
4.8 Measuring development
Define economic development
A sustained increase in living standards that implies higher levels of income and thus greater access to goods and services, better education and health, a better environment to live in as well as individual empowerment.
The multidimensional nature of economic development
Single indicators of development
- GDP/GNI per person (per capita) at PPP
- Health and education indicators literacy: life expectancy, mortality rates, years in school, literacy
- Economic/social inequality indicators: income, gender
- Energy indicators
- Environmental indicators
Evaluation (pros/cons) of single indicators of development
Pros:
- Measures a specific variable in detail
- Can help identify areas in need of intervention
- Can help to assess the effectiveness of an intervention
- Enables comparisons over time
Cons:
- Development is a multidimensional concept, so single indicators are not that useful on their own
- Averages can hide wide variations across a country
- Not always accurate data (governments lack the means to collect it)
- Hidden data (developing economies are often largely informal)
Composite indicators of development
- Human Development Index (HDI)
- Gender Inequality Index (GII)
- Inequality adjusted Human Development Index (IHDI)
- Happy Planet Index
Human Development Index (HDI)
Reflects the three basic goals of development through three measured variables:
1. Long and healthy life - life expectancy at birth
2. Improved education - mean years of schooling & expected years of schooling
3. Decent standard of living - GNI per capita (PPP US$)
Inequality adjusted Human Development Index (IHDI)
Modification of the HDI to account for inequality within a country
Gender Inequality Index (GII)
Measures gender inequalities in three dimensions of human
development:
1. Reproductive health
2. Empowerment
3. Economic status
Happy Planet Index (HPI)
Combines four elements to show how efficiently residents of countries use environmental resources to lead
long, happy lives:
1. Well-being
2. Life expectancy
3. Inequality of outcomes
4. Ecological footprint
Evaluation (pros/cons) of composite indicators of development (HDI)
Pros:
- More holistic indicator than single measures (more information)
- Useful as a policy making tool in development
- Accounts for more than income
- Allows differences between GNI and other indicators to be seen (compare GNI and HDI rankings)
Cons:
- Still a narrow measure of the idea of development (lacks many key factors)
- Not a useful tool to compare highly developed countries, where life expectancy, education and a reasonable GNI per capita is expected
- Human rights and environmental issues are excluded
Possible relationship between economic growth and economic development
4.9 Barriers to economic growth and/or economic development
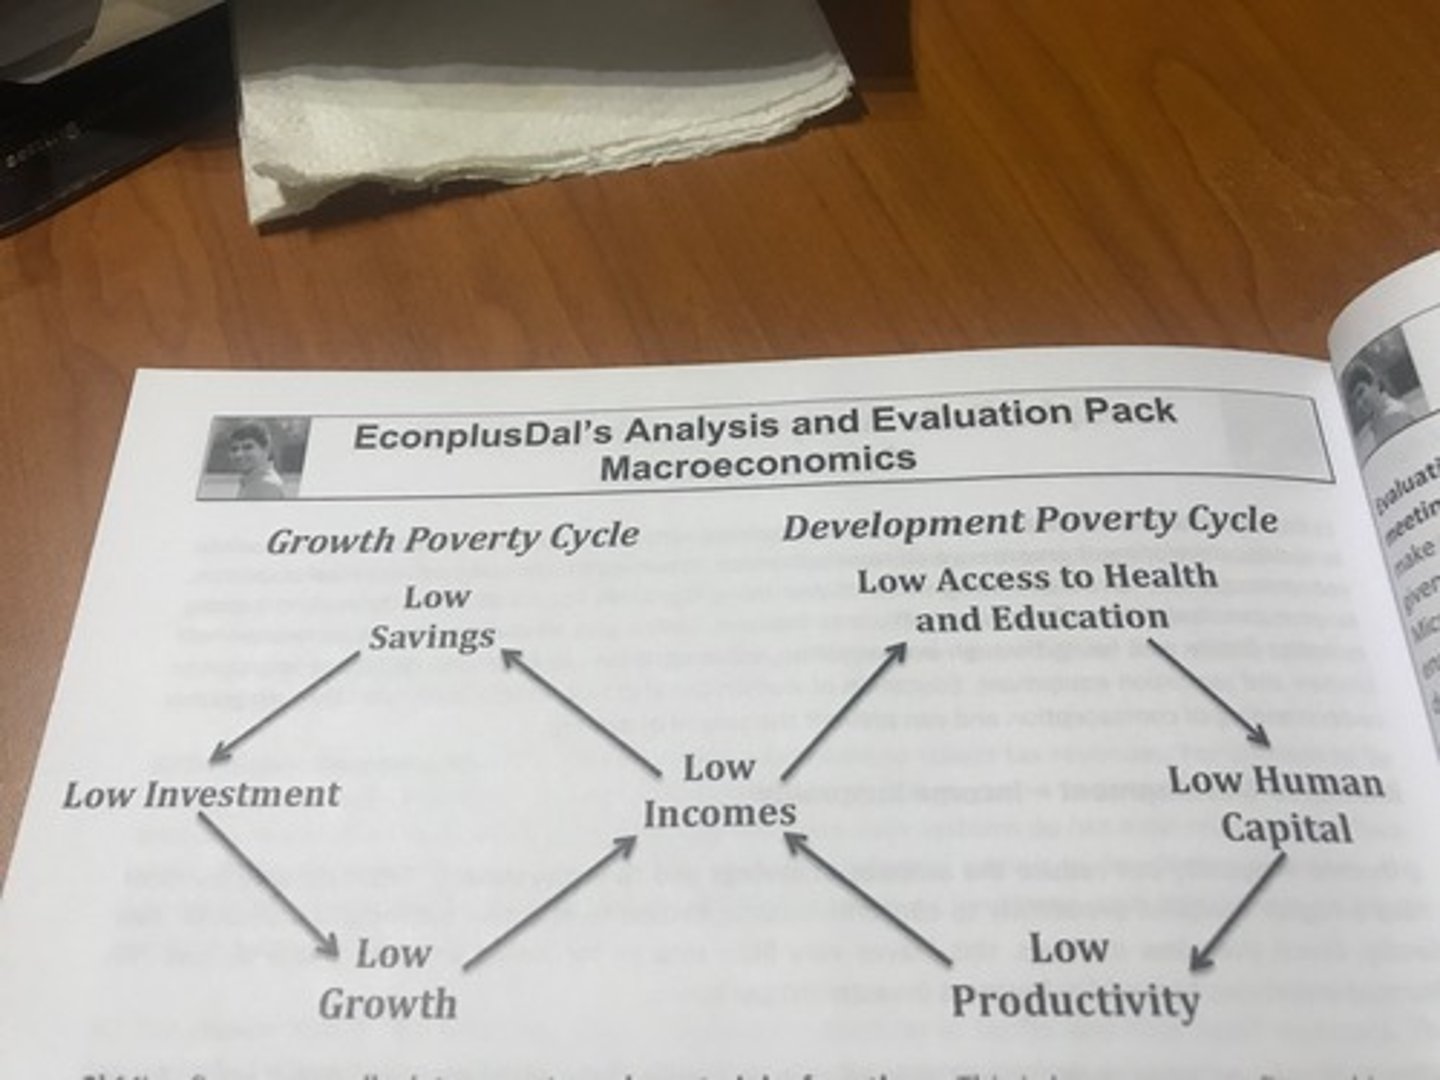
Poverty traps/poverty cycles
Any circular chain of events starting and ending in poverty
Draw a poverty cycle diagram
Low income leads to low savings, leads to low investment, leads to low growth, leads to low income.
Barriers to economic growth and/or economic development
- Rising economic inequality
- Lack of access to infrastructure and appropriate
technology
- Low levels of human capital—lack of access to healthcare
and education
- Dependence on primary sector production
- Lack of access to international markets
- Informal economy
- Capital flight
- Indebtedness
- Geography including landlocked countries
- Tropical climates and endemic diseases
Impact of geography on economic growth and development
Landlocked countries have less access to international markets and have higher costs of transportation (cheaper to transport goods over water than over land), which is why they tend to be poorer
Impact of tropical climates on economic growth and development
- Tropics are worse for human diseases
- Tropics are worse for diseases in crops and animals
- Same amount of human/physical capital produces less agriculture in these regions
- Humans are less productive in warmer climates
- Frost can protect crops from pests and diseases (increased yields)
- Main calorie crops (wheat, corn, rice) grow better in northern climates
Impact of access to healthcare on economic growth and development
- Healthy people are more productive and absent less
- Healthy people do not transmit disease
- Healthy people participate more actively in communities
- Healthy people live longer so contribute more to economy, save more, make more use of their education and skills
- Increased school attendance and performance