Class 20 (Unit 8)
1/7
There's no tags or description
Looks like no tags are added yet.
Name | Mastery | Learn | Test | Matching | Spaced |
|---|
No study sessions yet.
8 Terms
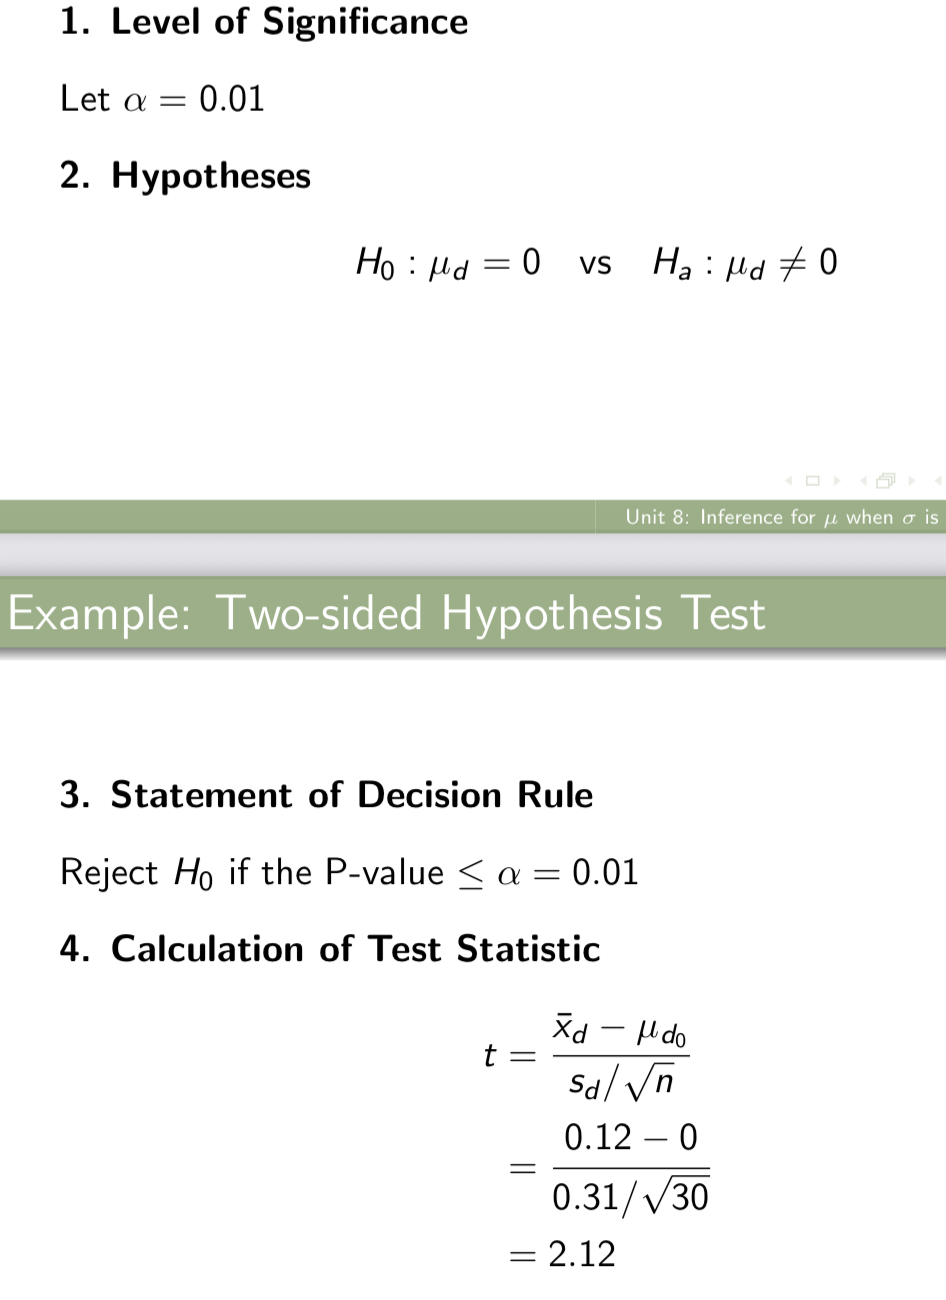
Example: Many psychology studies have examined the di!erences between the first and second children in a family. Suppose we would like to compare their academic performance. We examine the high school GPAs of a sample of 30 pairs of siblings and calculate the difference in GPAs, d = first child - second child. We calculate an average difference of ¯ xd = 0.12 and a standard deviation of sd = 0.31. Assume that differences follow a normal distribution .
Calculate a 99% confidence interval for the true mean difference in GPAs.
Conduct a hypothesis test to determine whether there is evidence of a difference in the average high school academic performance between the first and second children in a family. Use α = 0.01.
example of confidence interval
Calculate a 99% confidence interval for the true mean difference in GPAs.
Solution: We know
¯xd = 0.12, sd = 0.31, n = 30, t* = 2.756
Here, t* is the critical value from the t distribution with 29 d.f. for C = 99%
Confidence interval interpretation
confidence interval interpretation (99% confidence interval for the true mean difference in GPAs.)
“If we took repeated samples of 30 pairs of siblings and calculated the interval in a similar manner, 99% of such intervals would contain the true mean di!erence in high school GPAs for the first and second children in a family.”
Notice that for any pair of siblings, high school GPAs are dependent
Two - sided hypothesis test
Conduct a hypothesis test to determine whether there is evidence of a difference in the average high school academic performance between the first and second children in a family. Useε = 0.01.
5. Calculation of P-value
The P-value is 2P(T (29) ≥ 2.12). We see from Table 2 that
P(T (29) ≥ 2.045) = 0.025 and P(T (29) ≥ 2.150) = 0.02
Since 2.045 < t = 2.12 < 2.150, we know P(T (29) ≥ 2.12) is between 0.02 and 0.025.
Since the P-value is 2P(T (29) ≥ 2.12), it follows that the P-value is between 2(0.02) = 0.04 and 2(0.025) = 0.05.
P-value interpretation
Conclusion
Note
Also note
P-value interpretation (Two - sided hypothesis test - high school academic performance between the first and second children in a family.)
If there was no difference in average high school academic performance for first and second children, the probability of observing a sample mean difference at least as extreme as 0.12 is between 0.04 and 0.05.”
Any value between 0.04 and 0.05 is greater than α = 0.01
Conclusion (Two - sided hypothesis test - high school academic performance between the first and second children in a family.)
Since the P -value > α = 0.01, we fail to reject the null hypothesis. At the 1% level of significance, we have insufficient evidence that there is a difference in average high school academic performance between the first and second children in a family.
Note (Two - sided hypothesis test - high school academic performance between the first and second children in a family.)
If we had defined the difference as d = second child - first child, the value of the test statistic would have been t = -2.12 and the P -value would have been 2P(T (29) ≤ -2.12)
This is the same as the P-value we calculated. So the conclusion would have been the same.
Also note (Two - sided hypothesis test - high school academic performance between the first and second children in a family.)
Since this was a two-sided test with a 1% level of significance, we could have used the 99% confidence interval to conduct the test
We calculated previously that the 99% confidence interval for µd is (-0.036, 0.276)
Since µd0 = 0 is contained in the 99% confidence interval for µd , we fail to reject H0 at the 1% level of significance.