unit 2
1/16
Earn XP
Name | Mastery | Learn | Test | Matching | Spaced | Call with Kai |
|---|
No analytics yet
Send a link to your students to track their progress
17 Terms
Type I survivorship curve
organisms live longer than middle ages
less offspring
lots of parental care
K- selected species
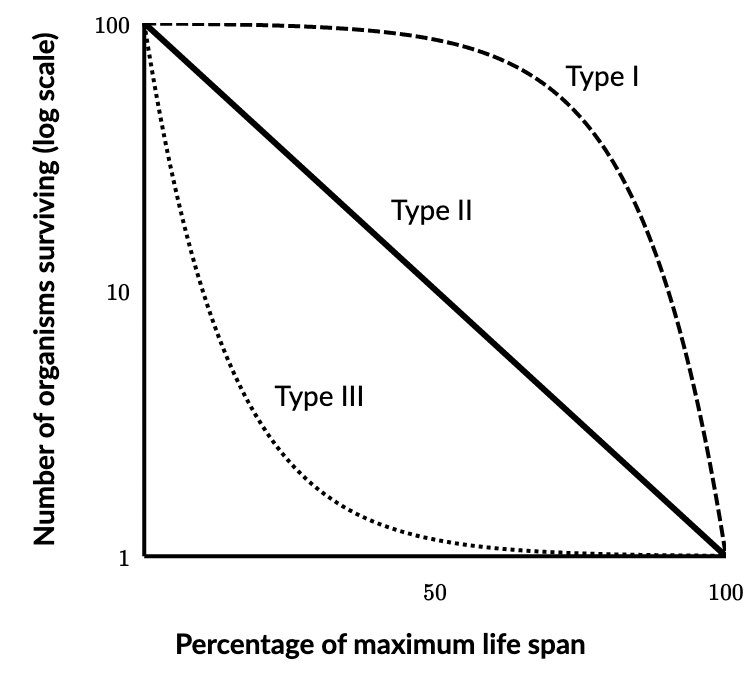
type II survivorship curve
constant proportion of individuals dying at each age interval
few offspring
lots of parental care
K-selected species

type III survivorship curve
high death rate
low death rate for older organisms
lots of offspring
no parental care
r- selected species

k- selected species
longer life span
fewer offspring
lots of parental care
r-selected species
survive in low competition
shorter life spans
many offspring
exponential population growth
population per capita growth rate stays the same regardless of population size
grows faster as it gets larger
not limited by food, space, environmental stuff
logistic population growth
population reaches carrying capacity (k)
limited by environmental factors
density dependent
competition for resources
predation
disease
waste accumulation
affect because of density
density independent
natural disasters
affect regardless of density
population overshoot
population exceeding carrying capacity
species depletes resources and decreases
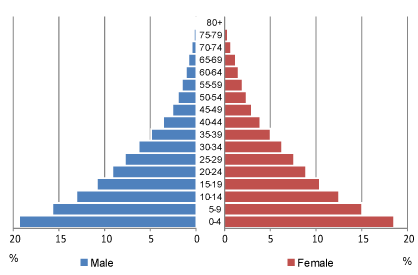
age structure diagram: rapid growth
more young people
less old people
high birth and death rates
LEDC
age structure diagram: slow growth
more older people
less younger people
high birth rate
declining death rate
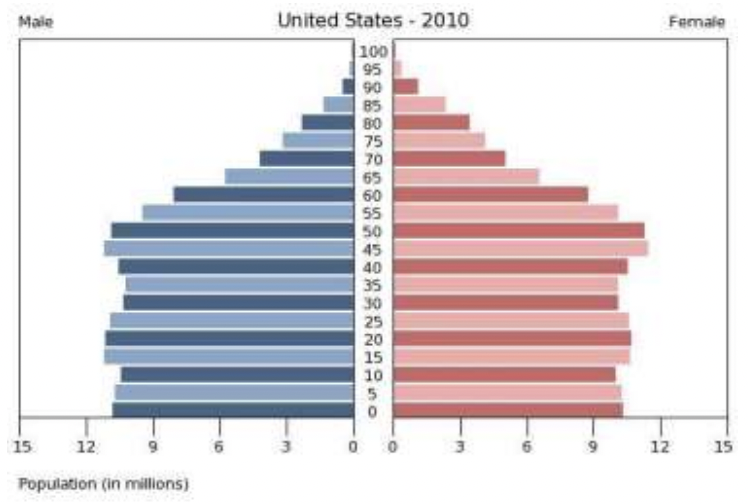
age structure diagram: stable
same proportion of younger, middle age, and older people
declining birth rate
low death rate
MEDC
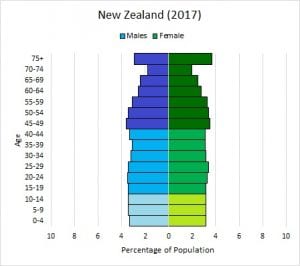
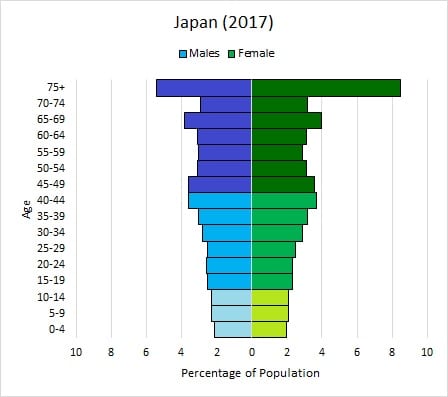
age structure diagram: declining
few young people
low birth rate
low death rate
MEDC
fecundity
ability to reproduce
total fertility rate (tfr)
average number of children born to a woman
replacement fertility rate
when level of fertility replaces itself from one generation to the next