Microecononmics Exam 3 26-29, 31
1/111
There's no tags or description
Looks like no tags are added yet.
Name | Mastery | Learn | Test | Matching | Spaced | Call with Kai |
|---|
No analytics yet
Send a link to your students to track their progress
112 Terms
Derived Demand
Demand that is the result of some other demand.
(For example, if the demand for a university education falls, so does the demand for university professors.)
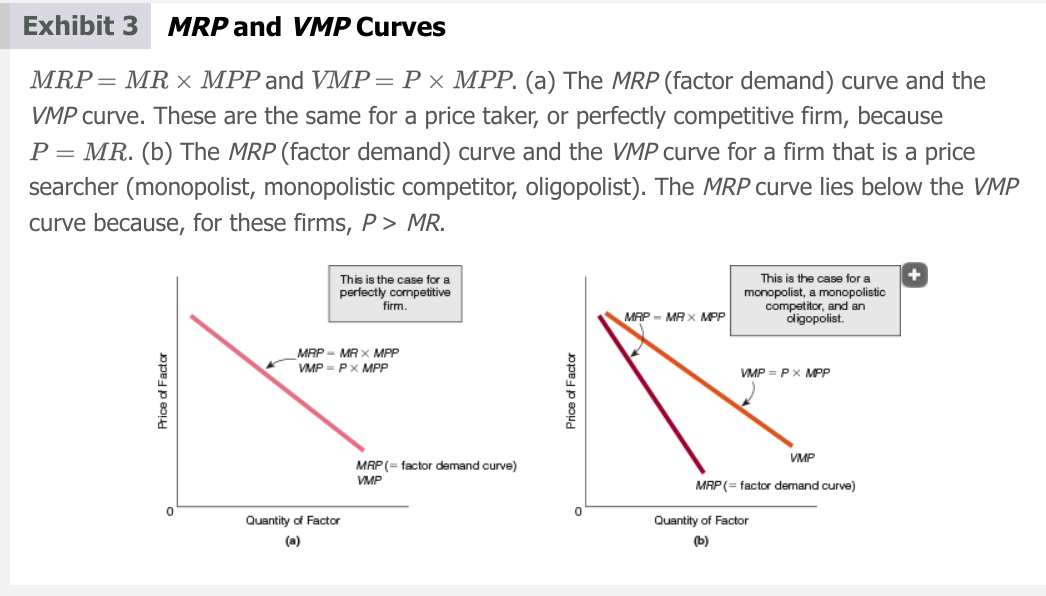
Marginal Revenue Product (MRP)
The additional revenue generated by employing an additional factor unit,
is the factor demand curve
(For example, if a firm employs one more unit of a factor and its total revenue rises by $20, the MRP of the factor equals $20)
MRP = ΔTR / ΔQ of the factor
MRP = MR x MPP

Value Marginal Product (VMP):
The price of a good multiplied by the marginal physical product of the factor. (The VMP of a factor is a dollar measure of how much an additional unit of the factor will do for you.)
VMP = P x MPP
For a perfectly competitive firm (price takers) MRP = VMP
For monopolistic competitors, oligopolists, and monopolists (price searchers) VMP > MRP
Factor Markets
Markets that have demand for and a supply of a factor, or resource, such as labor.
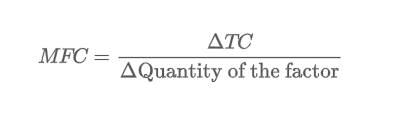
Marginal factor cost (MFC)
The additional cost incurred by employing an additional factor unit.
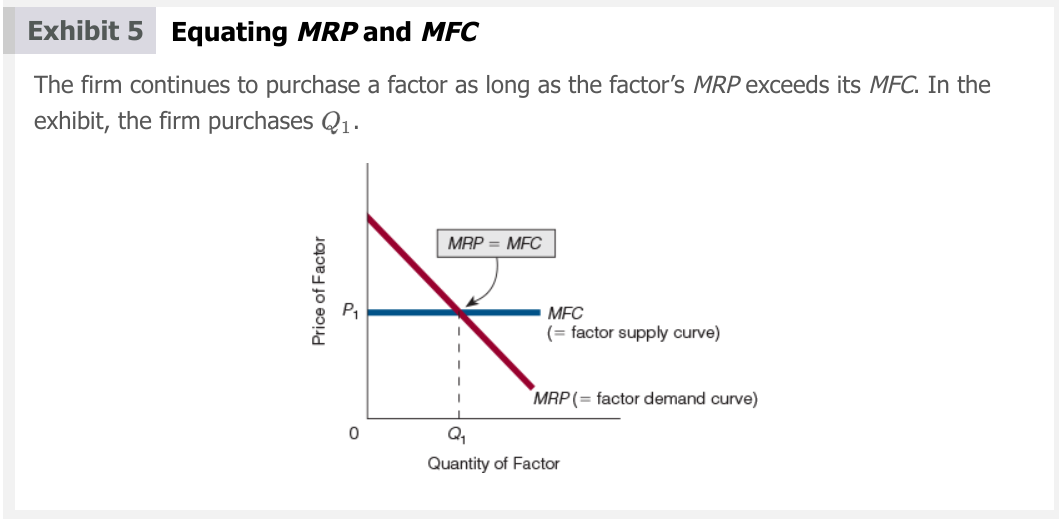
factor price taker
A firm that can buy all of a factor it wants at the equilibrium price. Such a firm faces a horizontal (flat, perfectly elastic) supply curve of factors.
Equating MFC and MRP?
Keep buying additional units of the factor until MRP =MFC.
(Same principles as MR =MC)
Least Cost rule
Rule that specifies the combination of factors that minimizes costs and so requires that the following condition be met: where the subscript numbers stand for the different factors.
Goal is MPPL/Pl = MPPK/PK
To achieve ratio:
MPPL/Pl < MPPK/PK: Labor decreases, Capital Increases
MPPL/Pl > MPPK/PK: Labor increases, Capital Decreases
(EXAMPLE
the price of labor is $5,
the price of capital is $10,
an extra unit of labor results in an increase in output of 25 units, and
an extra unit of capital results in an increase in output of 25 units.
Notice that MPPL/PL greater than MPPK/PK: 25/$5 > 25/$10. Thus, for this firm, $1 spent on labor is more effective at raising output than $1 spent on capital.)
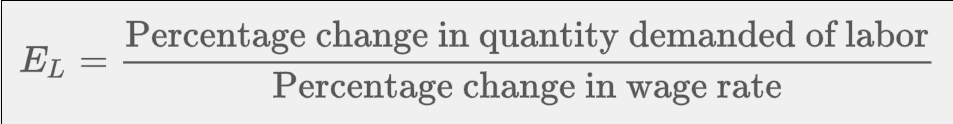
Elasticity of demand for labor
The percentage change in the quantity demanded of labor divided by the percentage change in the wage rate.
EL = %ΔQdL / %Δw
EL = Coefficient of Elasticity of Demand for Labor
3 main determinants of elasticity of demand for labor
The elasticity of demand for the product that labor produces
The ratio of labor costs to total costs
The number of substitute factors
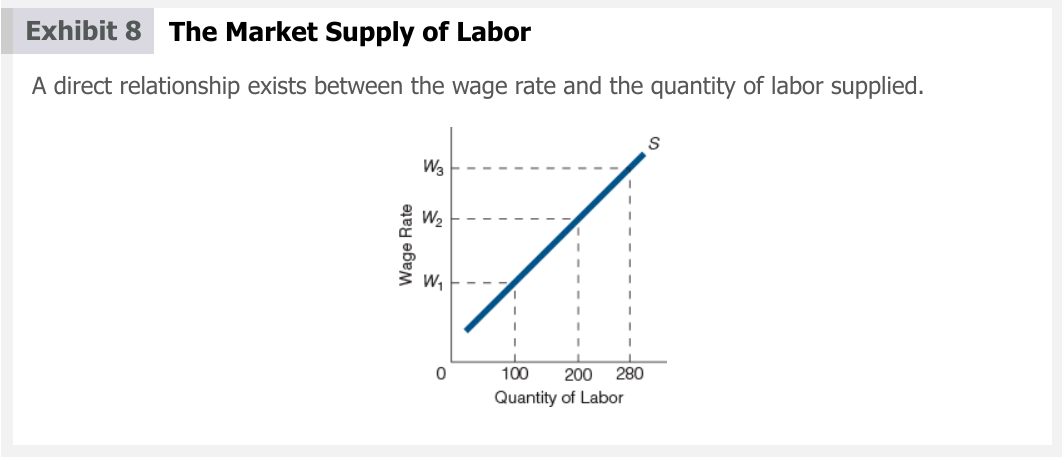
Market Supply of Labor
As the wage rate rises, the quantity supplied of labor rises
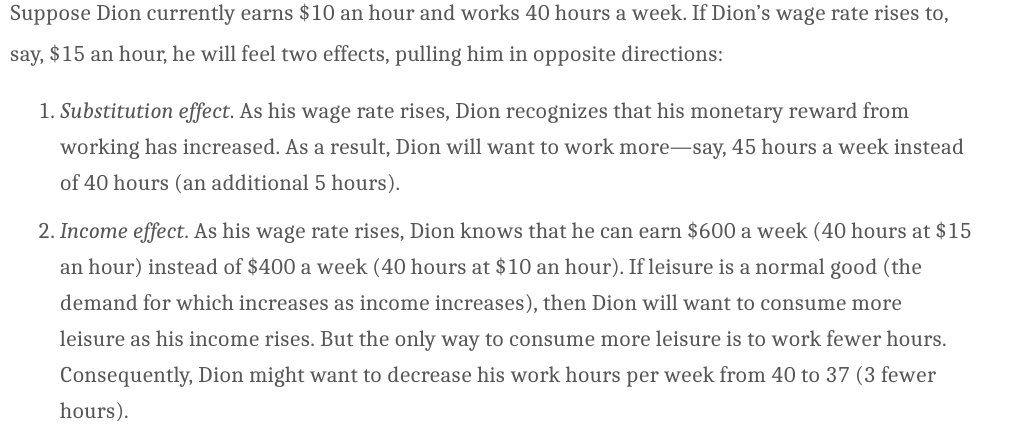
Effects of Individual Supply of labor
Substitution effect: Individual works more
Income effect: Individual works less
(To determine look at Net of both effects)
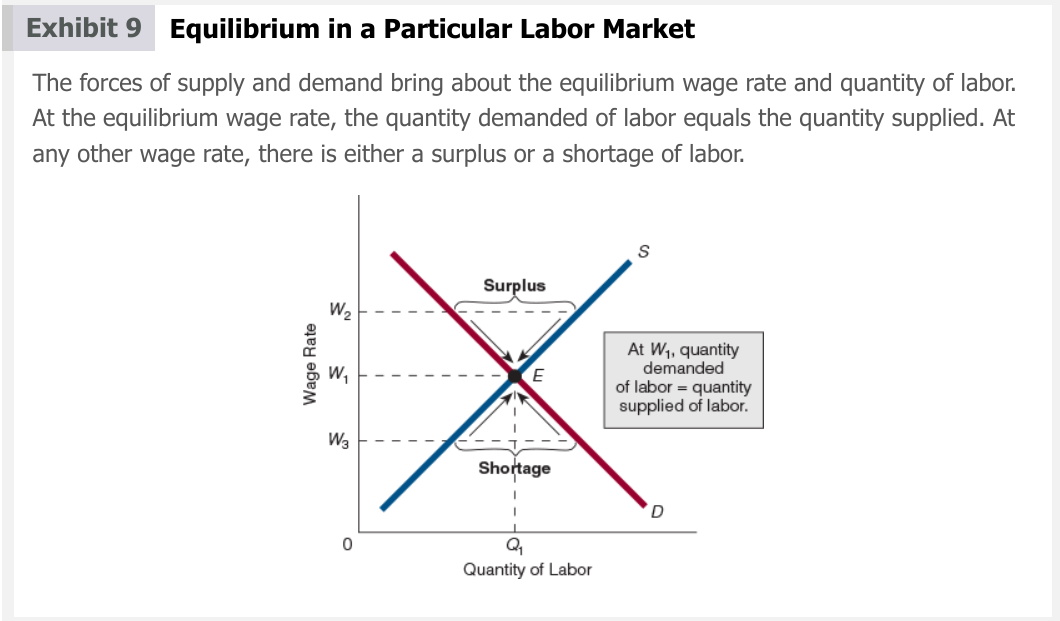
Supply and demand of Labor
Change in quantity supplied = a movement from one point to another point on the same supply curve that is caused by a change in the wage rate.
Change in supply = Shift in supply curve
Causes of change in supply:
Wage rates in other labor markets
Nonmoney aspects of a job (Example is unfavorable job aspects)
Conditions necessary for everyone to receive the same pay
The demand for every type of labor is the same.
The jobs have no special nonpecuniary aspects.
All labor is ultimately homogeneous, and laborers can be trained at no cost (costlessly) for different types of employment.
All labor is mobile at zero cost.
(wage rate begins to differ because demand conditions are not the same in all labor markets)

Factors affecting Difference in Supply and Demand
Wage rates differ as markets differ.
− Demand for labor: The MPP of labor is affected by individual workers
Own abilities and skills
Degree of effort they put forth on the job
Other factors of production
− Supply of labor
Jobs have different nonpecuniary qualities
Supply reflects the number of persons who can do a job
Marginal productivity theory
States that firms in competitive or perfect product and factor markets pay their factors their marginal revenue products or value marginal products
Screening
The process employers use to increase the probability of choosing good employees on the basis of certain criteria.
3 Objectives of labor unions decide between to achieve
to employ all their members,
to maximize the total wage bill, or
to maximize income for a limited number of union members.
Unit elastic is midpoint between maximizing wages and maximizing employment
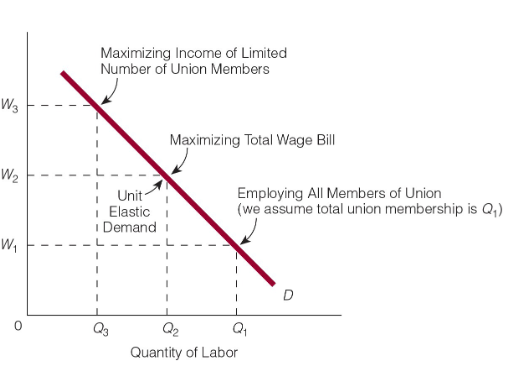
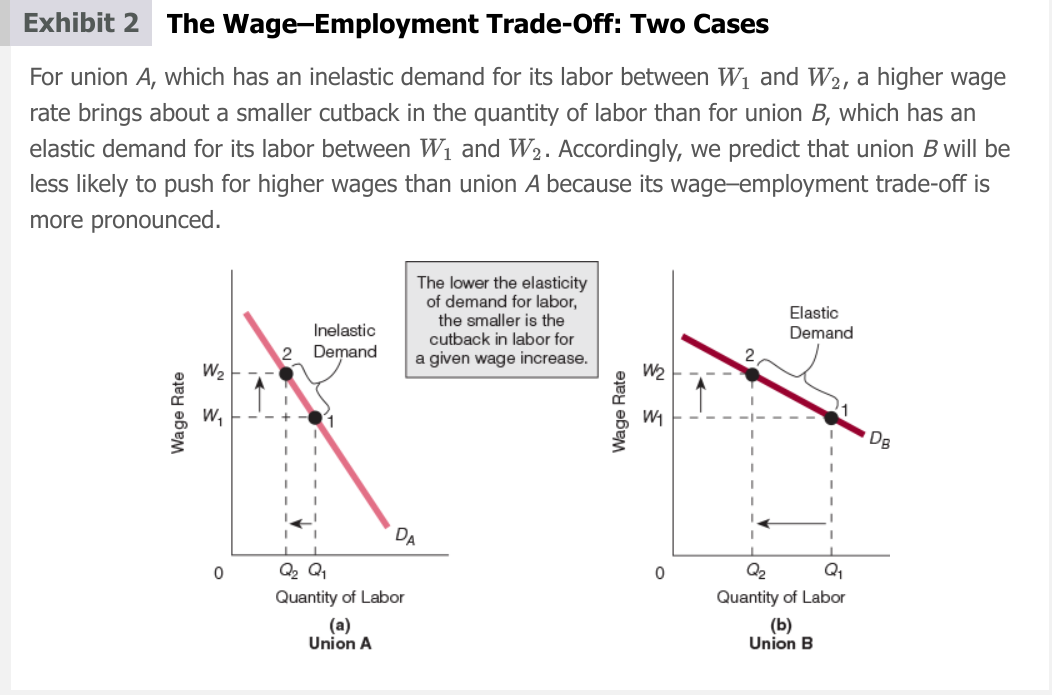
Wage employment trade off
suggests that a union can get higher wage rates, but some of the union members will lose their jobs in the process
more elasticity in demand for labor = large cutback in Qd of labor for rise in wage rate
smaller cutback in labor for wage increase is better for labor unions
Factors to determine how labor unions meet objectives
The elasticity of demand for labor
The demand for labor
The supply of labor
Elasticity of Demand for Union Labor
A labor union looks for ways to lower the elasticity of demand for its labor (Lower elasticity = losing less jobs when wages increase)
Lowers elasticity of demand by reducing availability of:
Substitute products
Substitute factors
Demand for Labor Unions
Higher demand for labor = higher wages and more employees
3 ways to increase demand
increasing product demand (urging customers to buy products made by unions)
increasing substitute factor prices (rise in the relative price of factors = rise in demand)
Increasing MPP (Marginal Physical Product) (increasing productivity of union members = Rise in demand) Su
Supply of labor in labor unions
low supply of labor = higher wage rates
2 ways to lower supply
Closed Shop
Union shop
Closed Shop
An organization in which an employee must belong to the union before he or she can be hired.
Union shop
An organization in which a worker is not required to be a member of the union in order to be hired but must become a member within a certain time after being employed.
Illegal in right-to-work states
Collective bargaining
The process whereby wage rates and other issues are determined by a union bargaining with management on behalf of all union members.
(Explaination of graph: We start at a wage rate of W1. The union’s objective is to increase the wage rate to W2. Such a wage rate means that the union holds that the new supply curve of labor is S’S—the heavy supply curve. To convince management that the new supply curve looks as the union says it does, the union will have to either threaten a strike or call one. We assume that the union is successful at raising the wage rate to W2. As a consequence, the quantity of labor employed is less than it would have been at W1.)
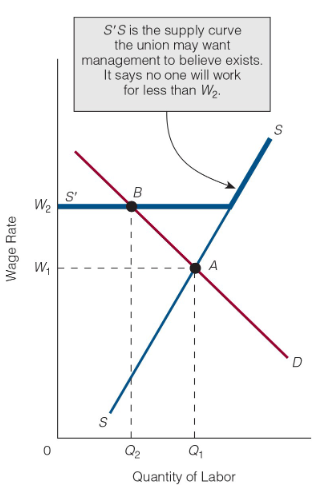
Strikes and their purpose
The union employees’ refusal to work at a certain wage or under certain conditions.
Purpose: Convince management that the union can control the supply of labor.
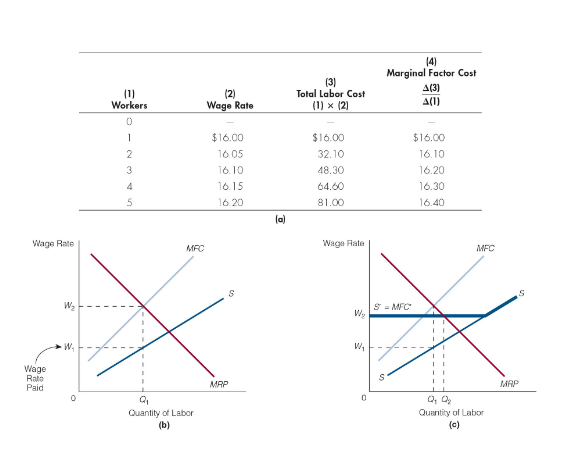
Monopsony
A single buyer in a factor market
A monopsony cannot buy additional units of a factor without increasing the price it pays for it.
Supply curve of the factor is not the same as the firm’s MFC curve.
MFC > Wage rate
(explanation of graph: For the monopsonist, MFC > wage rate. This relationship implies that the supply curve the monopsonist faces lies below its MFC curve. (b) The monopsonist purchases quantity of labor and pays a wage rate W1, which is less than MRP. (In other words, labor is being paid less than its MRP.) (c) If the labor union succeeds in increasing the wage rate from to through collective bargaining, then the firm will also hire more labor ( Q2 instead of Q1). We conclude that, in the case of monopsony, higher wage rates (over a given range) do not imply fewer persons working.
Union effects on Wages
Some unions greatly increase wages, some do not.
Union and non-union pay also can vary greatly depending on time and industry
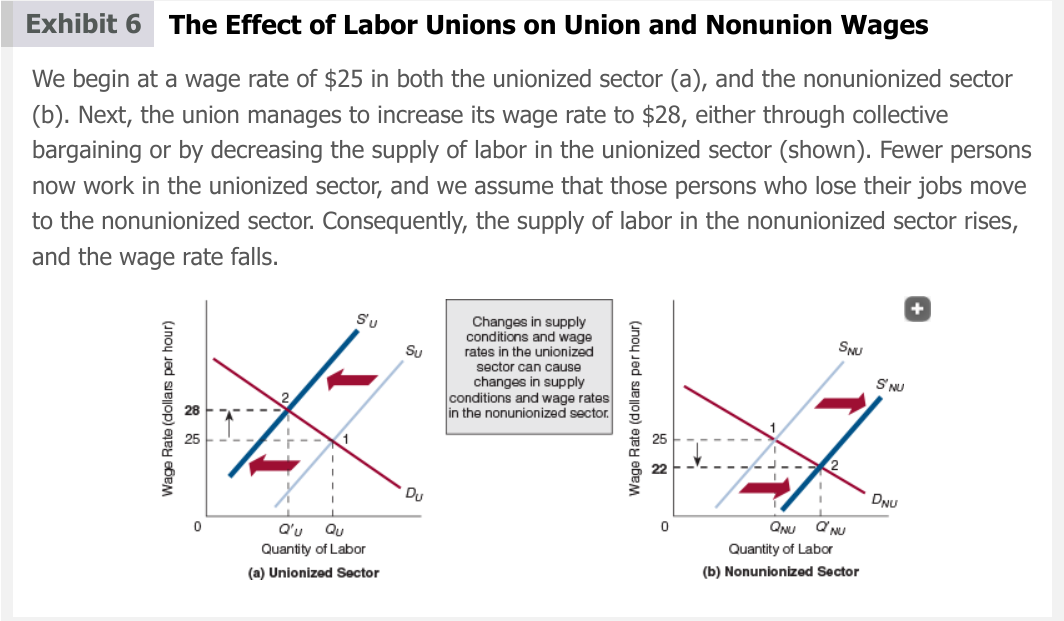
Union effects on prices
Union wages are relatively high and Nonunion wages are relatively low
Higher union wages mean higher costs for the firms that employ union labor.
Higher costs can affect supply curves, which in turn affect product prices.
Lower nonunion wages mean lower costs for firms that employ nonunion labor.
Lower prices for the products produced by nonunion labor.
Traditional/Orthodox view on productivity and efficiency of Labor unions
Labor unions often have unnecessary staffing requirements and insist that only certain persons be allowed to do certain jobs. Because of these considerations, the economy operates below its potential—that is, inefficiently.
Strikes disrupt production and prevent the economy from realizing its productive potential.
Labor unions drive an artificial wedge between the wages of comparable labor in the union and nonunion sectors of the labor market.
Collective Voice on productive and efficiency of Labor unions
Union firms have a higher rate of productivity than non-union firms
Workers feel more confident, less intimidated, and more secure.
workers are less likely to quit
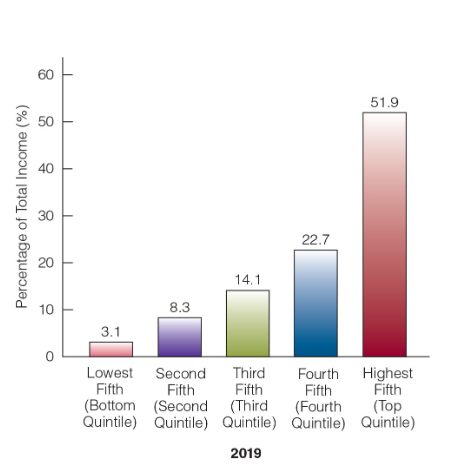
Quintiles
Lowest fifth of households considered poor
Top fifth is considered rich
Middle fifth are considered middle income
Quintiles count households, not persons, so they are unequal in size
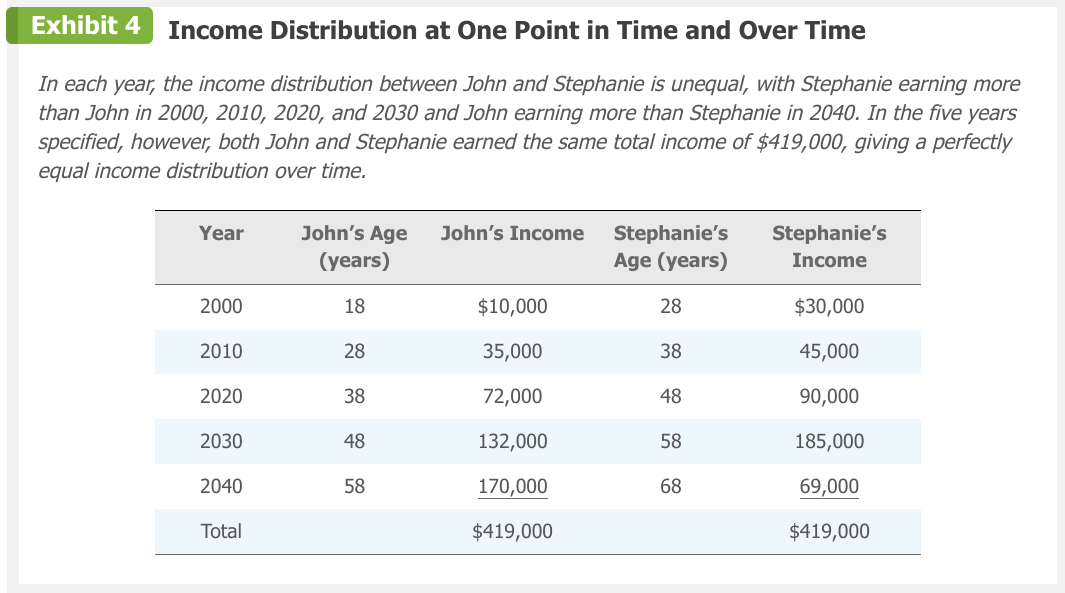
Effect of age on income distribution
Distinguish between People who are poor for long periods and people who are poor temporarily
Effect of age in the income distribution
In the U.S., people experience upward income mobility over time. (EX. College students start with part time jobs and are in lowest quintile, but later get better jobs with time and experience and move up into higher quintiles)
Transfer Payments
Payments to persons that are not made in return for goods and services currently supplied.
Equation of individual income =
labor income + asset income + transfer payments – taxes
(answers why income inequality exists, each part of the equation is different for everyone)
(Extra Info, only necessary for understanding) →
Labor income is equal to the wage rate an individual receives, multiplied by the number of hours worked.
Asset income consists of such things as the return to saving, the return to capital investment, and the return to land.
Transfer payments are payments to persons that are not made in return for goods and services currently supplied (e.g., Social Security payments and cash welfare assistance are government transfer payments).
Finally, from the sum of labor income, asset income, and transfer payments, we subtract taxes to see what an individual is left with (i.e., individual income).
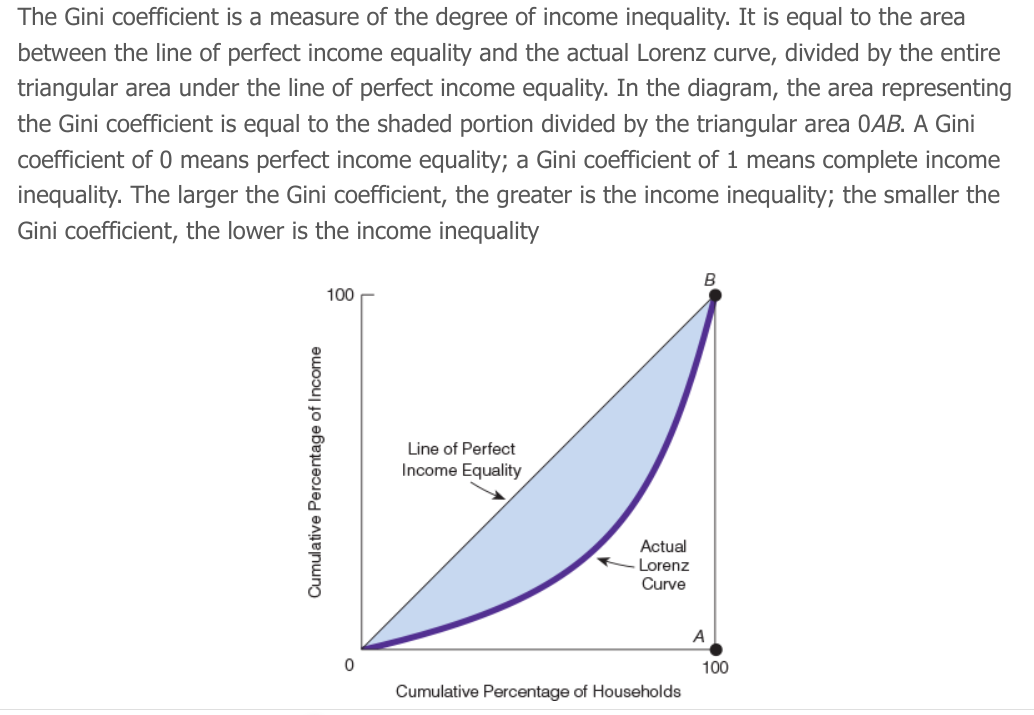
Lorenz curve
A graph of the income distribution that expresses the relationship between the cumulative percentage of households and the cumulative percentage of income.
The more bowed the Lorenz curve, the more unequal is the distribution of income.
Perfect income equality is the 45° line

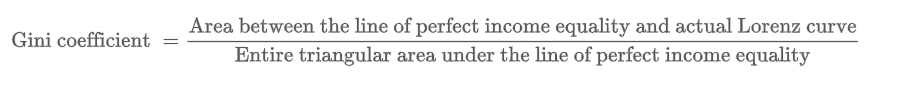
Gini Coefficent
A measure of the degree of inequality in the income distribution.
Area between line of perfect income equality and actual Lorenz curve divided by entire triangular area under the line of perfect income equality.
Number between 0 and 1
Closer to 0 = closer to perfect income equality
Closer to 1 = further from perfect income equality
Formula to calculate Gini Coefficent
→
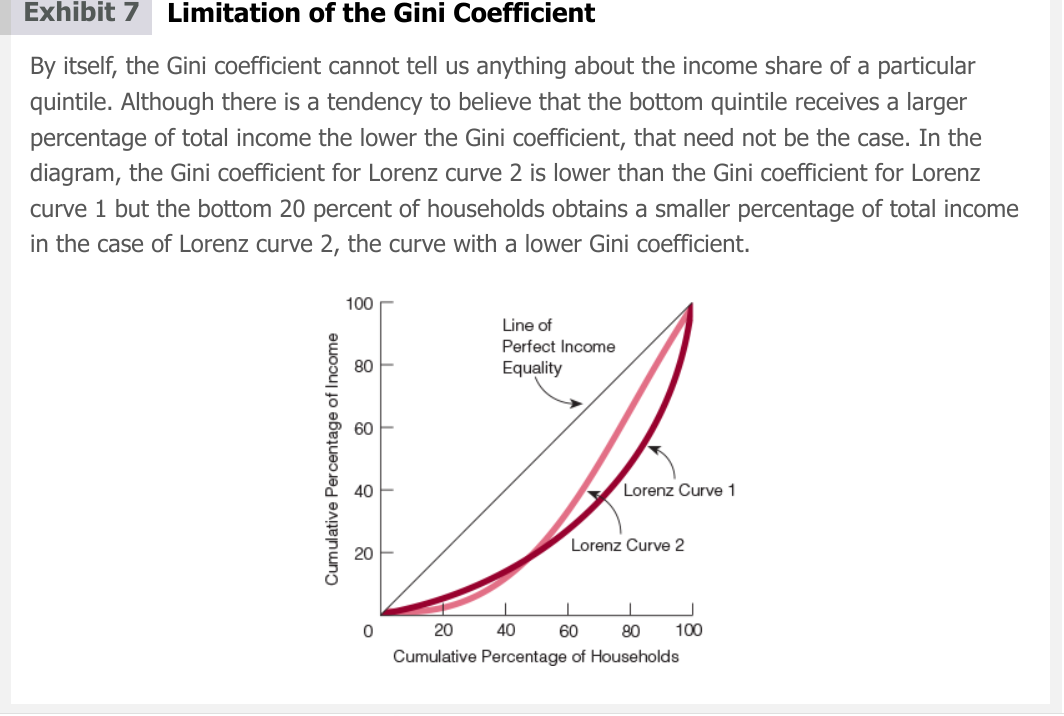
Limitation of Gini Coefficient
Cannot tell what is happening in different quintiles. Not enough information is given to determine
6 factors contributing to income equality
Innate abilities and attributes − People vary in their degrees of intelligence, in their appearance, in their levels of creativity, etc.
Work and leisure − Some people will choose to work more hours, which will be reflected in their income.
Education and other training
Risk taking − Some people are more willing to take on risk than others; some of these will do well and rise to the top of the income distribution.
Institutional factors − Minimum wage fluctuations and declining unionization
Skill-based technological change
Wage Discrimination
Human Capital
Education, development of skills, and anything else that is particular to the individual and that increases personal productivity.
Wage Discrimination
The situation in which individuals of equal ability and productivity (as measured by their contribution to output) are paid different wage rates.
Reasons for Income Differences
more marketable skills
Decide to work harder and longer hours
Take on more risk than others
Undertake more schooling and training than others
Poverty defined in absolute terms
In absolute terms, poverty might be defined as follows: Poverty exists when the income of a family of four is less than $10,000 per year.
Poverty defined in relative terms
In relative terms, poverty might be defined as follows: Poverty exists when the income of a family of four places it in the lowest 10 percent of income recipients.
Poverty income threshold/ Poverty Line
The income level below which people are considered to be living in poverty.
Limitations of Poverty Statistics
Poverty figures are based solely on money incomes. (Many money-poor persons receive in-kind benefits. For example, a family of four with a money income of $26,172 in 2019 was defined as poor, although it might have received in-kind benefits worth, say, $4,000. If the poverty figures are adjusted for in-kind benefits, the percentage of persons living in poverty drops.)
Poverty figures are not adjusted for unreported income, (leading to an overestimate of poverty.)
Poverty figures are not adjusted for regional differences in the cost of living, (leading to both overestimates and underestimates of poverty.)
Government counters are unable to find some poor persons (such as some of the homeless—a circumstance that leads to an underestimate of poverty.)
“The Poor”
Some groups that are represented much more prominently in the poverty figures
Reasons Government should not redistribute income
Argument against government welfare assistance
Help the poor through charity
Not government using its powers to take from some to give to others
Reasons Government should redistribute income
Argument for government welfare assistance
Public good-free rider justification
Social-insurance justification
(Proponents of the public good-free rider position make the following arguments:
Most individuals in society would feel better if there were little or no poverty.
Witnessing the signs of poverty—such as slums, hungry and poorly clothed people, and the homeless—is distressing.
Therefore, there is a demand for reducing or eliminating poverty.)
(The social-insurance justification holds that individuals not currently receiving welfare think that they might one day need it and thus are willing to take out a form of insurance for themselves by supporting welfare programs with their tax dollars and votes.)
Interest
Price for credit, or loanable funds
Return that capital earns as an input in the production process
− Loanable Funds: Funds that someone borrows and another person lends, for which the borrower pays an interest rate to the lender.
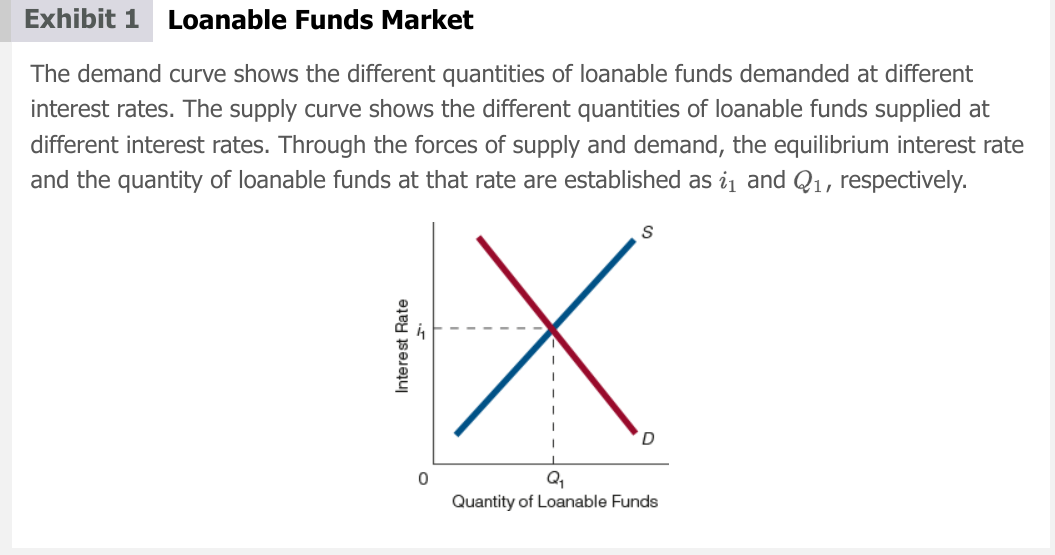
Equilibrium interest rate
determined by demand and supply of loanable funds
Loanable Funds
Funds that someone borrows and another person lends, for which the borrower pays an interest rate to the lender.
Savers
people who consume less than their current income
Supply curve of loanable funds is _____ sloping
Upward sloping; Higher interest rate = Greater Quantity Supplied of loanable funds and vice versa
(Without savers, there would be no supply of loanable funds. Savers receive an interest rate for the use of their funds, and the amount of funds saved and loaned is directly related to the interest rate)
2 loans of demand for loanable funds
Consumption Loans
Investment loans
Positive rate of Time Preference
A preference for earlier over later availability of goods
(EX. most people would prefer to have a car today than to have one five years from today.)
Roundabout Method of Production
The production of capital goods that enhance productive capabilities
Total demand for loanable funds =
sum of consumption and investment loans
Demand curve for loanable funds is _____ sloping
downward
Equilibrium interest rate
The price for loanable funds and the return on capital goods tend to equality.
Both the price for loanable funds and the return on capital are referred to as interest because they tend to become equal.
Risks
When a loan Is lended, there’s possibility it will not be repaid
Some borrowers are more likely to repay loans than others (Major corporation is more likely to repay than broke college student)
Term of the loan
Longer loan term = higher interest rate
Shorter loan term = lower interest rate
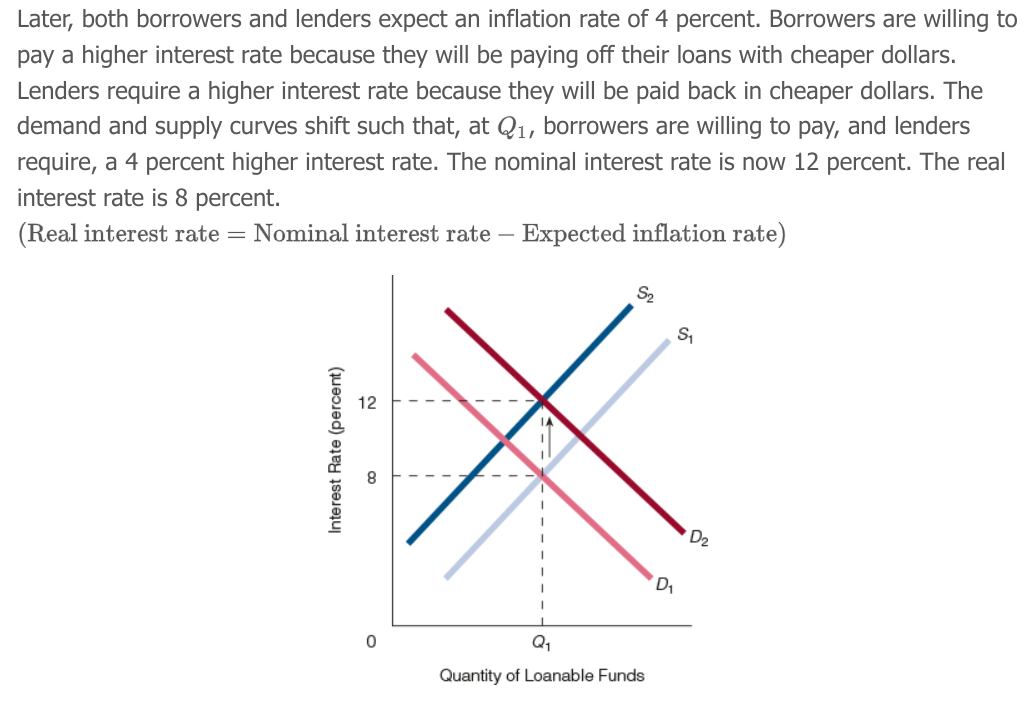
nominal interest rate
The interest rate determined by the forces of supply and demand in the loanable funds market.

Real interest rate
The nominal interest rate adjusted for expected inflation; that is, the nominal interest rate minus the expected inflation rate.
(Real Interest rate = Nominal interest rate - Expected inflation)
Present value formula
PV = An / (1 + i)n

Present value
The current worth of some future dollar amount of income or receipts
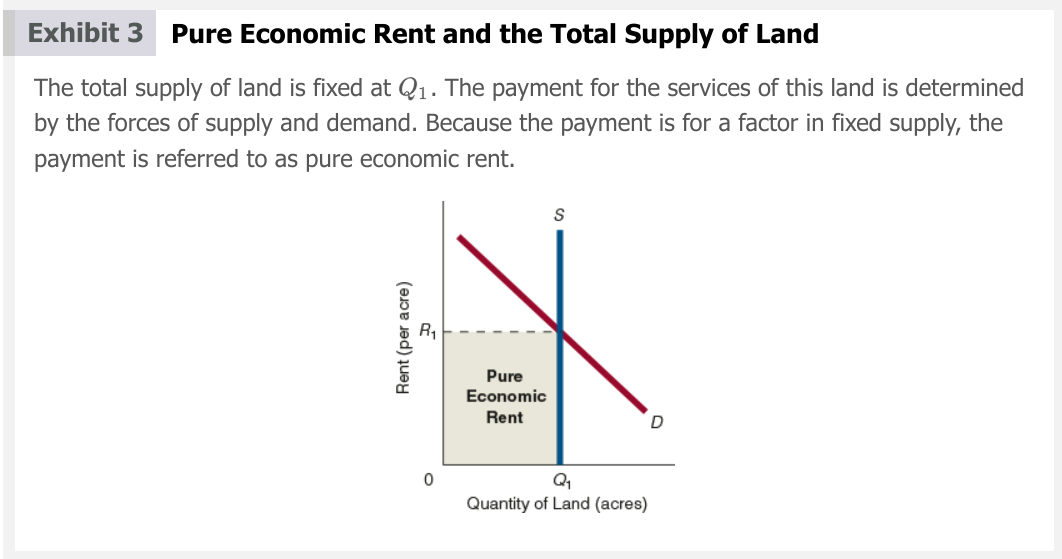
Economic rate
Payment in excess of opportunity costs.
Perspective MATTERS
(Example: If a baseball star who earns $1 million playing baseball was instead a high school coach earning $40,000/year. The difference of $960,000 is economic rent. − But a different alternative would be the alternative to playing for the present team. If playing for another team at $950,000 then economic rent is only $50,000.)
Pure economic rate
A category of economic rent such that the payment is to a factor that is in fixed supply, implying that the factor has zero opportunity costs.
In 19th century England, people argued that grain prices were _____ because land rents were ______.
Rising
Person who disagreed that grain price was rising because land rent was rising
David Ricardo
David Ricardo disagreed that grain price was rising because land rent was rising because he contended that _____ were high because ____ _____ were high
rents, grain prices
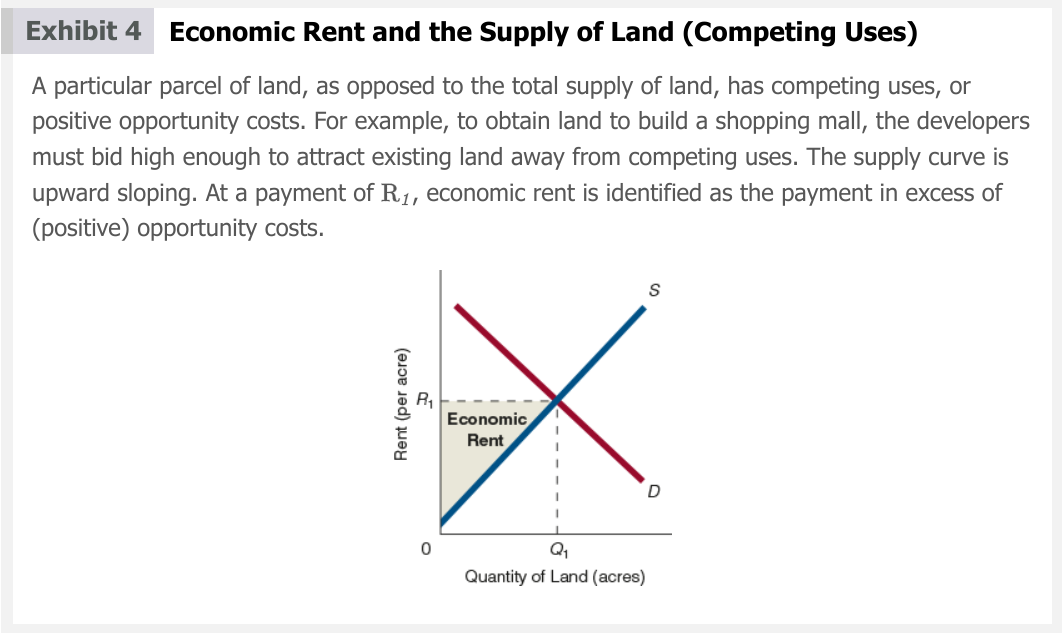
Supply curve of land can be _____ sloping
upward
Artifical rent
an economic rent artificially contrived by government
Economic profit formula
TR – TC (explicit costs + implicit costs)
(Economists emphasize economic profit over accounting profit because economic profit determines entry into and exit from an industry.)
Uncertainty in Profit
exists when the probability of something occurring is so unpredictable that it cannot be estimated
2 ways of increasing trade
produce a good or service that satisfies an unmet demand
reducing the transaction costs of making trades
Resources
Land, labor, capital, entrepreneurship
Market
Any place people come together to trade.
Entrepreneurs and goals
Entrepreneurs operate within markets. Specifically, their actions are directed toward increasing the number of trades.
Goals of Entrepreneurs
They try to produce a good or service that satisfies an unmet demand
Reduce the transaction costs of making trades
Sometimes the entrepreneur increases the number of trades.
Sometimes they changes the nature of the trade
Market Failure
A situation in which the market does not provide the ideal or optimal amount of a good
Externality
A side effect of an action that affects the well-being of third parties.
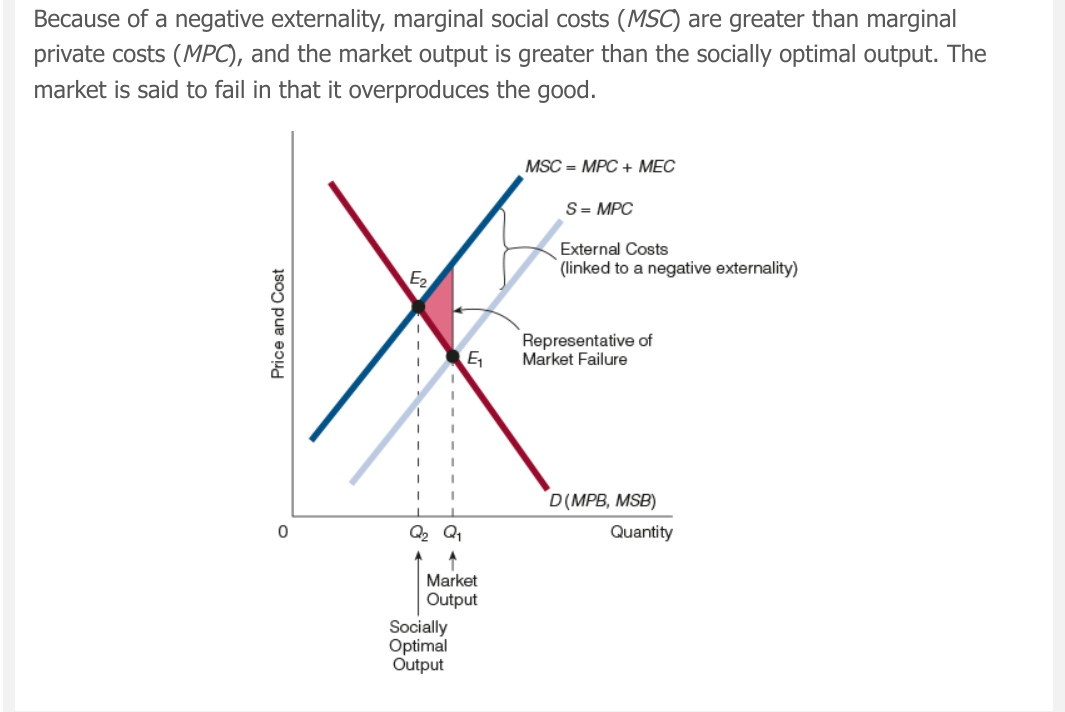
Negative externality
The condition in which a person’s or group’s actions impose a cost (an adverse side effect) on others
(For graph: The shaded triangle is the net social cost of moving from the socially optimal output to the market output. When the socially optimal output is smaller than the market output)
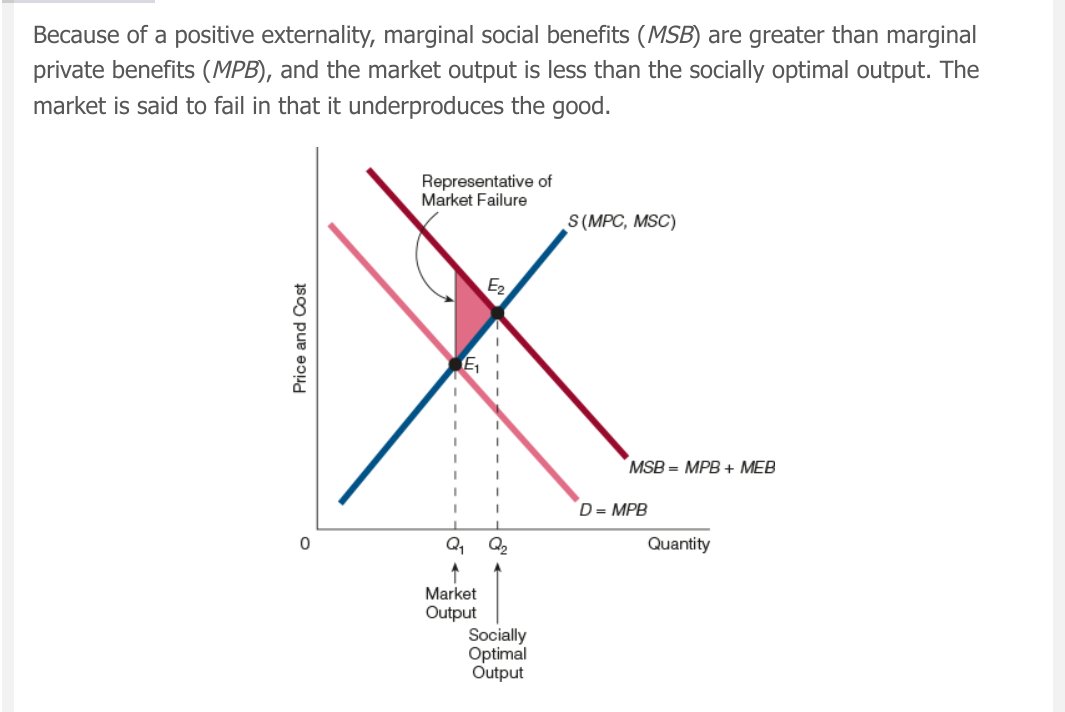
Positive externality
The condition in which a person’s or group’s actions create a benefit (a beneficial side effect) for others
(For Graph: The shaded triangle is the net social cost of moving from the socially optimal output to the market output. When the socially optimal output is larger than the market output)
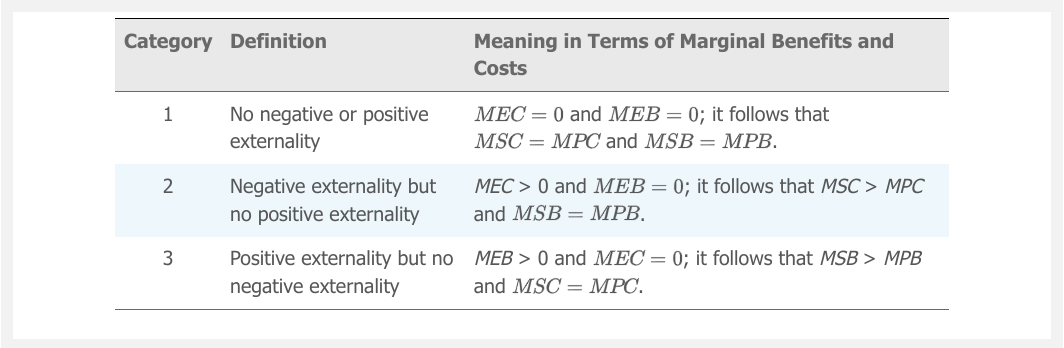
Marginal Social Cost (MSC) =
Marginal Private Costs (MPC) + Marginal External Costs (MEC)
Marginal Social Benefit (MSB)=
Maginal Private Benefit (MPB)+ Marginal External Benfefit (MEB)
Socially optimal output is at
MSB = MPC
Traits of externalities
Externalities can arise because:
Someone consumes something that has an external benefit or cost for others.
Someone produces something that has an external benefit or cost for others.
Internalizing Externalities
An externality is internalized if the persons or group that generated the externality incorporate into their own private or internal cost–benefit calculations the external benefits (in the case of a positive externality) or the external costs (in the case of a negative externality).
(Explanation: internalizing externalities is the same as adjusting for externalities. An externality has been internalized, or adjusted for, completely if, as a result, the socially optimal or efficient output emerges)
Persuasion in negative externalities
Many negative externalities arise partly because persons or groups do not consider other individuals when they decide to undertake an action.
Taxes and subsidies effect on externaltiy
A tax adjusts for a negative externality.
A subsidy adjusts for a positive externality.
Assigning property rights to adjust externalities
No one "owns" the air and oceans − Determine legal ownership of natural resources
Other ways to adjust for externalities
Voluntary agreements
Combining property rights and voluntary agreements
Coase Theorem
The proposition that private negotiations between people will lead to an efficient resolution of externalities, as long as property rights are well defined and transaction costs are trivial or zero
Significant for two reasons:
It shows that, under certain conditions, the market can internalize externalities.
It provides a benchmark for analyzing externality problems; that is, it shows what will happen if transaction costs are trivial or zero.
External regulator of externalities
The government
Government applies regulations directly to the activities that generate the externalities.
Once regulations are instituted, they are difficult to remove, even if conditions warrant their removal.
Regulations are often applied across the board when individual circumstances dictate otherwise.
Regulation entails cost.
3 types of environmental policy
government regulation, or command and control;
emission taxes; and
tradable pollution permits (also known as cap and trade).
Method 1 of environmental policy
Method 1: Government regulation, or command and control
Specify a certain type of pollution control technology or set quantitative limits on pollution.
Critics:
Mandating reduces the incentive for new, lower cost methods.
Set limits on pollution will be easier for some factories.
Method 2 of environmental policy
Method 2: Emission taxes
The ideal corrective tax is equal to the marginal external cost associated with the negative externality.
Prefer to command and control policy
Tax can achieve the same reduction in pollution.
More efficient as it places a price on the right to pollute.
Method 3 of environmental policy
Method 3: Tradeable pollution permits (cap and trade)
A “cap” or ceiling is placed on how much pollution can be emitted. The permits are allocated to polluters.
The "trade" is that the permits can be auctioned off. A market for pollution permits emerges.