Ch 53- Population Ecology
1/44
Earn XP
Description and Tags
ball like lebron
Name | Mastery | Learn | Test | Matching | Spaced |
|---|
No study sessions yet.
45 Terms
What are the different mechanisms in which organisms enter and leave a population?
Enter: births & immigration; Leave: deaths & emigration.
What is dispersion?
Spacing of individuals within a population
What is density?
Number of individuals per unit area
What is distribution?
% of a population over an area
How to calculate population?
(birth + immigration) - (death + emigration)
How to calculate the growth rate?
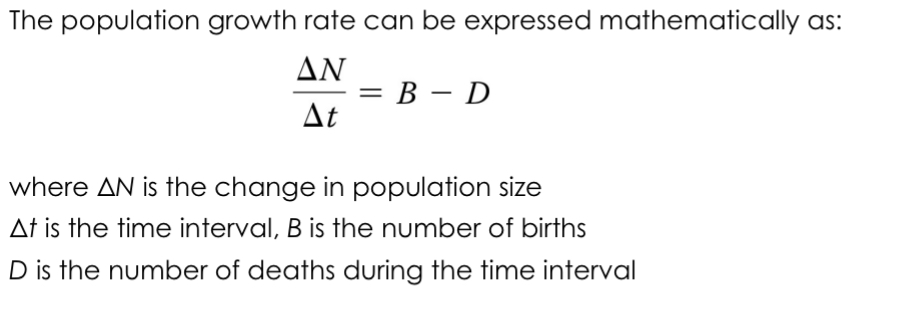
What is the mark and recapture method?
Method to determine population size
How to do mark and recapture?
Capture & mark individual
Recapture & check for mark

What are some examples of taggings?
Bands, microchips, natural markings etc. (think birds and their bands or a humpback’s unique tail)
What are the pattern of dispersion?
Refers to the spatial distribution of individuals within a population, which can be categorized as clumped, uniform, or random.
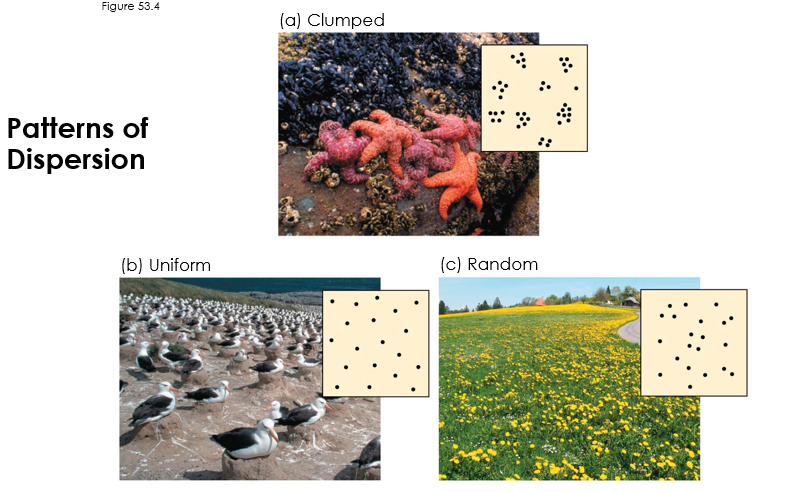
What is clumped dispersion?
Clumped dispersion is a pattern of population distribution where individuals are grouped together in specific areas, often due to resource availability, social behavior, or environmental conditions.
Ex. Elephants caring for young will be clumped up
What is uniform dispersion?
Uniform dispersion is a pattern of population distribution where individuals are evenly spaced throughout an area, often due to competition for resources or territorial behavior.
Ex. Birds nesting at equal distances.
What is random dispersion?
Random dispersion is a pattern of population distribution where individuals are distributed unpredictably and independently of one another; usually if there’s no resource limitation
Ex. Trees in a forest where seeds are dispersed by wind.
What are demographics?
Stats that describe a population (age, sex, minority status etc.)
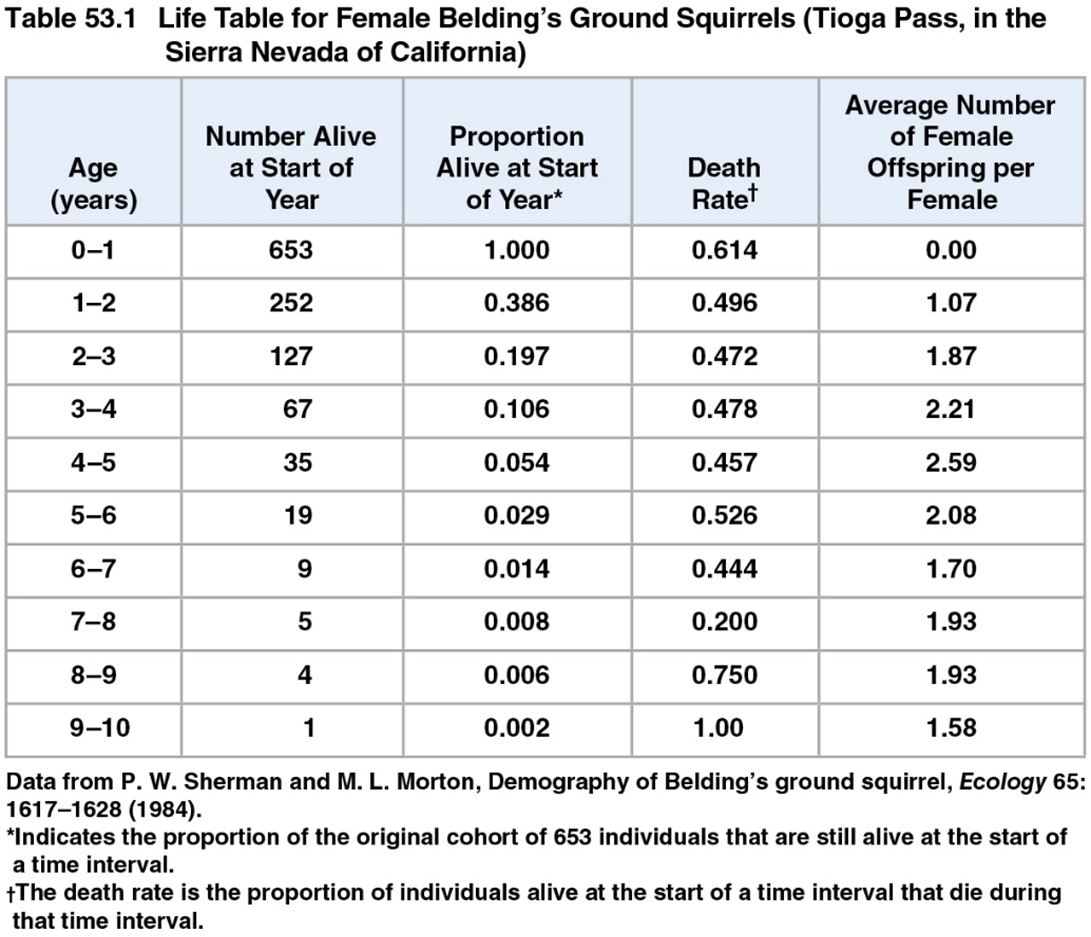
What is a life table? Why are males ignored in life tables?
Age-specific summary of survival rates & reproductive rates, made by following the group of same age from birth to death
Males are ignored because they don’t reproduce
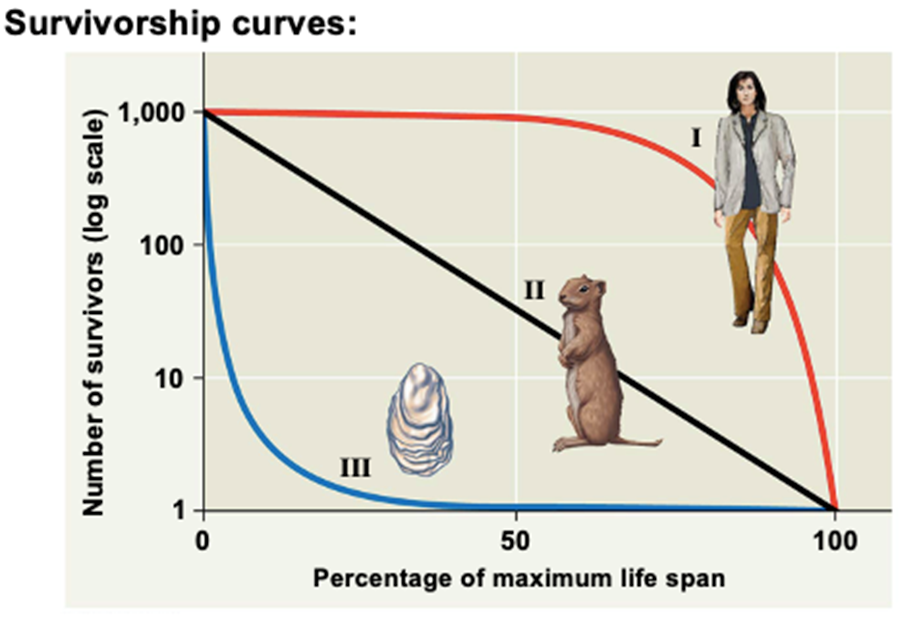
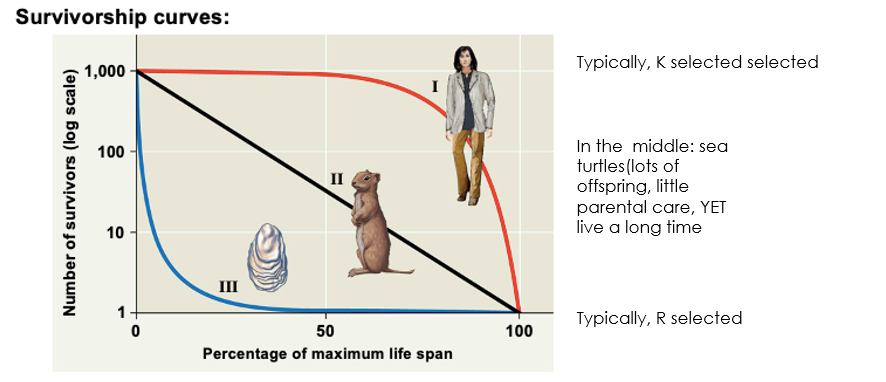
What is the survivorship curve?
A graph that represents the number of individuals surviving at each age in a population.
what is a type 1 survivorship curve and an example of an organism that follows this?
A Type I survivorship curve = individuals have a high probability of surviving to adulthood, with most mortality occurring in older age groups.
Ex. Humans
What is a type 2 survivorship curve & a organism that follows this?
A Type II survivorship curve indicates a steady increase in death rates
Ex. Birds
What is a type 3 survivorship curve & a organism that follows this?
A Type III survivorship curve indicates a high mortality rate in early life stages, with few individuals surviving to adulthood.
Ex. Sea turtles.
Know how to read survivorship curve
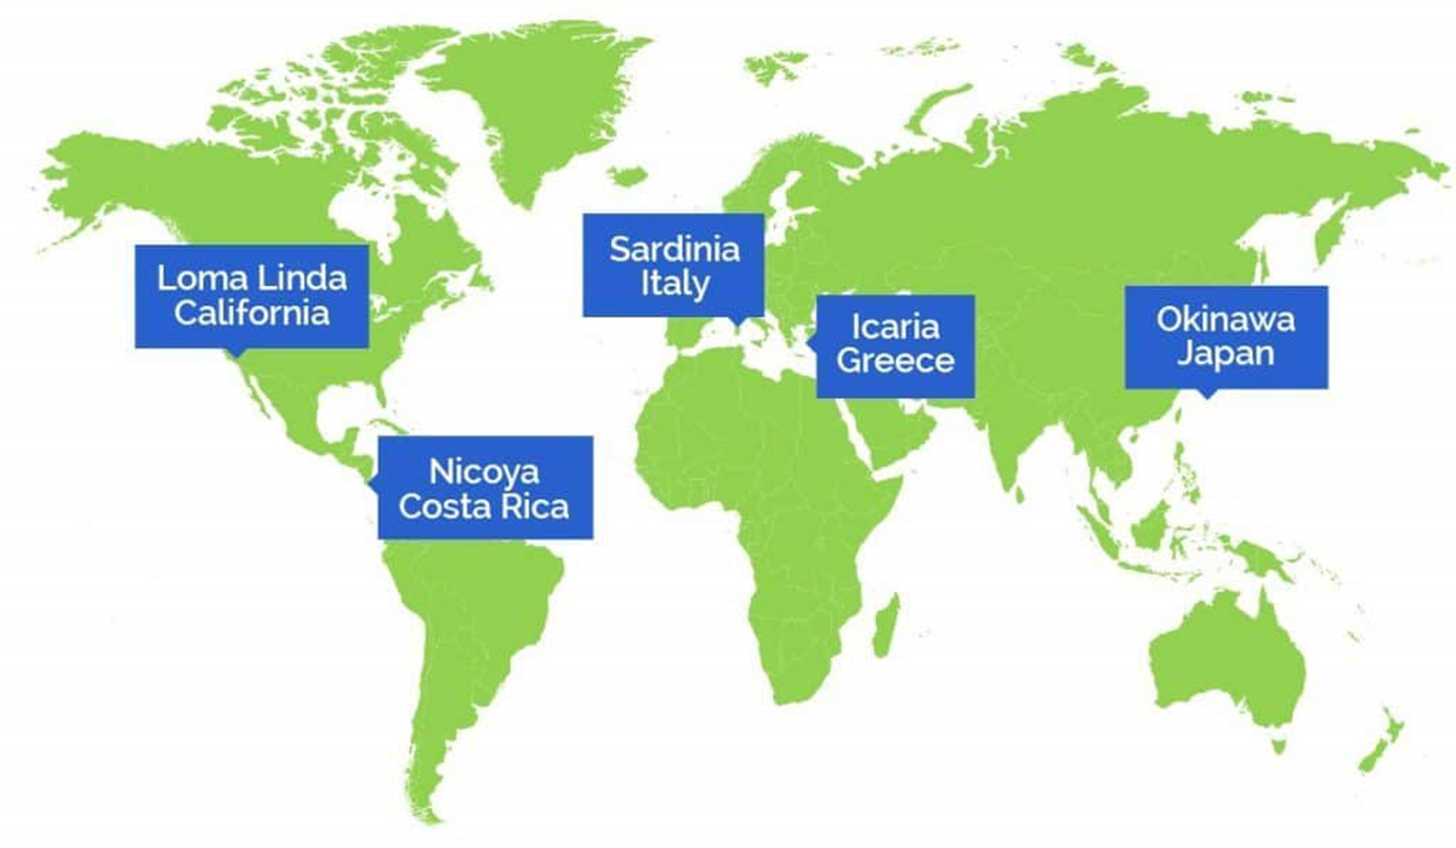
What is the blue zone?
Regions of the world where people live significantly longer, often reaching age 100 or more, due to factors like diet, lifestyle, and social engagement.
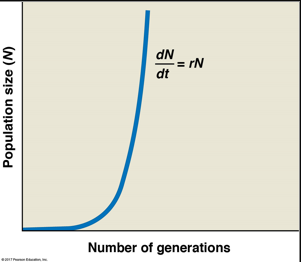
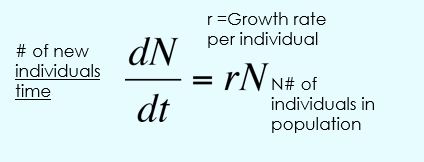
What is exponential growth?
The number of individuals increases at a constant rate over time, typically resulting in a J-shaped curve on a graph. This occurs in ideal conditions with abundant resources.
Ex. Elephants after hunting was banned
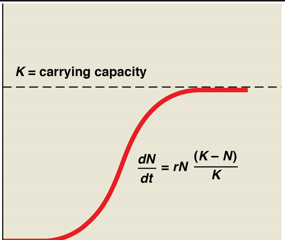
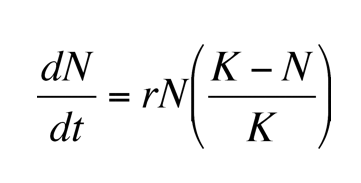
What is the logistic model?
The population's growth rate decreases as it approaches the carrying capacity of its environment, typically resulting in an S-shaped curve.
Ex.
What are K selected species?
Slow population growth; stabilize at carrying capacity, more parental care less kids
Ex. humans
What are R selected species?
High population growth, colonize new areas
Ex. Rabbits
Exponential growth variables
Logistic growth variables
Same thing as exponential, only difference is K = carrying capacity
When would the logistic growth variable be used?
Used to predict rate of recovery & estimate sustainable harvest rates
Ex. Vaquita population recovery
What is an organism’s life history?
Stages of its reproduction, growth, and survival strategies. This also encompasses traits like age at first reproduction, number of offspring, and lifespan.
What is semelparity?
Organism produces all its offspring in a single reproductive event, after which it typically dies.
Ex. salmon spawning
What is iteroparity?
Organism produces offspring multiple times throughout its life, resulting in several reproductive events.
Ex. Humans
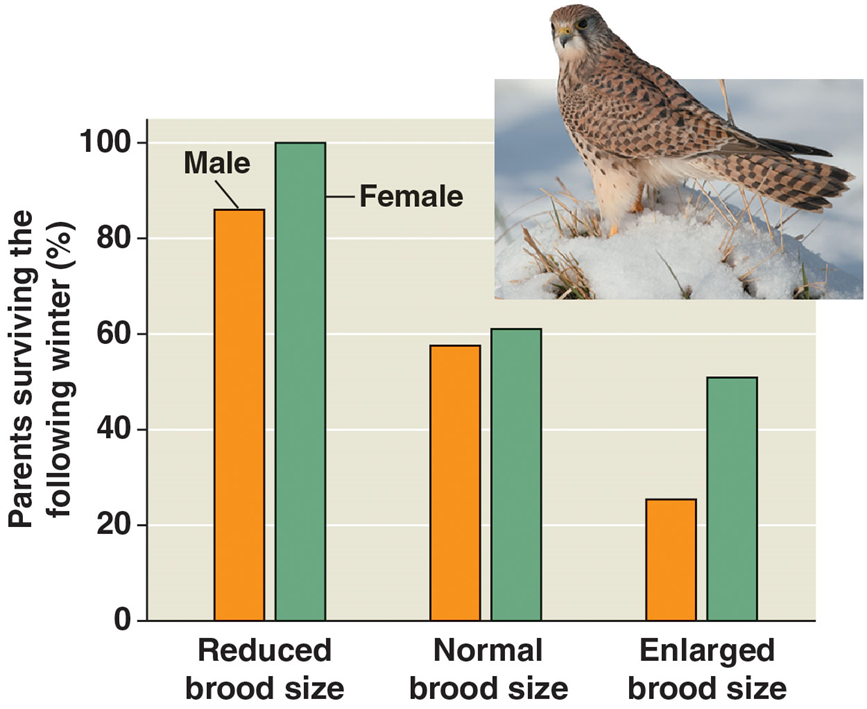
What is a trade off?
One function can reduce the resources available for another function
Ex. Increased offspring sizes for a kestrel can decrease the parent’s survival chances bc ur spending more time hunting for ur kid
Which survivorship curve would be the R and K selected species?
R selected species are typically represented by a Type III survivorship curve, which shows high mortality rates early in life but increased survival for those that reach maturity.
K selected species are generally represented by a Type I survivorship curve, indicating lower mortality rates early in life and high survival into later years.
What are density independent factors?
are environmental components that affect population size regardless of density, such as natural disasters or climate extremes.
What are density dependent factors?
are environmental components that impact population size based on the density of the population, such as competition, predation, and disease.
What is competition?
Interaction between species or individuals within a population for limited resources, which can affect growth, survival, and reproduction.
Ex. wolf fighting another wolf for a deer
What is interspecific competition?
Interaction between different species competing for the same resources, affecting their growth and survival.
What is intraspecific competition?
Interaction among individuals of the same species competing for limited resources can influence their population dynamics and fitness.
What are the consequences of interspecific competition?
Individuals can be excluded or coexist
Ex. faster growing algae takes over slower growing coral for space
What is competitive exclusion?
The principle stating that two species competing for the same resources cannot coexist indefinitely; one species will outcompete the other, leading to the extinction of the less competitive species.
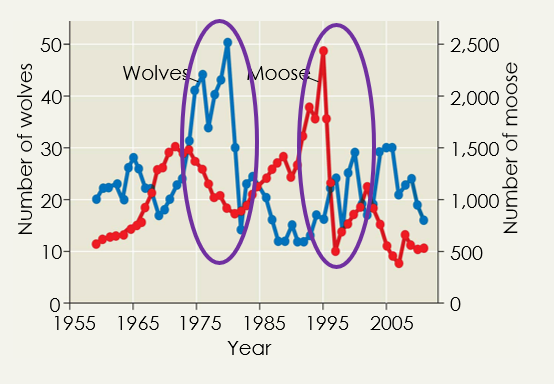
Predator-Prey population cycle
Population cycle can either follow in a predictable manner, like the lynx & hare or an unpredictable boom & bust like the moose & wolves
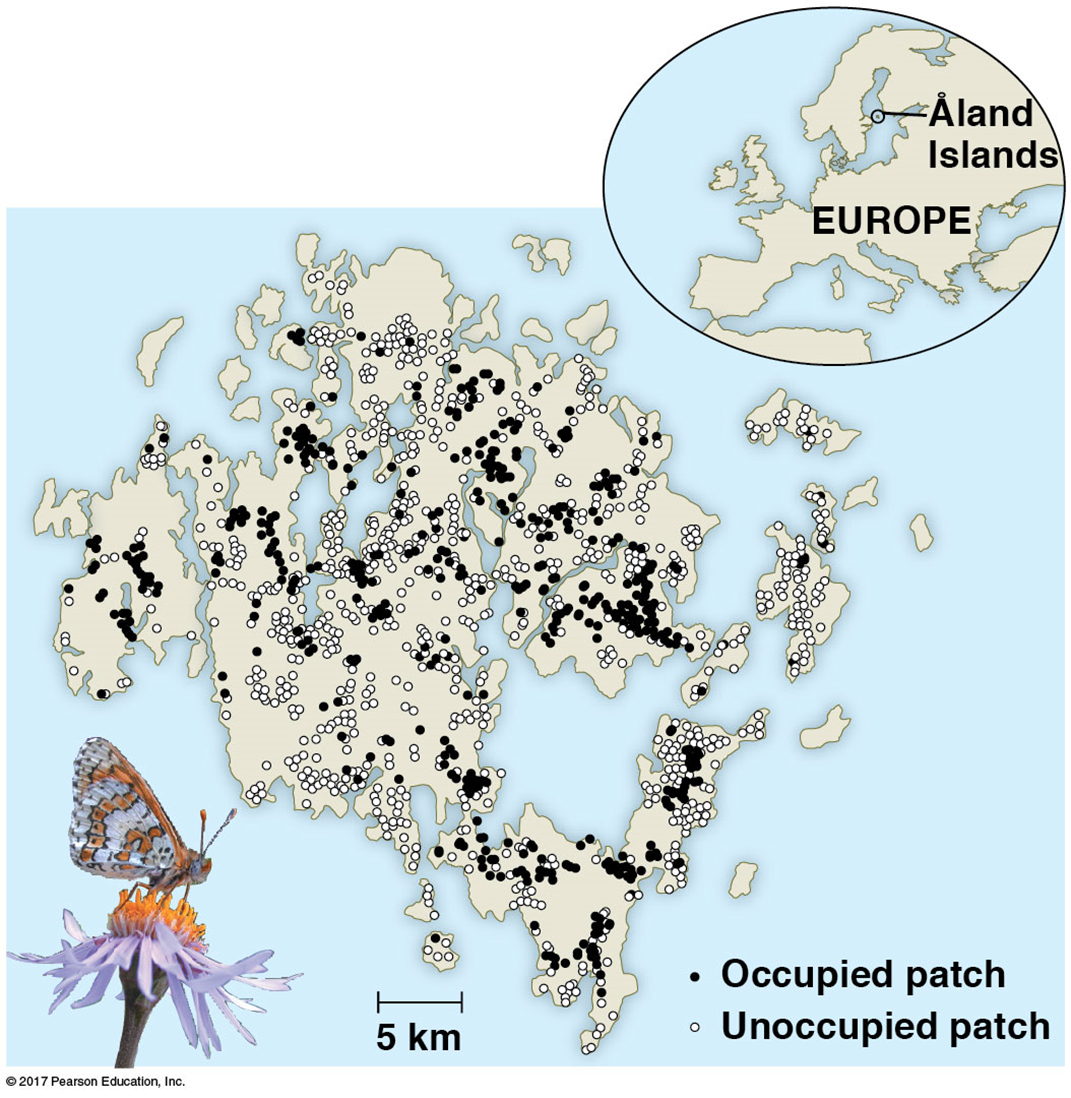
What is metapopulation?
Local population linked by immigration & emigration; local populations found in discrete patches of suitable habitats surrounded by unsuitable habitat
Ex. Butterfly species connected through migration across fragmented landscapes.
What’s happening with the human population? What are the consequences of human growth?
Not growing exponentially anymore but still increasing rapidly
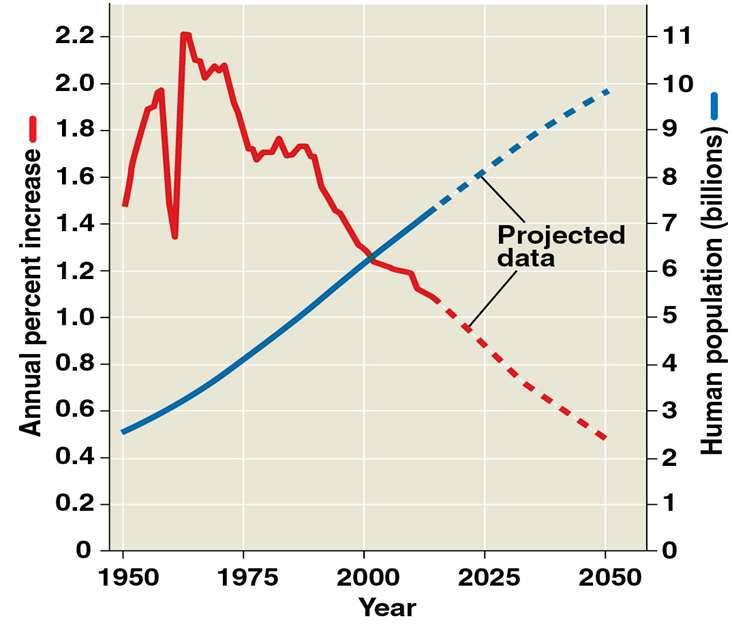
Consequences: we have to deal w/ sustainability & conservation fo resources
What is one factor affecting population growth?
A country’s age structureQA
What is a age structure?
The distribution of individuals of different ages within a population, which influences growth rates and reproductive potential.