Economic Efficiency
1/57
There's no tags or description
Looks like no tags are added yet.
Name | Mastery | Learn | Test | Matching | Spaced | Call with Kai |
|---|
No analytics yet
Send a link to your students to track their progress
58 Terms
What is economic efficiency?
Economic efficiency is the optimal allocation of resources to maximize total societal benefit.
What is productive efficiency?
Productive efficiency is when goods and services are produced at the lowest possible cost, using the least amount of resources
It is split into technical and cost efficiency.
What is productive (technical) efficiency?
when a firm produces the maximum output from a given set of inputs, without wasting resources, meaning no additional output can be produced without increasing inputs.
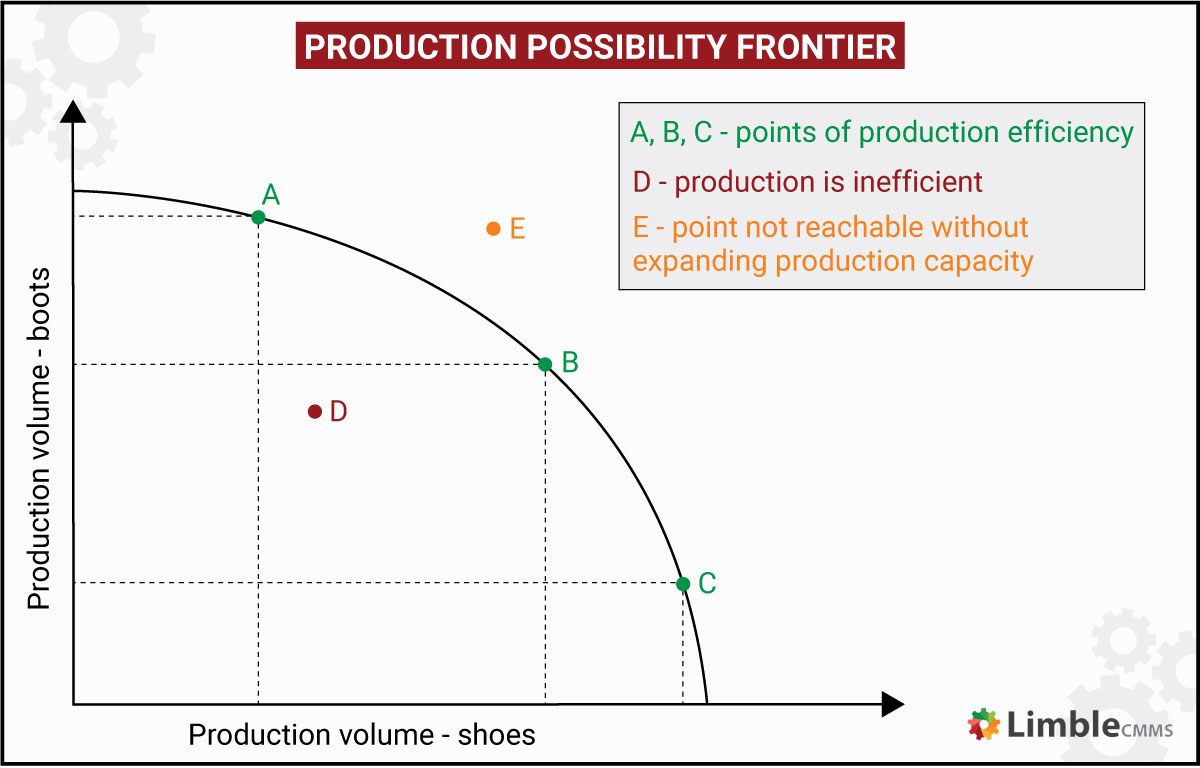
What is the graph and explanation for productive (technical) efficiency?
graph line is productively efficient, inside graph line is productively inefficient, some input wasted as not producing what is possible.
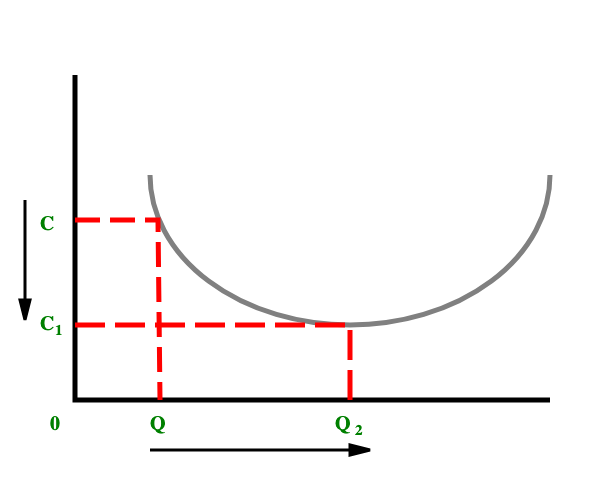
What is the graph and explanation for productive (cost) efficiency?
when you produce more, you benefit from economies of scale, so you can produce at the lowest possible average cost.
What is productive cost efficiency?
where a firm produces goods or services at the lowest possible cost, using the least amount of inputs for a given level of output.
Name 3 examples of economies of scale
Purchasing, technical, Specialisation
What is Purchasing Economy of Scale?
higher output= buy raw materials in bulk= discount from supplier= reduced avg cost
What is technical Economies of Scale?
Higher output= buy larger capital equipment= more output in a shorter period of time= reduced avg costs
What is Specialisation Economies of Scale?
Higher output= hire more workers & implement division of labour= workers become experts in their task & productive= more output in period of time= lower avg. costs
What is allocative efficiency?
when resources are allocated to produce the goods and services most desired by society, such that marginal benefit equals marginal cost.
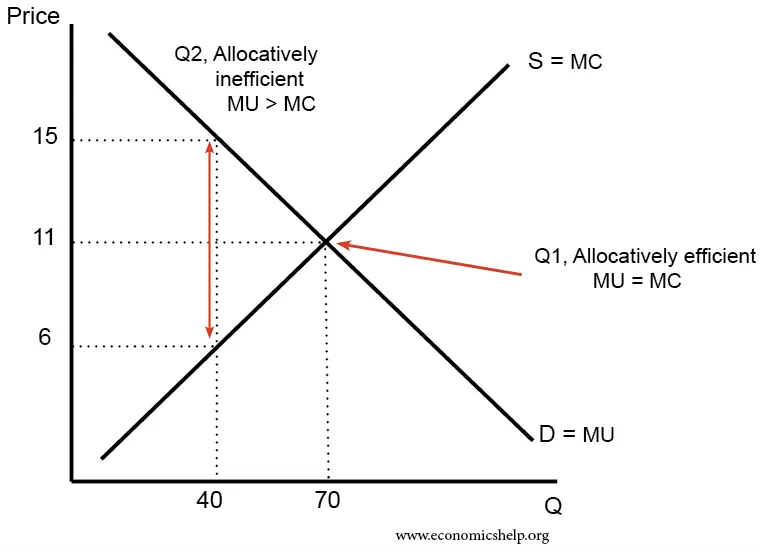
How is allocative efficiency illustrated in a graph?
Allocative efficiency is illustrated on a graph where the marginal cost (MC) curve intersects the marginal benefit (MB) curve
When is economic efficiency achieved?
When both productive (firms seek lowest possible costs for profit motive) and allocative ( making goods that satisfy consumers) efficiency.
What is a market?
anywhere where buyers and sellers come together to transact with each other.
What is a competitive market?
A market with many buyers and sellers trading identical products, where no single participant can influence the price.
What is an oligopoly?
A market structure where a few large firms dominate
What is a monopoly?
A market structure where a single firm dominates, so the firm can dictate prices.
What is a monopsony?
where a single buyer dominates, giving them significant power to influence prices and terms of purchase.
What is market failure?
A situation where the free market fails to allocate resources efficiently, leading to a loss of economic and social welfare.
What is partial market failure?
When the market functions but it supplies either the wrong quantity of product or at the wrong price.
What is complete market failure?
When the market does not supply any products; there is a missing market.
What might cause market failure?
Lack of competition- e.g. a monopoly
Externalities- additional costs/ benefits which impact 3rd parties. If these are not factored into the price, over/underproduction occurs.
Imperfect information- lack of up to date info may lead to consumers buying bad products or not enough good products.
Missing market- some goods are not profitable to produce so firms don’t
Immobility of resources- some resources cannot be moved easily to switch production to a new item- means old product is still produced.
What is a private cost?
The costs to a firm e.g. staff wages, raw materials, etv.
What are external costs?
costs paid by third parties when a firm produces a good.
What are social costs?
private + external costs.
What are private benefits?
benefits felt by those taking an action, e.g. consuming a good.
what is an external benefit?
benefits felt by third party
what is the social benefit?
private + social benefit
What are negative production externalities?
Costs on 3rd parties as a result of the actions of prducers.
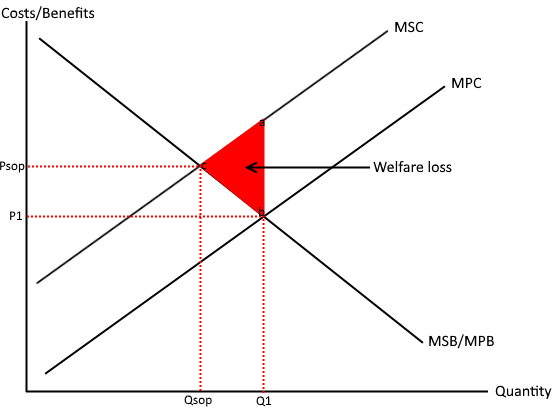
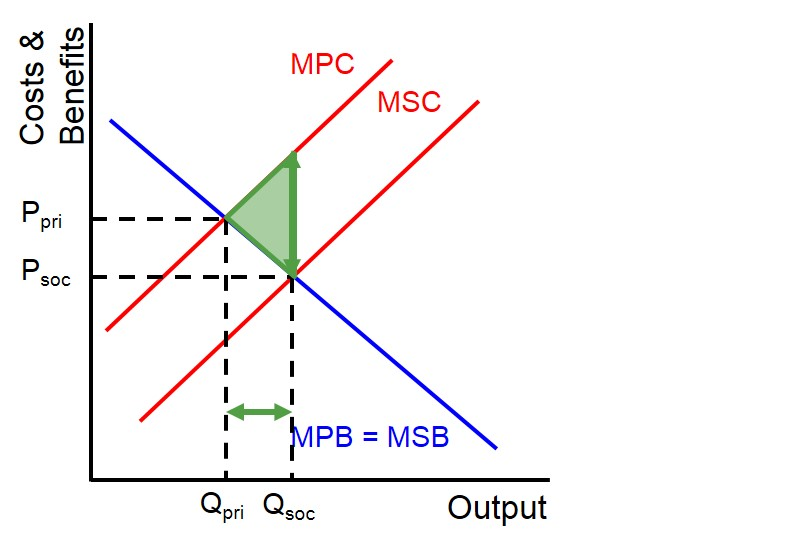
What is the graph for negative production externalities?
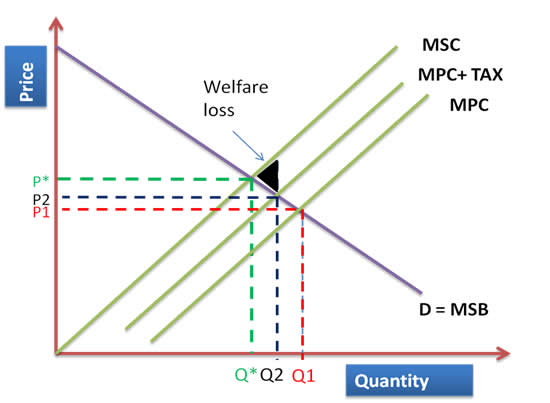
At FMA- MSC > MPC, so market failure occurs,overproduction.
At SO- MSC= MSC, so social optimum, economic efficiency.
Gap between social cost & social benefit is welfare loss
Why do negative production externalities occur?
Firms have no incentive to account for external costs
Causes a misallocation of resources, overproduction
price of good is too low, causing market failure.
How can you correct negative production externalities by indirect tax?
the tax increases the cost of production for producer ( increases MPC)
This decreases supply, so overproduction is reduced ( moves closer to SO)
Price of good increases & incorporates some ext. costs
Polluter Pays Principle.
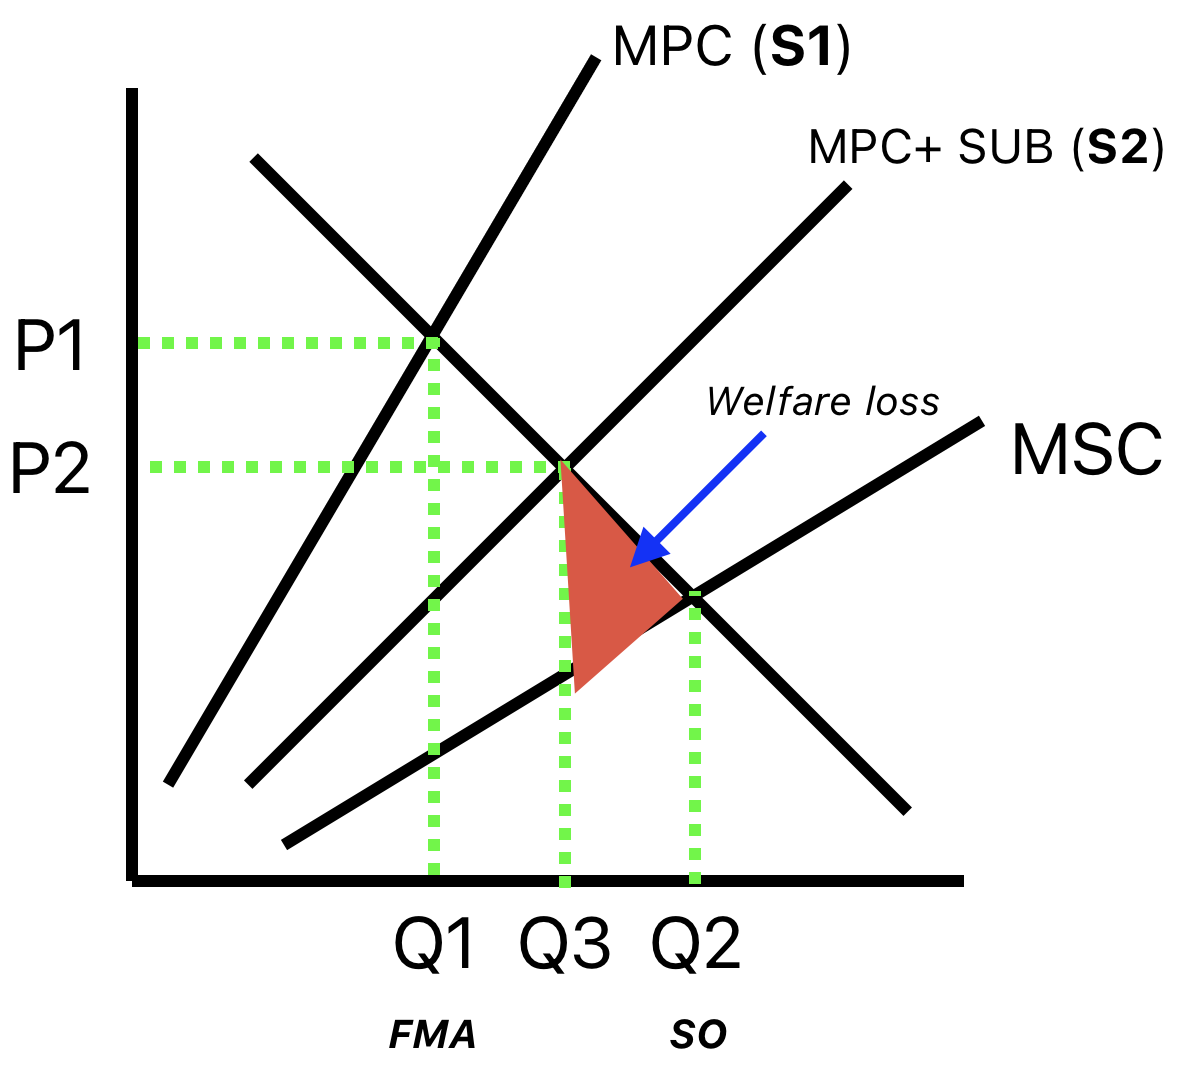
How is correcting a negative production externality with indirect tax shown on a graph?
Tax increases costs of production, S1 to S2
Causes an increase in price which incorporates some external costs
overproduction reduced, tax moves Supply line closer to SO.
What are two advantages of using indirect tax to tackle negative production externalities?
Increased production costs= alternative greener methods of production now cheaper in comparison so firms are incentivised to improved production process=> reduced external costs
Increased govt. revenue to use to ring fence external cost and use to fund methods of reducing it.
What are four disadvantages of using indirect tax to tackle negative production externalities?
if tax is too small, production costs won’t increase substantially= supply does not fall by much= market failure is reduced not solved.
Demand may be inelastic= firm can pass on tax onto the consumer= production doesn’t fall= output remains at FMA.
If tax revenue isnt ring fenced, the externalities still exist and do damage
Firms may just relocate if taxes are too high, causing other markets to fail.
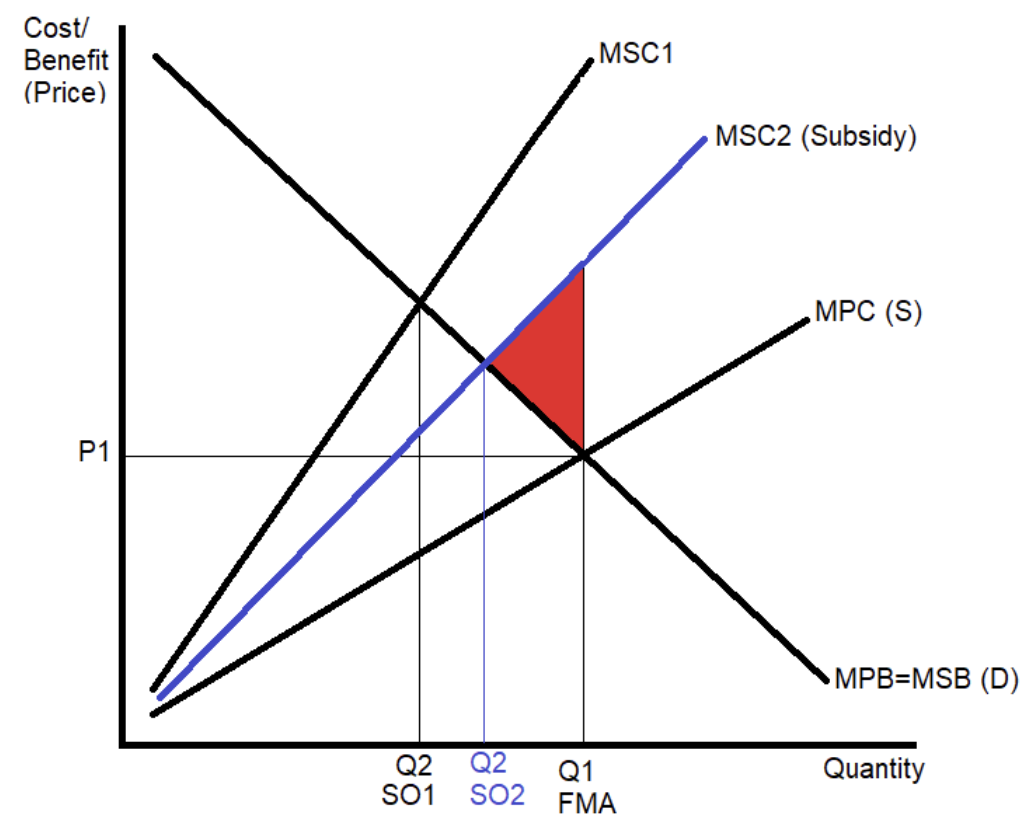
How does subsidising green technology help correct negative production externalities? What is the graph?
provides firm with more finance to help fund green tech.
green tech causes each unit of output to be produced with a lower external cost
Means the MSC is closer to MPC.
What are 2 advantages of using a subsidy to tackle negative production externalities?
Output stays the same , & no increase in price for consumers
Absence of extra tax/costs, so firms less likely to relocate.
What are 3 disadvantages of using a subsidy to tackle negative production externalities?
may be insufficient green technology available to purchase
If the subsidy is too small, the firm may not be able to afford the most efficient green technology > market failure still exists
Subsidies are expensive > taxes may have to rise to pay for subsidy
What is tragedy of the commons?
A situation where individuals, acting in their own self-interest, overuse and deplete a shared, common resource, leading to its degradation and inefficiency.
How do regulations and fines correct negative prodcutioon externalities?
hope is that fines are a big enough deterrent to make firms invest in green tech/ lower production.
regulation implemented
if firm cannot reach regulation amount, production is cut, for fear of fines.
Market failure reduces, as MPC increases closer to MSC
This decreases the welfare loss
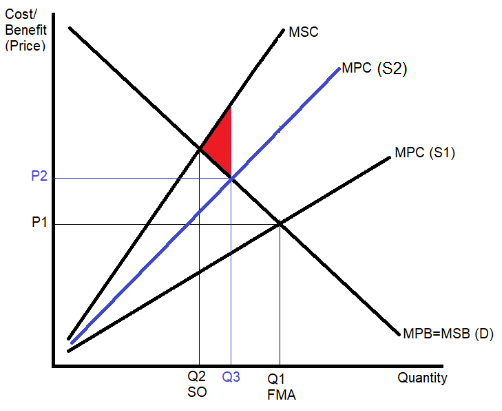
What is the graph for correcting negative production externalities through regulations and fines, by the firm reducing output?
Regulation implemented, firm reduces output through fear of fines.
MPC gets closer to MSC, as supply decreases
reduces market failure as overproduction lessens, meaning production is closer to social optimum.
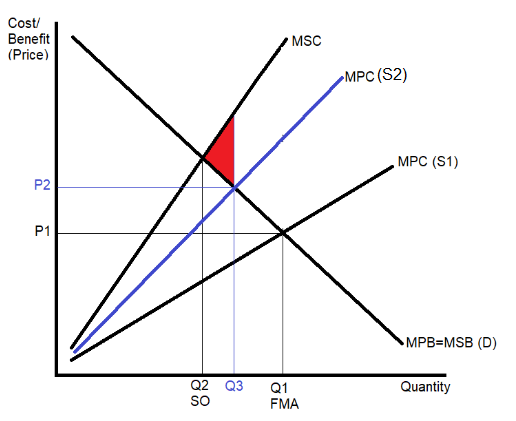
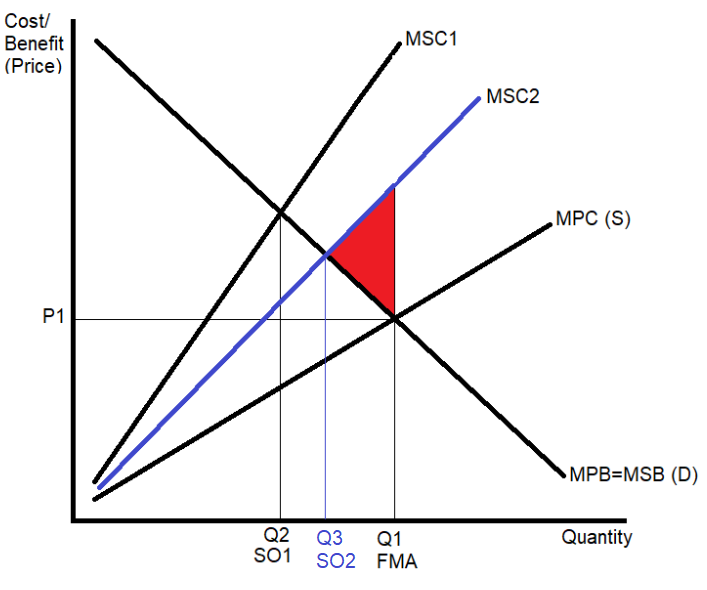
What is the graph for correcting negative production externalities through regulations and fines, by the firm buying green tech?
regulation implemented
if firm wants to maintain output, they buy green tech to meet pollution limit, price stays the same.
This reduces external costs, MSC1 to MSC2
market failure reduced as social optimum shifts closer to MPC

What are some advantages of using regulations and fines to tackle negative production externalities?
firms can decide how best they want to reach pollution limit, e.g. limiting production or buying green tech.
if firm breaks limit, tax issued can be ring fenced to tackle negPex
What are four disadvantages of using regulations and fines to tackle negative production externalities?
fines may not be big enough of a deterrent
firms may relocate to countries without regulations
costs incurred of monitoring firms emissions and dealing with legal appeals processes
firms may pass on tax to consumers in the form of price increases.
How does extending property rights help correct negative production externalities?
By assigning ownership of resources or pollution rights, firms are incentivized to internalize the externality, reducing harmful spillovers since they bear the cost of their actions.
How is extending property rights solving negPex shown on a graph?
Owner of the property charges the polluter to use the property = increase cost of production for the polluter (increasing private cost)
This will decrease the supply of the product (S1 to S2)
Overproduction reduced, market is now closer to the social optimum (Q2)
What is an advantage of solving negPex through extending property rights?
the external cost is eliminated as the polluter (chemical factory) no longer has access to the resource (lake)
the third party suffering from the pollution (the fishing club) is directly compensated by the polluter (chemical factory) by paying them for its use.
What are 3 disadvantages of solving negPex through extending property rights?
difficult for govt. to assign property rights
Costs incurred for owner of the property to monitor actions of others (polluting firms)
Legal costs involved in prosecuting a polluter could be extremely high which may deter victims from taking action.
How does the cap and trade system work?
A pollution cap is announced by the government
A number Pollution permits are issued to firms in an industry.
Some firms choose to lower their emissions in order to benefit from selling excess permits to other firms.
Some Firms also buy more permits from other firms to keep output the same, not reducing their own emissions
This reduces overall emissions.
What is the graph for solving negPex through tradable permits?
Overall level of emissions in the industry falls (not necessarily at an individual firm) = reduced external cost of producing = MSC reduced from MSC1 to MSC2.
What are some advantages of using tradable permits to tackle negPex?
market based solution. Each firm can choose how to meet the new emissions target.
The overall level of emissions fall but they are done in the most cost effective way.
‘Cleaner’ firms are rewarded and ‘dirtier’ firms are not excessively penalised, as long as they can buy excess permits.
What are 4 disadvantages of using tradable permits to tackle negPex?
High admin costs for both government and firms in monitoring emissions and ensuring these match number of permits held
Permits need to be taken out of the market regularly. If too slow = no incentive to reduce emissions as permits easily covers pollution
Fines need to be strict if number of permits do not match emissions. Too lenient/low = no incentive to reduce pollution as fines are easily afforded.
Carbon can be ‘offset’ which ‘reduces emissions’ but local population still suffer the same adverse impacts of pollutions.
Tree planted in 100 miles away do not help the population in close proximity of the firm emitting
What is a positive production externality?
A situation where the production of a good or service benefits third parties, leading to external benefits that are not reflected in the market price
e.g. technological advancements or R & D
What is the graph for positive production externalities?
Social Optimum = MSB= MPB
At FMA, firms only consider private cost, so underproduce
How can you correct positive production externalities through subsidies/ tax breaks? What is the graph?
provide subsidies to firms under the condition that they produce more solves market failure.
How can the graph for solving posPex be explained?
subsidy provides firm with additional finance= govt. reduces production cost for all extra units produced
firm increases production, s1 to s2→ mkt. failure reduced as quantity produced is closer to social optiumum
welfare loss to society is reduced.

What are 2 advantages to using subsidies to solve posPex?
offer of financial assistance incentivises producers to produce more
mkt. price of good falls, allows more consumers to afford product.
What are 2 disadvantages to using subsidies to solve negPex?
opportunity cost of govt. spending , increased taxation etc.
difficult to estimate extent of posPex, poor info about how much to subsidise
danger that subsidies may encourage firms to be inefficient, they rely on subsidy rather than improving efficiency.