Data Analysis - informatics
1/48
Earn XP
Description and Tags
Data Analysis - semester 1
Name | Mastery | Learn | Test | Matching | Spaced | Call with Kai |
|---|
No analytics yet
Send a link to your students to track their progress
49 Terms
Cross-sectional data
Data collected a single point in time from a sample.
Provides a snapshot of a social phenomenon.
Name an example of a cross-sectional data
World Values Survey
Representative sample
A smaller group chosen from a larger group population that reflects key characteristics
World Values Survey
a repeated cross-sectional survey
examines the evolution of social values
each country is represented by a representative sample of 1200 individuals
Observations
Numeric values, categorical codes, or scale scores representing variables of interest for a set of cases in a cross-sectional dataset.
metadata
adds meaning to data by describing it
provides descriptors such as variable names, labels, coding schemes, and measurement labels so it can be properly interpreted
microdata
data gathered from individuals
macrodata
data about social units
(countries, counties, organisations, etc)
Variable
A characteristic that varies between cases.
Can refer to facts, attitudes or social values.
Values
Numbers that represent a response category or response
Variable Name
should not be more than 8 characters.
should not have special characters.
String variable
Just text or text with numbers and signs
Numeric variable
A variable just with numbers
Numbers vs classifications
Number - number and values are the same
Classifications - the category receives a value
Technical use vs substantial use of frequency tables
Technical use - see which values and value labels the variable has
Substantial use - see how people distribute relative to variables’ values
Elements of a frequency table
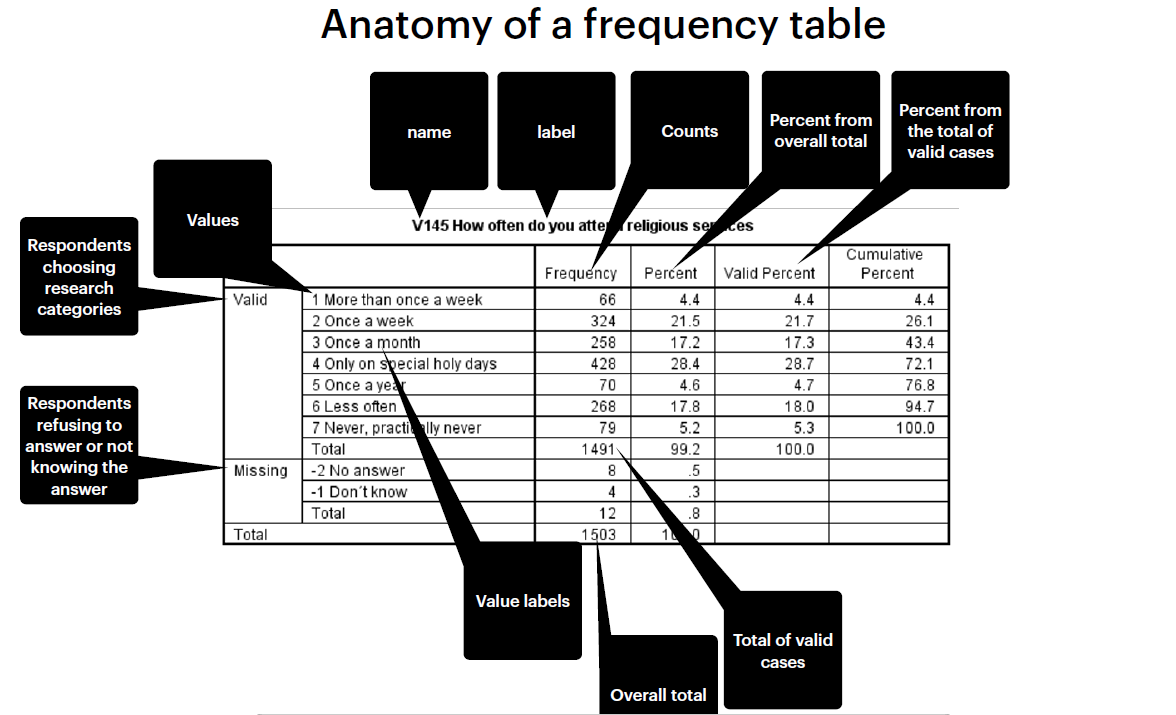
Valid cases
respondents giving a response to the substantial question
missing cases
respondents refusing to answer
frequency
number of cases for each value
percent
percent of cases for each value
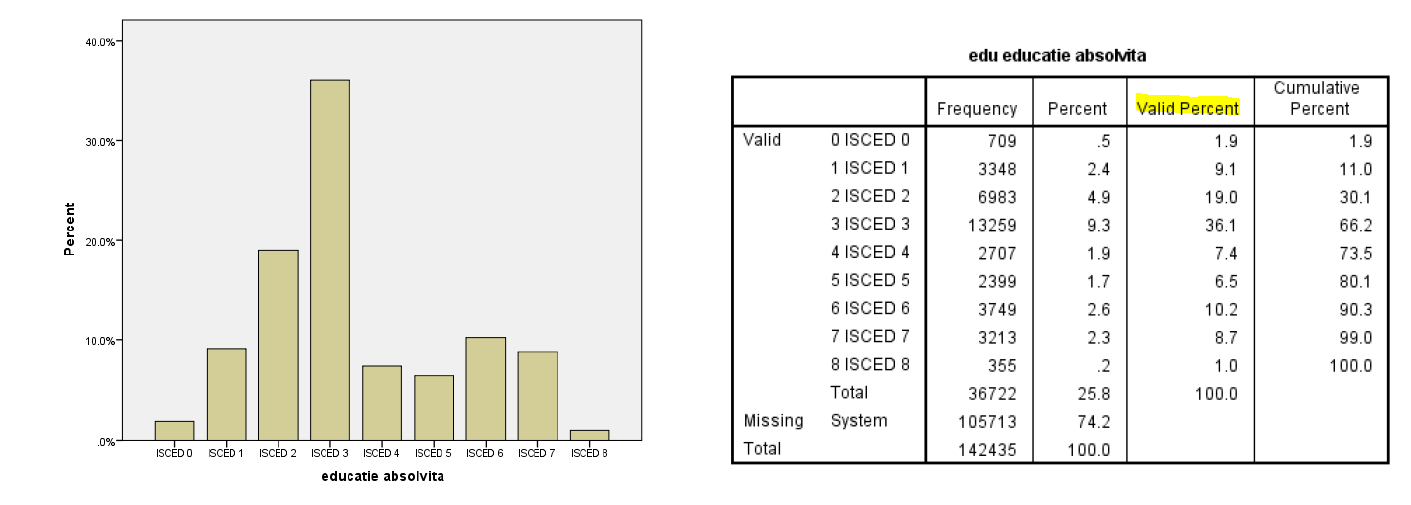
Valid percent
percentage for each valid value.
When the number of missing values is large, differences between percent and valid percent are high.
Cumulative percent
each percentage is added.
useful when values are ordered.
Technical use vs substantial use of a contingency table
Technical - see if filters are in place
Substantial -See how one variable is associated with another, where one is considered dependent (outcome) and the other independent (predictor).
Contingency Table
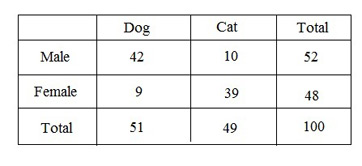
independent variable
the variable you change to see if it has an effect on the dependent variable
Concepts
Concepts are abstract terms used to describe
characteristics of social units, such as gender roles, work ethic, religiosity, progressive values, and more.
Single-item scale
closed questions.
respondents are asked to select one or more choices appropriate to their situation to a SINGLE variable
Multi-item scales
closed questions.
asked to select one choice appropriate for their situation to at least two variables.
Recoding the variable
creating a new variable by modifying an EXISTING one (e.g collapsing categories, reversing the scale, changing values)
Computing a new variable
summarising a multi-item scale by creating a NEW single variable.
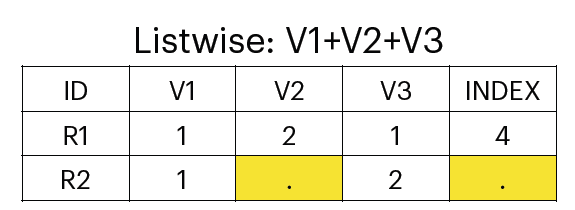
Listwise
if a case has missing values, it is ignored when computing the sum of variables or the mean of variables.
less valid cases.
more missing cases.
better than pairwise.
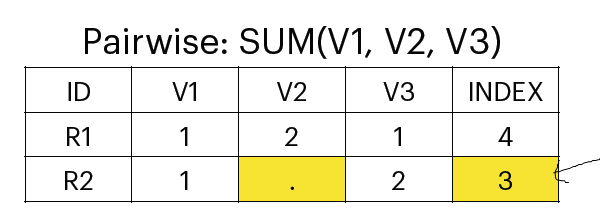
Pairwise
if a case has missing values, we will not ignore it.
more valid cases.
less missing cases.
better when the number of cases available for analysis is very low.
Bar Chart purpose
used to display a distribution of a categorical variable or to represent a metric variable with multiple distinct values.
Bar Chart x-axis and y-axis
x-axis - categories or groups being described
y-axis - numerical values or frequencies
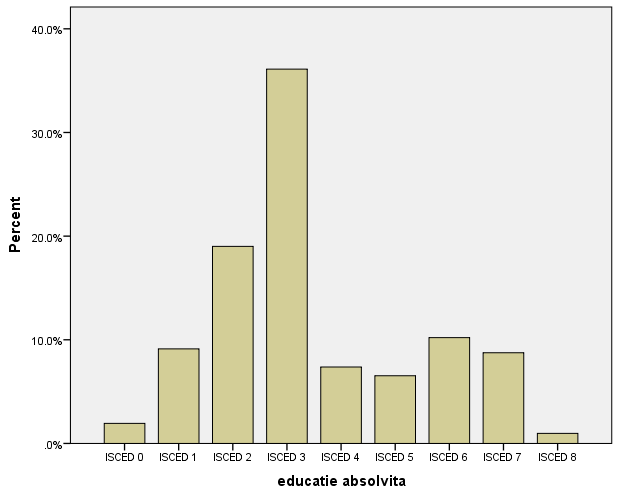
What does a bar chart represent from a frequency table?
Valid Percent
Histograms vs bar charts
Histograms visualize quantitative data or numerical data, whereas bar charts display categorical variables
bar chart - COMPARING and displaying data across different categories, categorical data, bars do not touch
histogram - good for continuous data, numerical data, bars touch
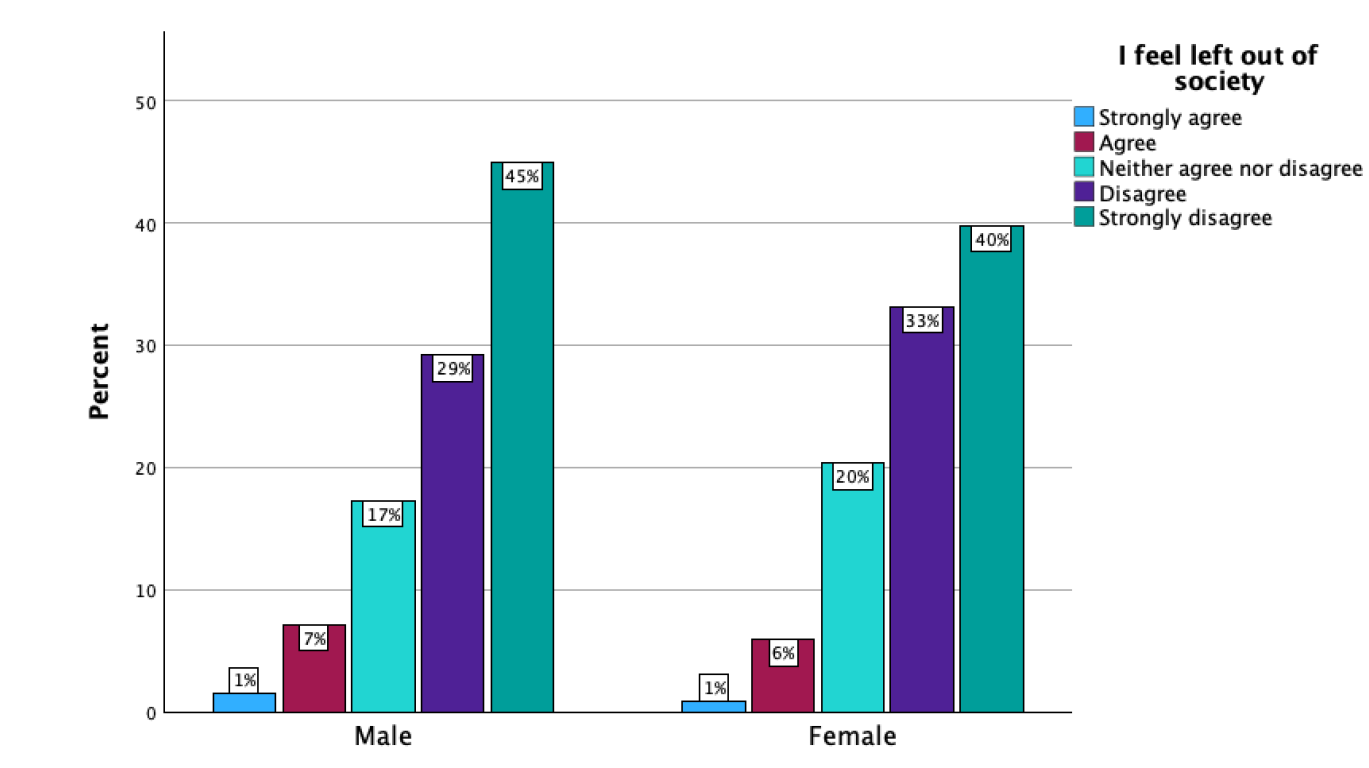
Clustered bar chart purpose
to visualise a contingency table with percentages within one of the variables.
shows subcategories.
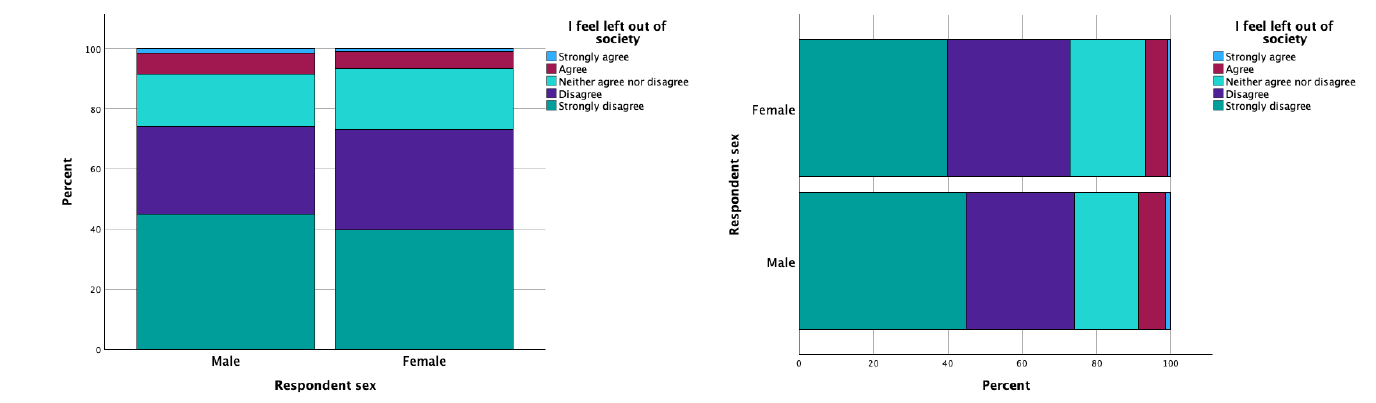
Stacked bar chart
the same as a clustered bar chart but the bars are stacked on top of each other
nominal data
categories with no order
e.g. gender, ethnicity, religion
use: frequencies, percentages, bar charts
ordinal data
logical order
e.g. educational level, social class
use: frequencies, percentages, median
scale data (interval/ratio)
numeric
e.g. age, income, hours worked
use: mean, median, standard deviation, histograms
frequency
raw count (how many)
percentages
frequencies converted out of 100
cumulative percent
adds percentages progressively (should end at 100%)
doesn’t work for nominal data
bar chart
nominal or ordinal
separate bars
compares things at one point in time
histogram
scale data
bars touch
percent used for missing data
valid percent
what does valid percent exclude?
missing values
frequencies table
how often each response occurs