macro u2 test
1/65
There's no tags or description
Looks like no tags are added yet.
Name | Mastery | Learn | Test | Matching | Spaced | Call with Kai |
|---|
No analytics yet
Send a link to your students to track their progress
66 Terms
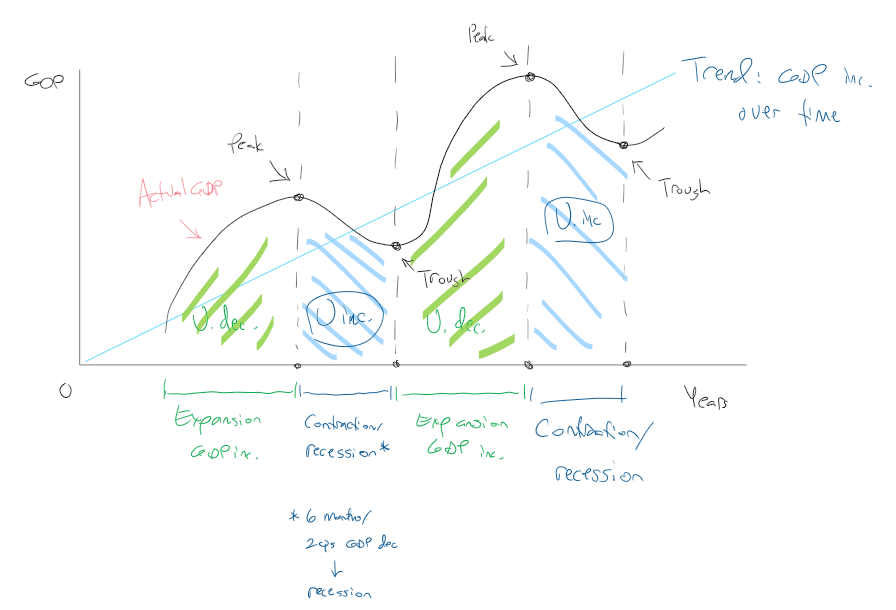
how does the cycle of GDP work
recessions and expansions over time, recessions every 6ish years
GDP nominal
current output and current prices, not adjusted for inflation
the price and quantity of each good added together (current price and current quantity)
GDP real
adjusted for inflation, uses constant price (starting from base year)
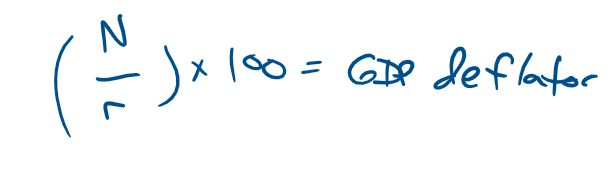
GDP deflator
removes inflation from the equation to give better prediction of GDP
N is nominal GDP, r is real GDP
the base year will always have a value of 100 for the deflator.
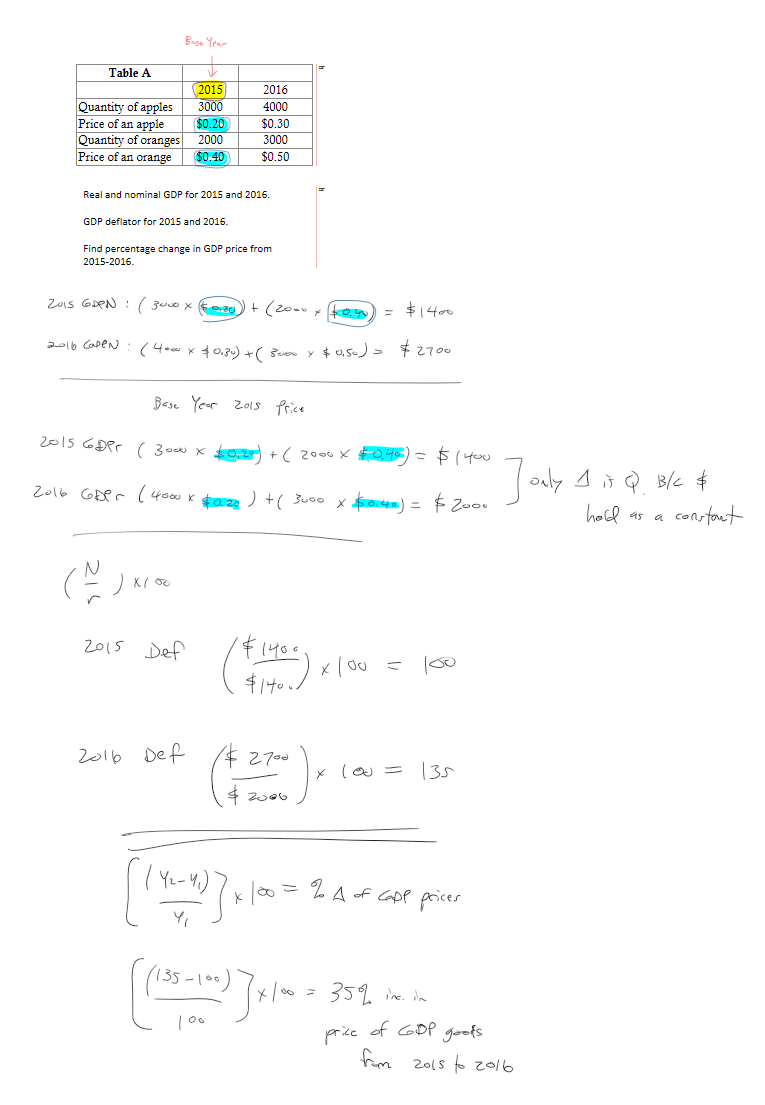
percent change formula
new-old/old x 100
practice problem using this information
civilian, non-institutional adult population
anyone in the US except for peopel under 16, people in the armed forced, and people whoare institutionalized
civilian labor force
subtract the retired people, homemakers, full time students over 16, and those not looking for a job “discouraged” from the civilian non-institutional adult population
you are left with:
Employed Full Time or Part Time, counted during the week of the 12th of the month. Employed unpaid workers in family businesses, if working over 15 hours in that business. Those on sick leave, on strike, or on vacation during the week of the 12th of the month. Unemployed because they are actively looking for work but can't find work, or are waiting for better careers, or seasonal changes.
healthy vs. unhealthy employement rates
0-3% unemployed is overextended
4-5% is healthy
6+ is unhealthy
labor force participation rate
the participation rate is the percentage of the population that is either working or actively looking for work
frictional unemployment
a normal thing that happens when you are leavign a job and looking for another
structural employment
mismatch between the skills that workers in the economy can offer, and the skills demanded of workers by employers
cyclical unemployment
due to recessions, etc. not normal and bad news!
natural rate of unemployment
friticional + structural
actual rate of unemployment
frictional, structural, and cyclical combined
unemployment rate formula
number of unemployed/number in the CLF
labor force participation rate formula
CLF/pop total
CPI
Consumer Price Index measures the average change over time in the prices paid by consumers for a FIXED "market basket" (what you are buying and the costs) of goods and services. Calculates inflation rates
base year CPI is always 100 because its the point of reference
measures inflation
in order to calculate the value of a market basket, one must
set the quantities constant using the base year as the reference point
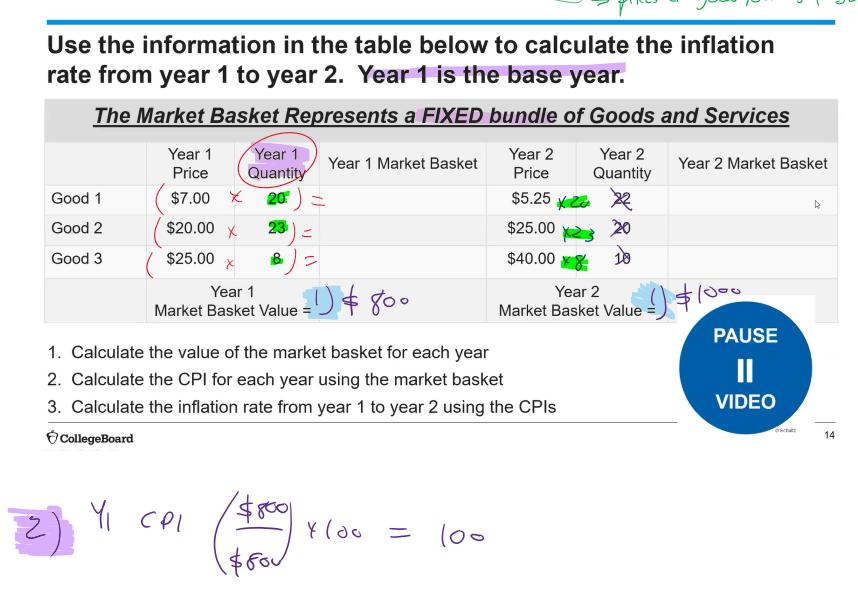
how do you calculate CPI
use the market baskets, then divide the current year by the base year and multiply by 100
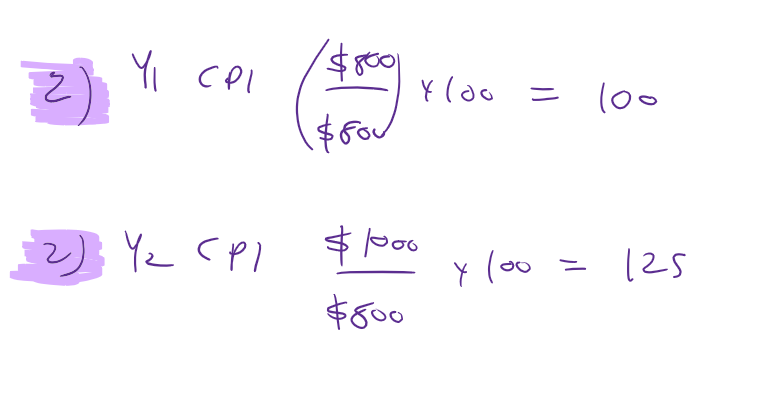
inflation calculation
use the CPIs to plug in to new-old/old x 100
GDP
gross domestic product
4 parts: C, Ig, G, Xn
C
personal consumption in the economy
finished goods and services except for houses
Ig
gross private business investment monies
factory stuff, house construction, unsold inventory of products built in a year
G
government spending: schools, roads, police, etc.
gov. purchases of products and services
Xn
net foreign factor of trade: exports minus imports
typically a negative number
what doesn’t count in GDP
used goods
gifts or “Transfers” (private or public)
stock purchases
unreported business activities, illegal activies
financial transactions b/t banks and businesses (loans)
volunteering, family work, babysitting in cash
income approach to GDP: W+R+I+P+SA
wages: money earned by workers
rent: money earned by those who lease land/structures
interest: money earned by those who lend savings to firms and governments
profit: money earned by firm owners that is not paid out in wages, interest or rent
the income approach does not match the other approach, so how do we adjust it
-depreciation
-Businesses set aside money (spending) of their own to account for declining value of goods such as equipment. This is a loss of income to them.
-business taxes (sales tax)
When a consumer buys dinner at a restaurant, they pay sales tax. All of the money paid counts towards GDP when using the expenditure approach. But the restaurant does not keep the sales tax, instead passes it along to the government. This is a loss of income to the business.
-Net foreign income -
If foreigners earn money in the US (savings account, investments) that money leaves the US so does not represent an increase in income in US GDP. If US citizens earn money from investments in foreign places, then money flows into the US.
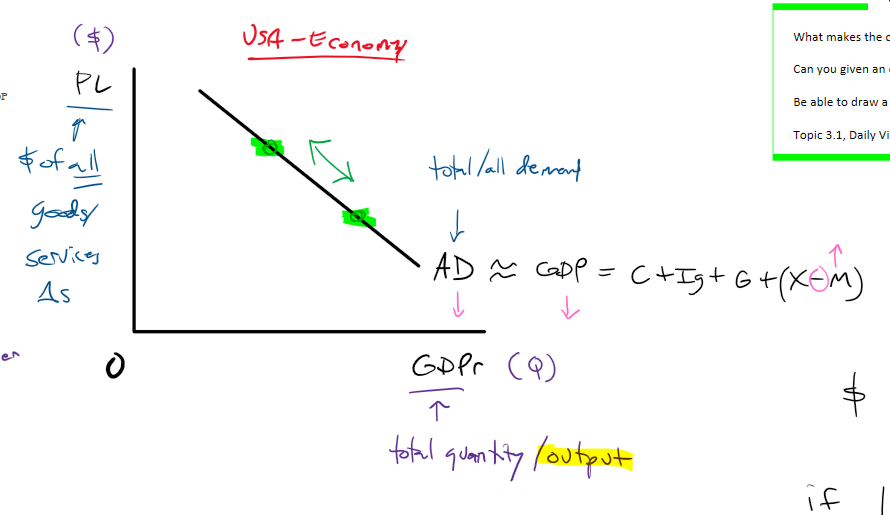
why is the AD (aggregate demand curve) downward sloping
real weath effect, interest rate effect, exchange rate/foreign purchases effect
these are all shifts ALONG THE CURVE
real wealth effect
-When price level rises, purchasing power of money decreases, so fewer goods purchase; movement up AD curve (vice versa is also true)
interest rare effect
-When price level rises, people demand more money (to buy they things they need) so interest rates rises; this makes buying goods (with borrowed money) more expensive, so fewer goods are purchased; movement up AD curve (vice versa also true)
exchange rate effect
-When price level rises, people look to buy cheaper foreign goods as a substitute, which decreases the quantity demanded of domestic goods; this is a movement up the AD curve (vice versa also true)
AD on a graph
what shifts the AD curve
GDP (c ig g xn)
shifters of C
Wealth: (owned: financial, real assets)
-more wealth = buy more G/S = C inc.
Income (earned: wages, salary)
-more income = buy more G/S = C inc.
Income taxes (govt takes)
-taxes dec = more income = buy more G/S = C inc.
Expectations of economic conditions (worry or hope)
-positive outlook of future = buy more G/S = C inc.
Consumption based upon borrow dollars
-based upon an interest rate (ir)
-cars, college education, appliances
-ir falls = such G/S cheaper = more purchased = C inc
-ir rises = such G/S expensive = less purchased = C dec.
shifters of ig
Spending on:
-non residential investment: machines, assembly lines of firms, factory production
-residential investment: buying new homes
-business inventories: goods on hand to sell
What makes these (above items) change?
-Expectation of future
-improvement/positive = more spending on capital = Ig inc.
-Interest rates (ir)
-fall = less expensive to buy capital = more spending = Ig inc.
-Unplanned changes in inventories (products being made)
-decrease in products on hand = more capital spending to produce more = Ig inc.
shifters of G—fiscal policy
changes in taxation (decrease in taxes means AD will go up)
changes in gov. spending (increase in spending means AD goes up)
shifters of G-federal reserve
lower interest rates = higher AD and vice versa
net exports shifters (exports minus imports, or X-M)
-Relative prices
-Real GDP in Japan inc = Japan income inc. = US exports to Japan inc.
-Relative incomes:
-Price level in US falls compared to Germany = US exports to Germany will inc because US exports cheaper relatively speaking
-Exchange rates:
-US dollar appreciates against India Rupee = US exports to India will dec because US exports more expensive relatively speaking
Exports and AD: positively related, Imports and AD: inversely related
sras
short-run aggregate supply
a condition where wages and input costs have not adjusted to the price level
change in quantity of SRAS (movement along curve)
usinesses prefer to set/fix prices as much as possible
-often done through multi-year contracts, agreements
-employee wage contracts
-lease / rent agreements for factory
-fixed contract for commodity price (corn, diesel fuel, steel, etc.)
-this allows them to maximize profit
-makes them competitive when market price level (price people willing to pay) changes
Profit = price level - inputs costs
adjusting how much a firm is producing is movement along the curve
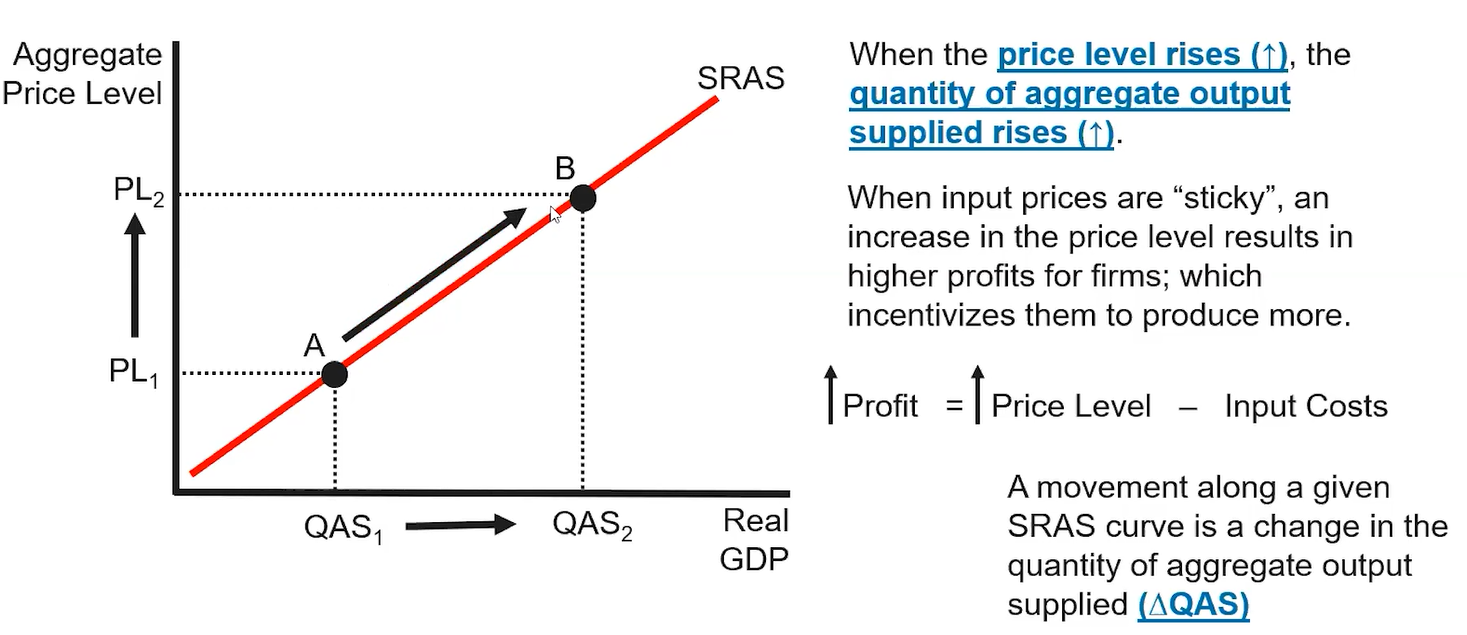
price level and its relationship to SRAS
when the price level falls, less quantity supplied, and vice versa
producing more output means hiring more workers-> shift up along the curve
what happens that shifts the SRAS
input prices
productivity
government policies
inflationary expectations
what shifts curve to the right
anything that makes it cheaper or easier to produce things
decrease in input costs, commodity prices (energy!!!), wages
increase in productivity (technology)
government policies: deregulation and subsidies
what shifts curve to the left
increase in input costs
destruction of resources
gov. policy (regulation increases or taxes)
LRAS
vertical curve measuring full employment and the natural rate of unemployment
all input prices have fully adjusted to change in price level as opposed to SRAS
Yf = value of output
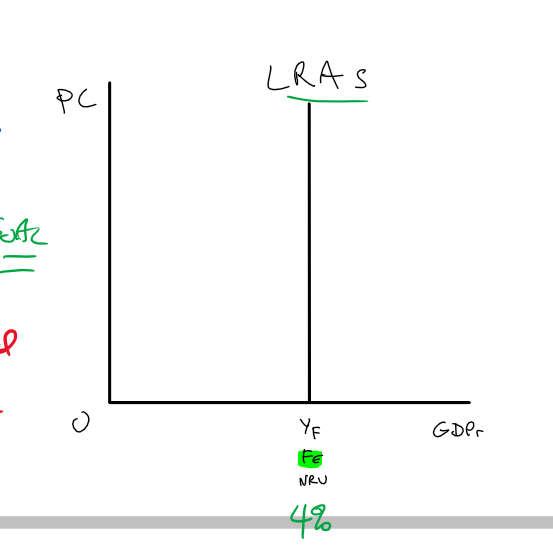
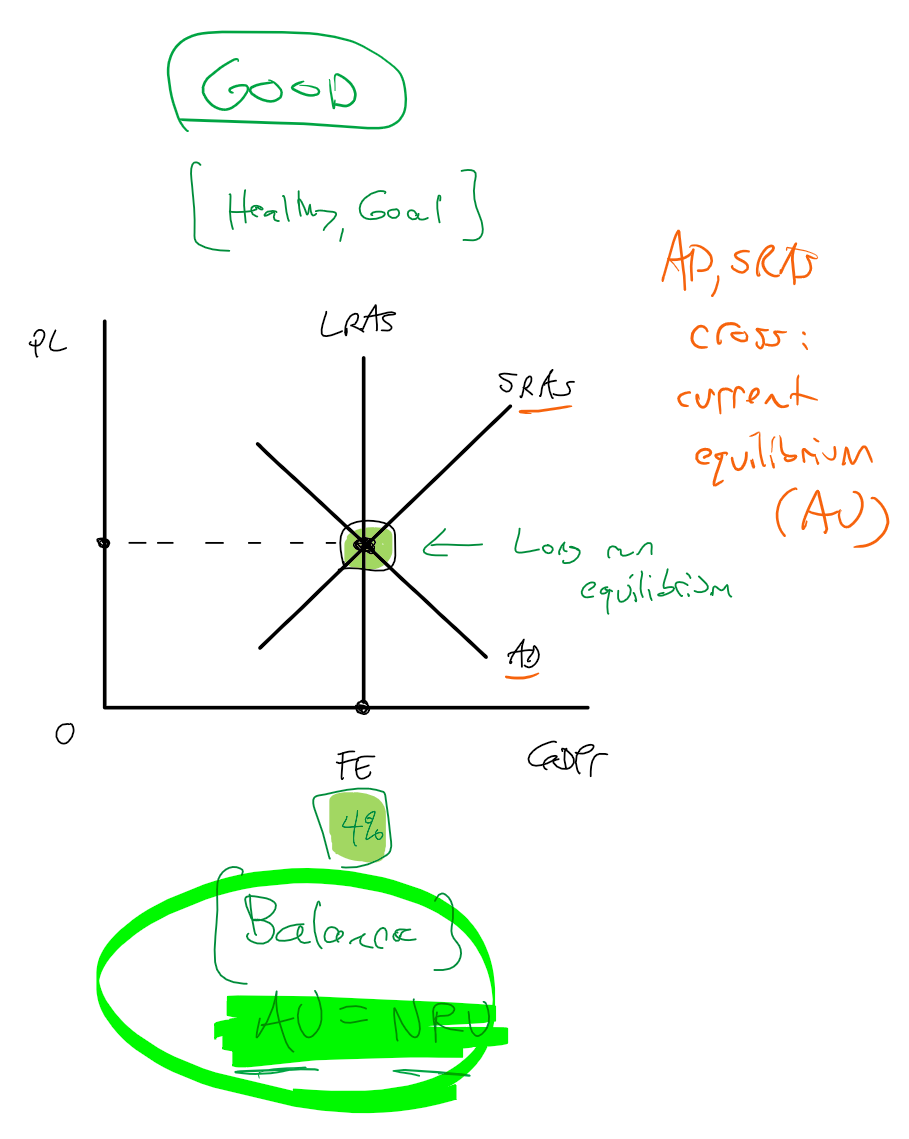
good LRAS
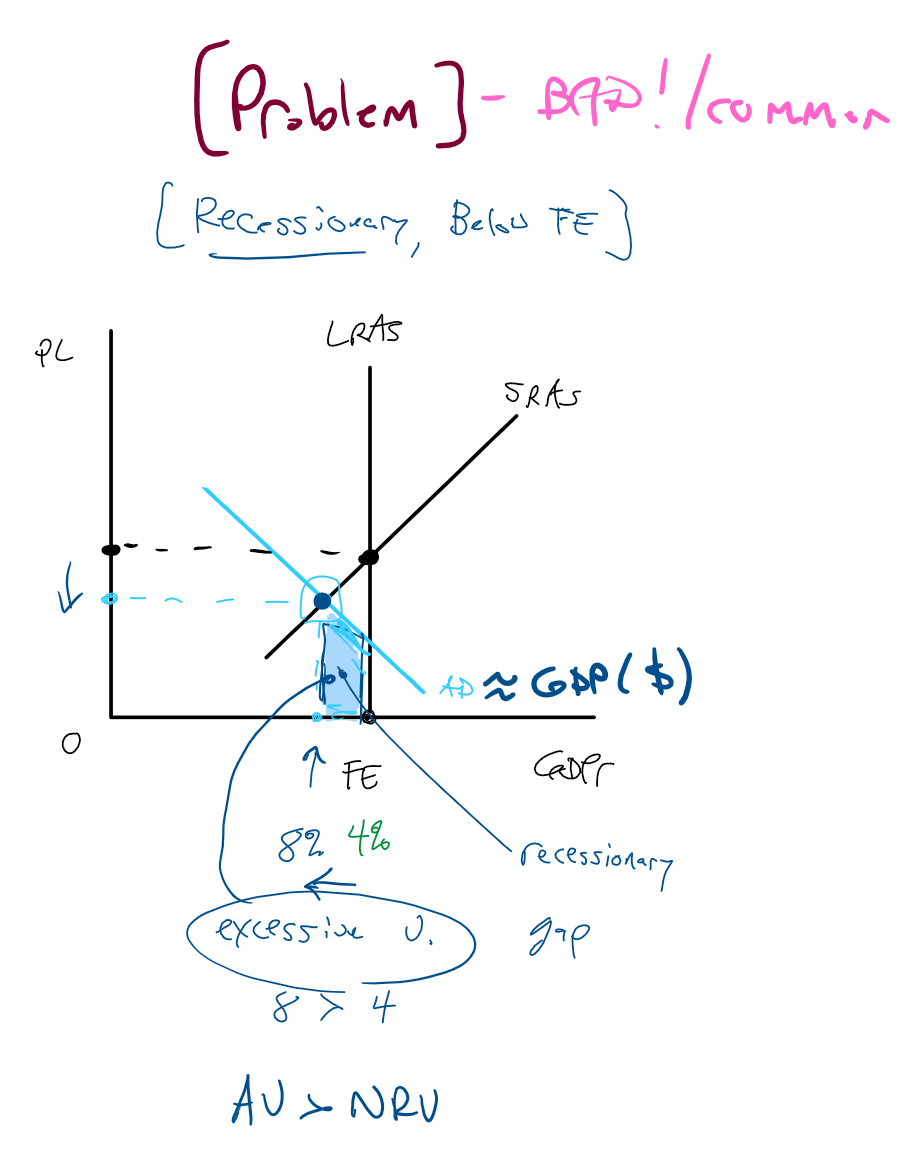
recessionary LRAS
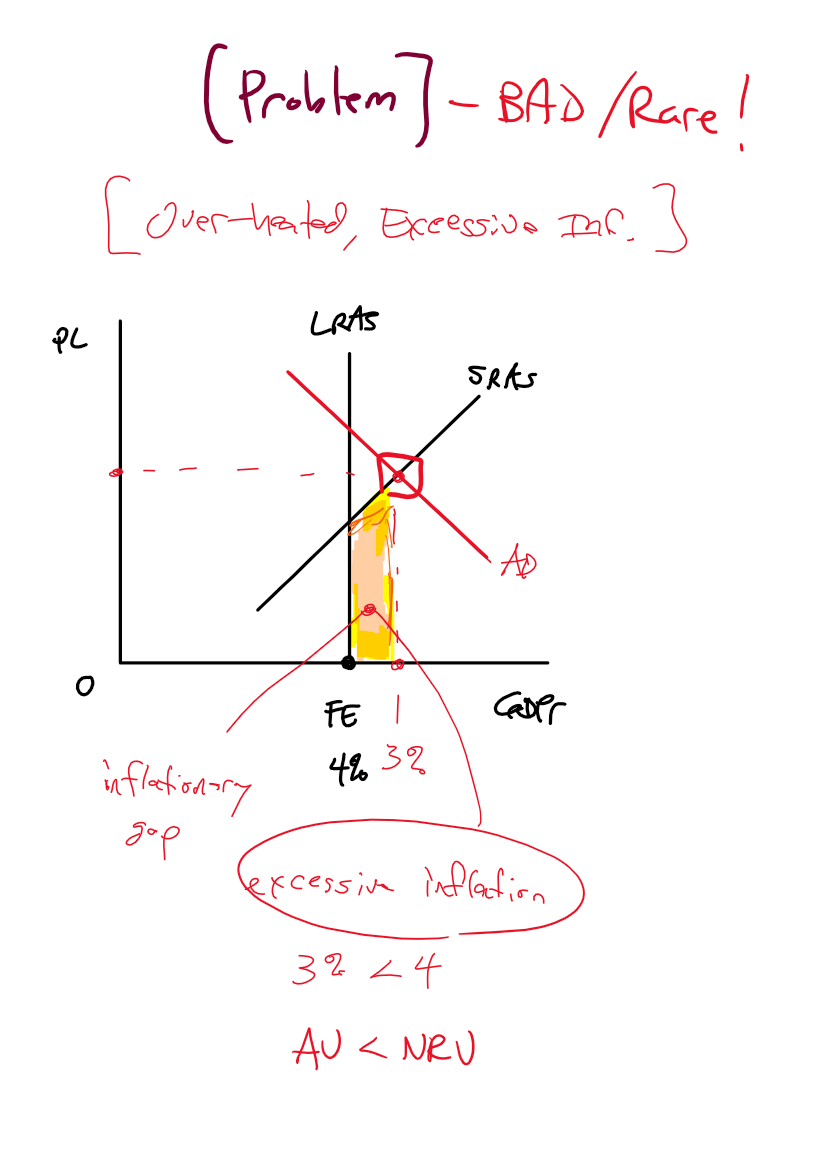
excessive inflation (rare) LRAS
what is fiscal policy
actions taken by gov. to fix excesses in the economy when there is too much inflation or unemployment
two groups: congress and federal reserve bank
Goal: to speed up or slow down the economy (as needed)
-moving money into or out of the hands of consumers, producers
-moving money into or out of the banking system
congress fiscal policy
-taxation (inc. or dec.) -- money put into or out of the hands of consumers
-changing paychecks!
-also includes taxes on businesses
(paychecks change) C
-also business taxes Ig
-government spending (inc. or dec.) -- money into the economy
-Congress can approve building projects, stimulus checks, job programs, etc. -- G
-moving money into the economy
if there is a recession what is an action for fiscal policy
-decrease taxes (larger paychecks for consumers, lower business taxes for producers)
-less money given to government = more money left in hands of C and Ig
-more money spent = C inc, Ig inc. = GDP / AD inc.
AD curve shifts to the right, closer towards FE / LRAS
-increase government spending (spending programs, money sent to people, businesses) G
-money moved from government G into the economy
-G inc. = GDP / AD inc.
AD curve shifts to the right, closer towards FE / LRAS
expansionary fiscal policy
actions by Congress to expand GDP, counteract a recession
contractionary fiscal policy
-actions by Congress to decrease GDP, counteract excessive inflation
automatic stabilizers
-policies already in place to help the economy
-created by previous legislation
-no further vote / action need by Congress to enact the policies
-kick in, start working automatically
Taxes (on consumers and businesses)
Unemployment insurance (money for jobless)
Temporary assistance (money to help meet basic needs)
Stabilizers act as expansionary and contractionary fiscal policies
discretionary policies
-need Congress to vote
-larger, more significant changes
-change in tax rates
-spending program bill
DI = C + S
DI: disposable income (money people earn or ahve)
C: consumption, spending
S: savings money not spent
circular flow diagram, injections, leakages
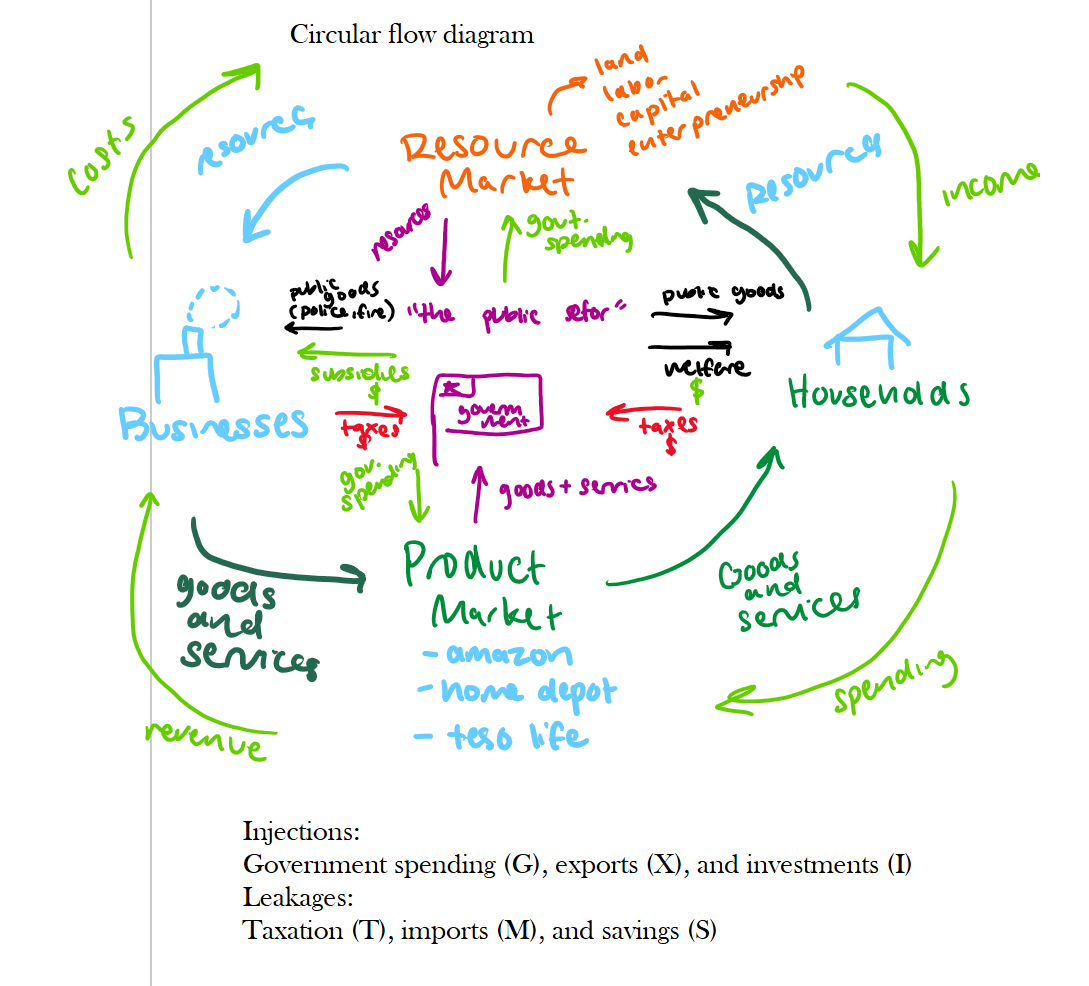
new DI =
MPC + MPS
1 = MPC +MPS
--what is done with new / change in income / marginal
--portion spent and portion saved
--you can only spend 100% of each new dollar amount given
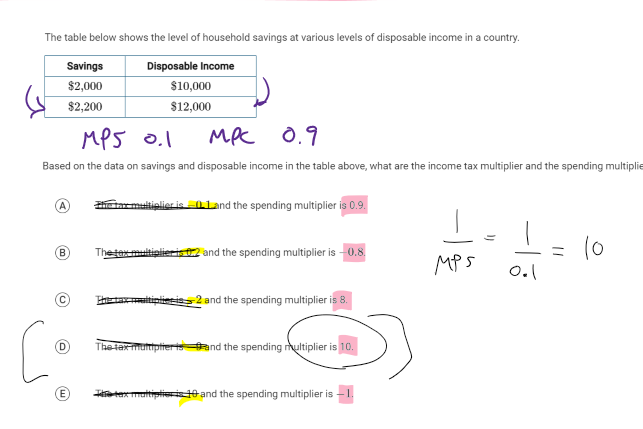
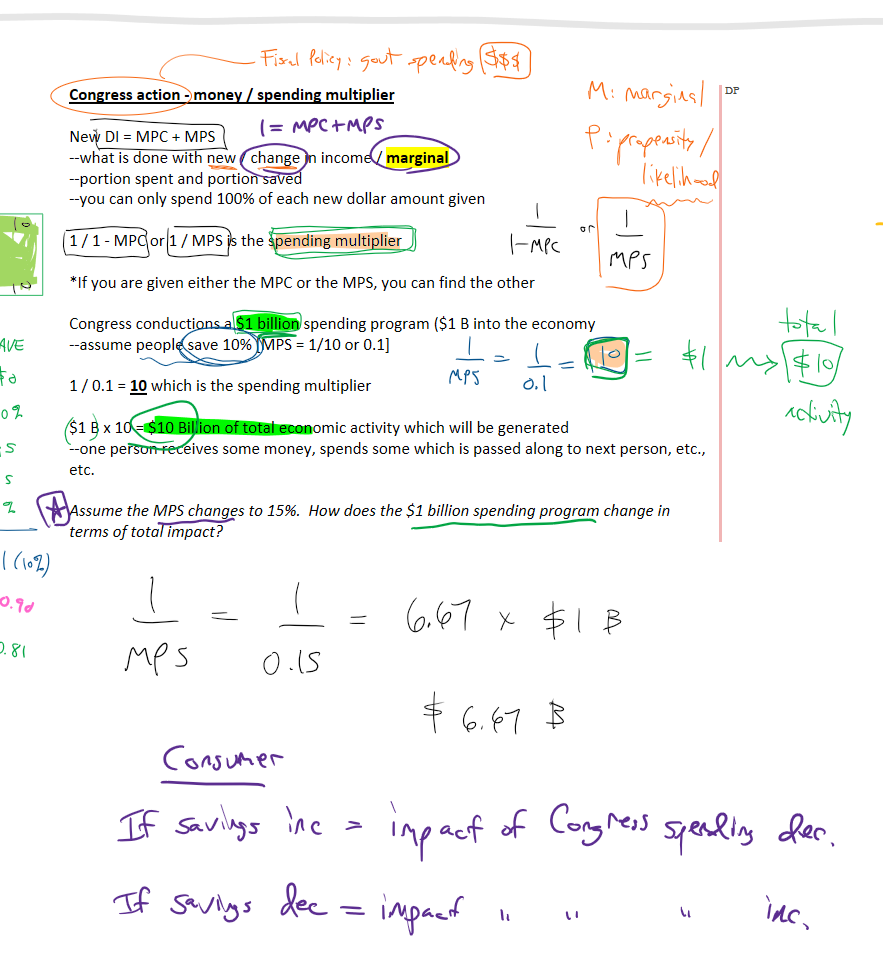
spending multipier
1 / 1 - MPC or 1 / MPS is the spending multiplier
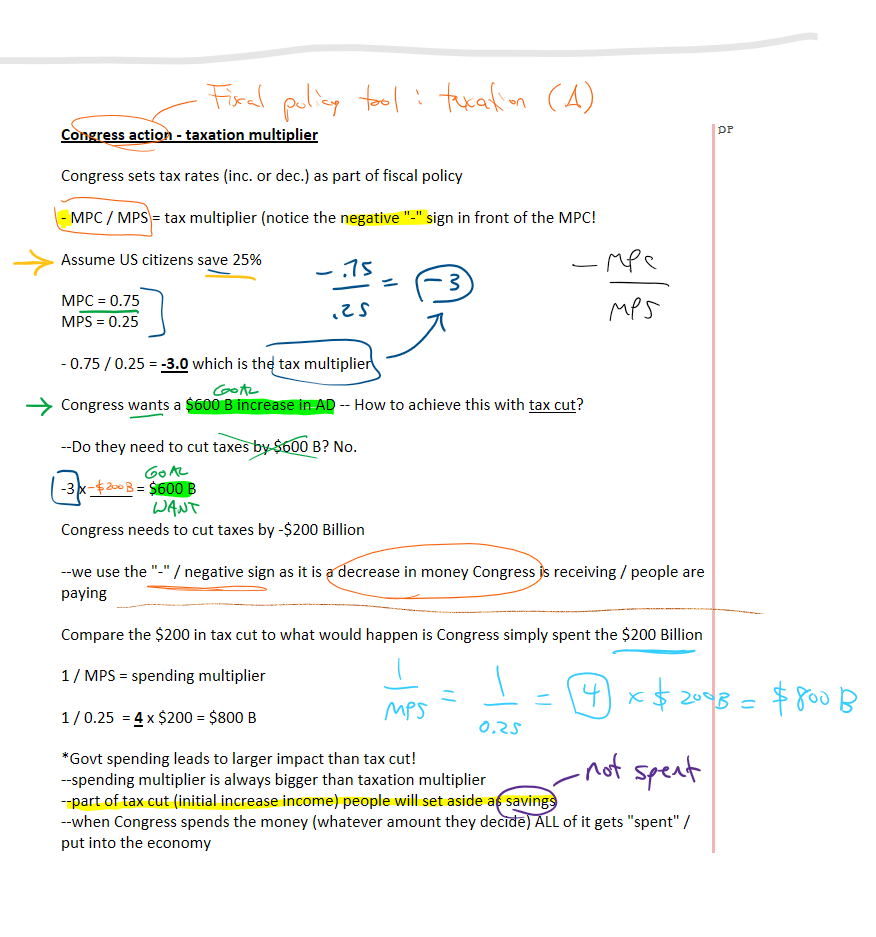
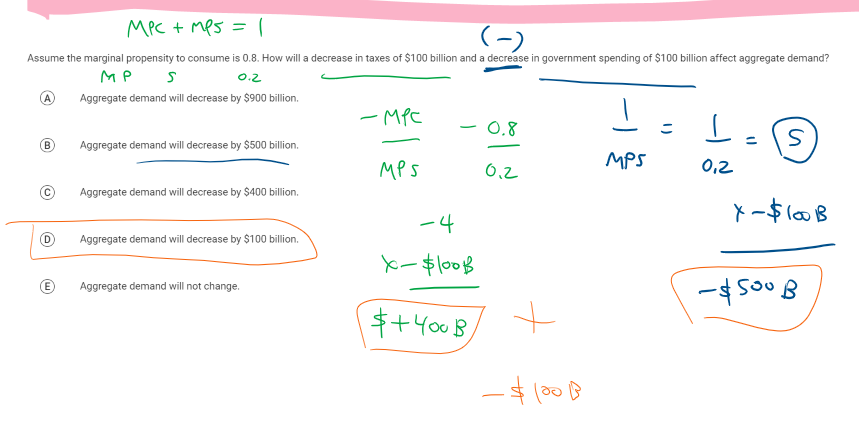
taxation multiplier
spending multiplier
practice problem
practice problem
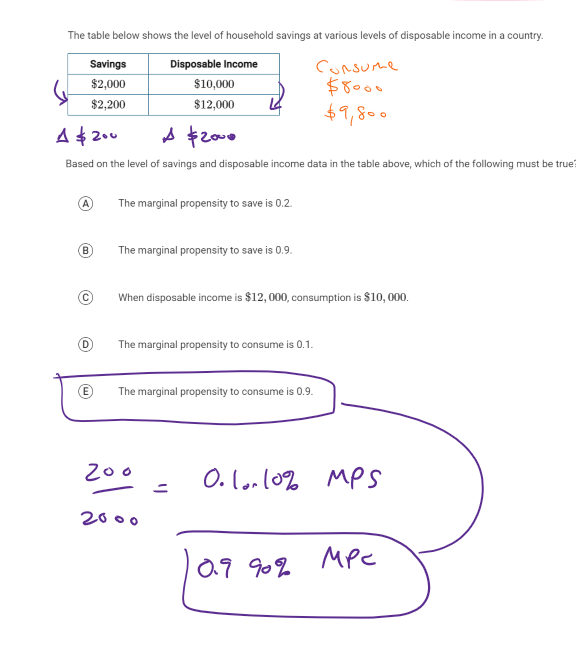
practice problem