lec 23 - applications of PK/PD modeling in drug discovery and development (wang)
1/27
There's no tags or description
Looks like no tags are added yet.
Name | Mastery | Learn | Test | Matching | Spaced | Call with Kai |
|---|
No analytics yet
Send a link to your students to track their progress
28 Terms
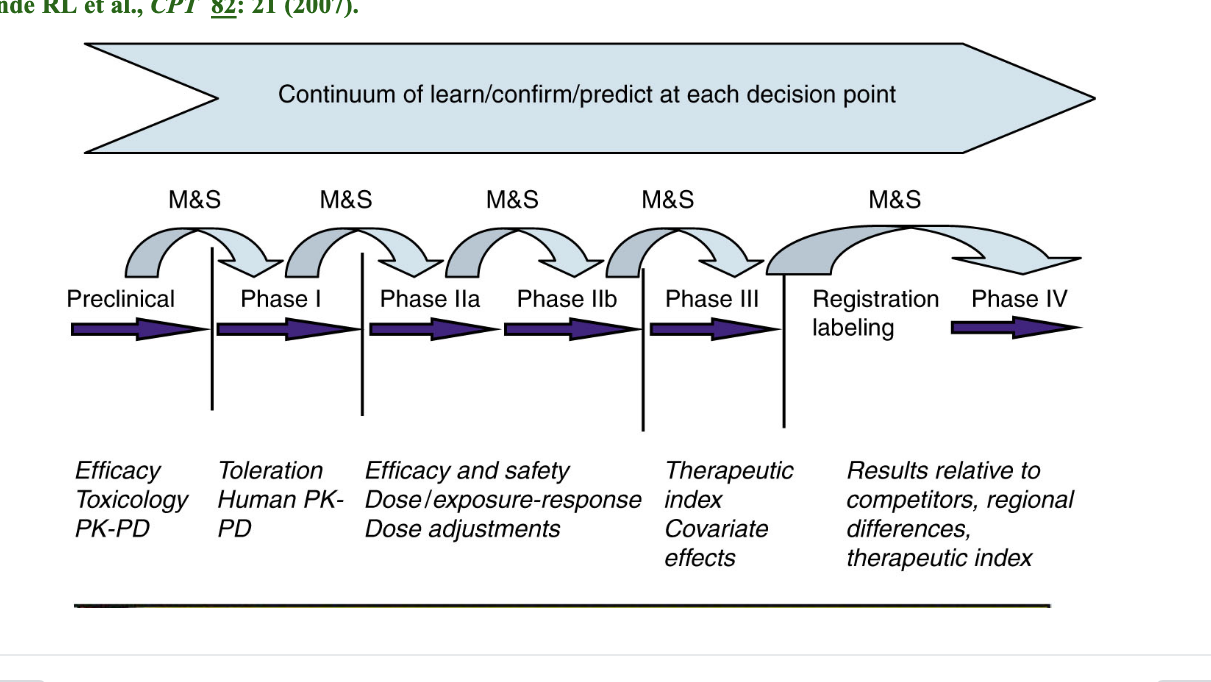
model informed drug development learning and confirming
M&S = modeling and simulation → performed before each decision point to quantitatively assess risk in moving forward
preclinical
efficacy
toxicology
PK-PD
phase I
toleration
human PK-PD
phase IIa/IIb
efficacy and safety
dose/exposure-response
dose adjustments
phase III
therapeutic index
covariate effects
registration labeling/phase IV
results relative to competitors
regional differences
therapeutic index
PK and PD
PK = quantitative analysis of the time-course of a drug in the body
ADME
what body does to drug
PD = quantitative analysis of the time course of a drug effect
onset
duration
intensity
what a drug does to the body
possible PD endpoints
target engagement
target-mediated signaling pathway (gene/protein expression)
cell proliferation/apoptosis
tumor growth
disease score
symptom
PK/PD pt 2
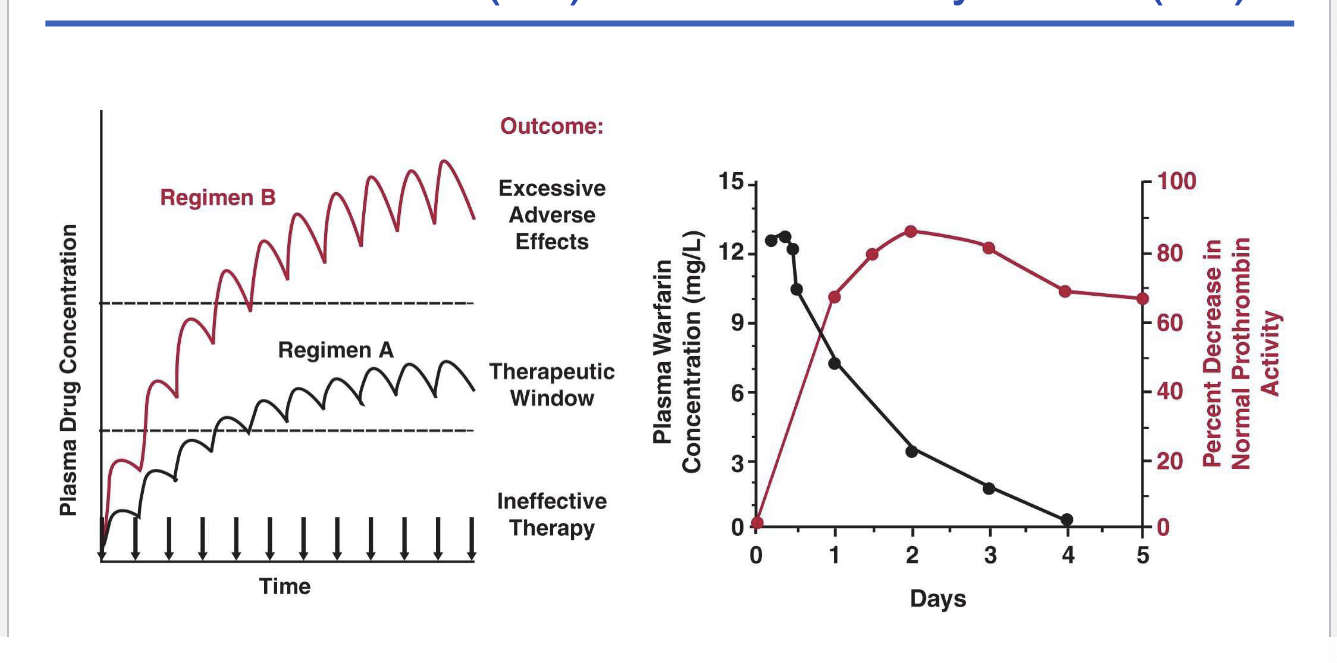
left graph
regimen A = therapeutic window
regimen B = excessive adverse effects
right graph
plasma warfarin concentration vs perfect decrease in normal prothrombin activity
as warfarin plasma concentration decreases there is a greater decrease in normal prothrombin activity
delayed effect (?)
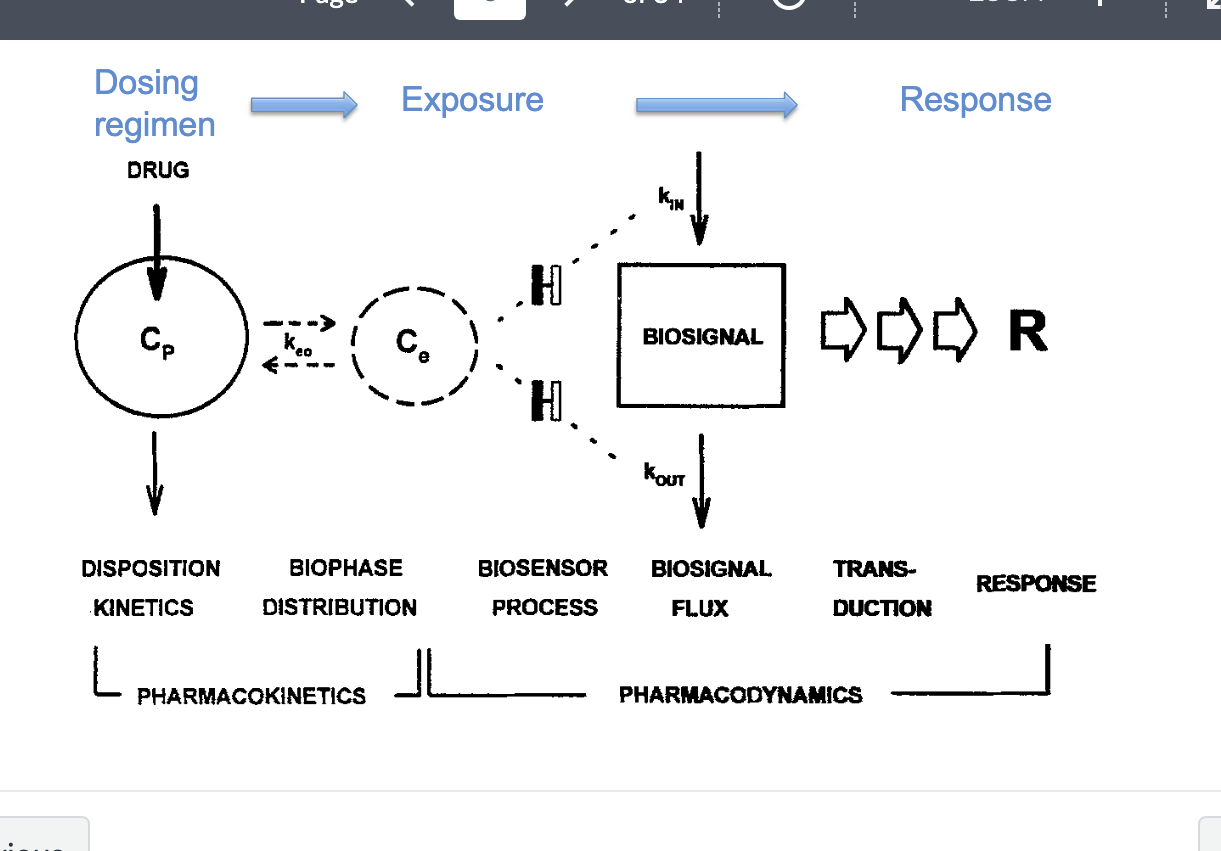
PK/PD pt 3
PK
disposition kinetics
dosing regimen → Cp = plasma concentration of drug
biophase distribution
Ce = effect site concentration → linked to keo (rate constant describing how quickly Cp equilibrates with Ce)
exposure
PD
biosensor process
drug binds to receptor or target leads to → biosensor activation
biosignal flux
generated by kin (rate of biosignal production) and kout (rate of signal loss/degradation)
how quickly the system reacts to drug presence
duration of action and signal delay
transduction
biosignal is translated into a response
response
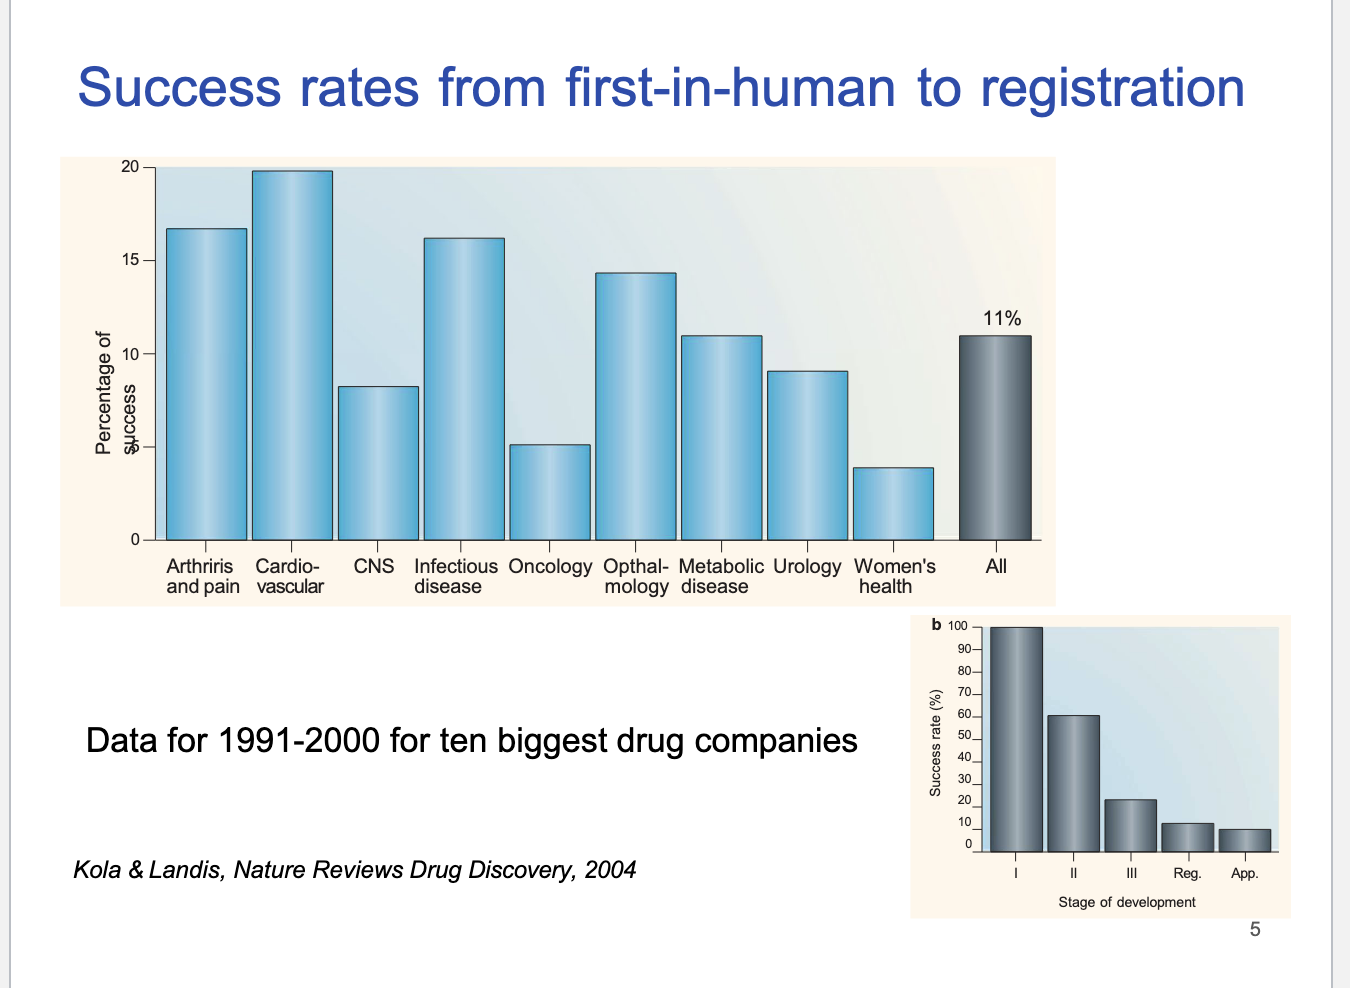
success rates from first-in-human to registration
CV drugs had highest success rate
CNS/oncology = low success rates
overall industry average success = 11%
1991-2000 success rate
most success in phase I
downward trend
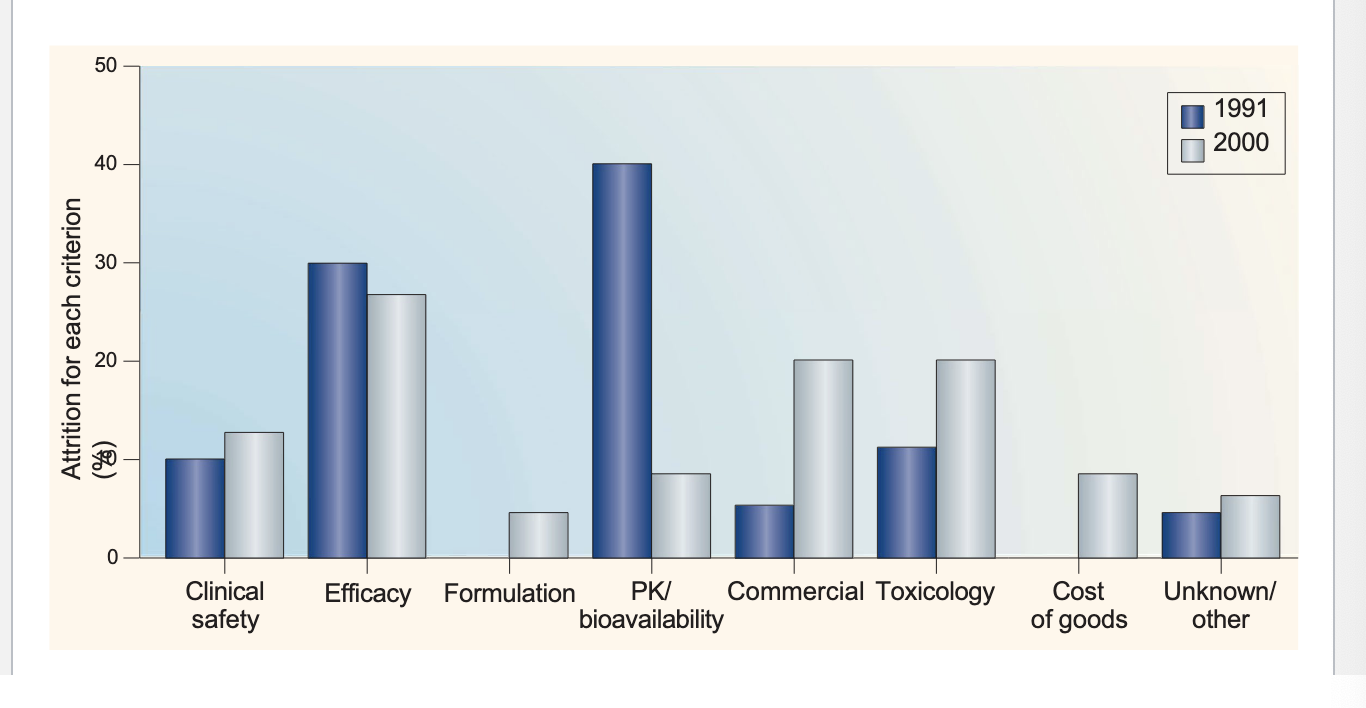
reasons for attrition (loss)
in 1991 → biggest reason = PK/bioavailability
→ smallest reason = formulation
in 2000 → biggest reason = efficacy
→ smallest reason = formulation
drug development and the FDA
preclinical testing
investigational new drug application (IND)
approval for clinical trials
phase 1 studies
phase 2 studies
phase 3 studies
new drug application (NDA)
preclinical testing
pharmacology
in vitro and in vivo pharmacology studies
drug metabolism and PK
toxicity
2-4 week studies in 2 animal species after multiple dosing
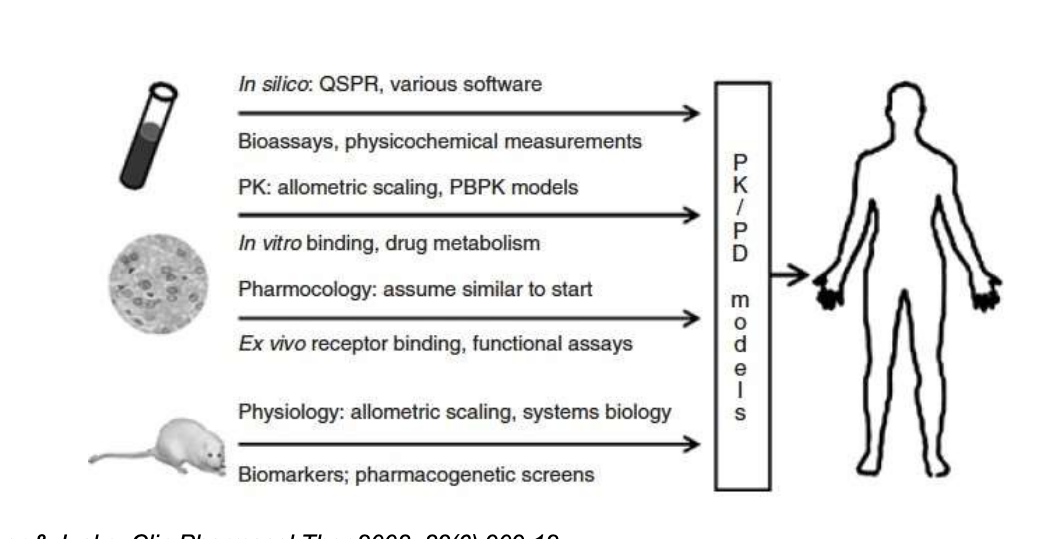
multi-scale modeling informed discovery and development
PK/PD time profile in animals
predicts human efficacious dose prior to phase I
integrates in vitro evidence with in vivo preclinical data
TK (toxicokinetics) modeling to assist dose selection int eh toxicity study in animals
phase 1
dose levels predicted based on preclinical studies
first-in-human study
healthy volunteers (or patients with target disease)
20-80 subjects
short duration
maximal tolerated dose, adverse events
determine PK parameters in humans — dose proportionality
unblinded, uncontrolled
usually NOT evaluating for efficacy; efficacy assessed for oncology drugs
refine the human PK/PD model using the observed human data
model the additional biomarker data in phase 1 trial
model-based dose selection for phase 2 trial
phase 2
evaluating efficacy
dose-response
patient with target disease
several hundred subjects
several months
double blind, placebo controlled
double blind = neither participants nor the researchers know who gets treatment vs placebo
adverse events, PK
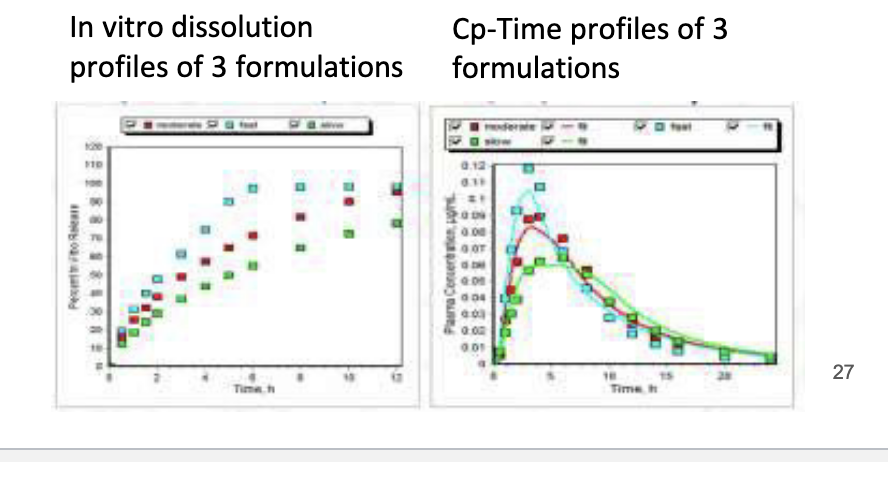
formulation and dose-dependent food effect prediction
predicts how different formulations and food intake affect drug absorption
drug-drug interaction prediction
special population predictions (peds, organ impaired population, etc)
modeling and simulation to analyze all exposure-response relationship and explore dose choices for phase 3 study
identify co-variates effects E-R (exposure-response)
co-variates = pt factors that influence drug response such as
age, weight, sex
genetics
kidney/liverfunction
phase 3
evaluating effectiveness, risk-benefit
patients with target disease, more diverse population
1000s of subjects
several years
double blind, placebo controlled, active control, randomized
active control = trial drug vs existing standard treatment
adverse events, PK, dosing intervals, drug-drug interactions, drug-disease interaction
most expensive stage of drug development
population PK and PD
collection of relevant PK/PD info in patients who are representative of the target population to be treated with the drug
ID and measurement of variability during development and evaluation
explanation of variability by identifying factors of demographic, pathophysiological, environmental or concomitant drugs
phase 4
after NDA approval
monitoring ongoing safety in large populations
pts with target disease
1000s subjects
several years
uncontrolled, observational
epidemiologic data, pharmacoeconomics
special population predictions (preggo, asian)
predict PKPD with new formulations
compare results in competitors
types of PK studies
single/multiple dose
mass balance (ADME)
bioavailability/bioequivalence
food effect (for oral formulations)
special populatons
male, female
pediatric, elderly
renal or hepatic impairment
drug-drug interactions
QTc prolongation
mass balance studies
study that tracks the entire fate of drug using radiolabeled compounds
commonly use radiolabeled compounds (14C)
usually single dose
usually healthy volunteers
provides information on metabolites and excretion routes
blood samples, urine, feces are collected
in animal studies, can also collect bile and tissues
bioequivalence
approval of generic drugs
when changes are made for the approved marketed formulation
to demonstrate similarity to previous formulation
rate and extent of absorption
absence of a significant difference in concentration-time profiles in blood for 2 drug products
Cmax, Tmax, AUC
translational research
the transfer of new understanding of disease mechanisms gained in the lab into the development of new methods for diagnosis, therapy and prevention and their first testing in humans
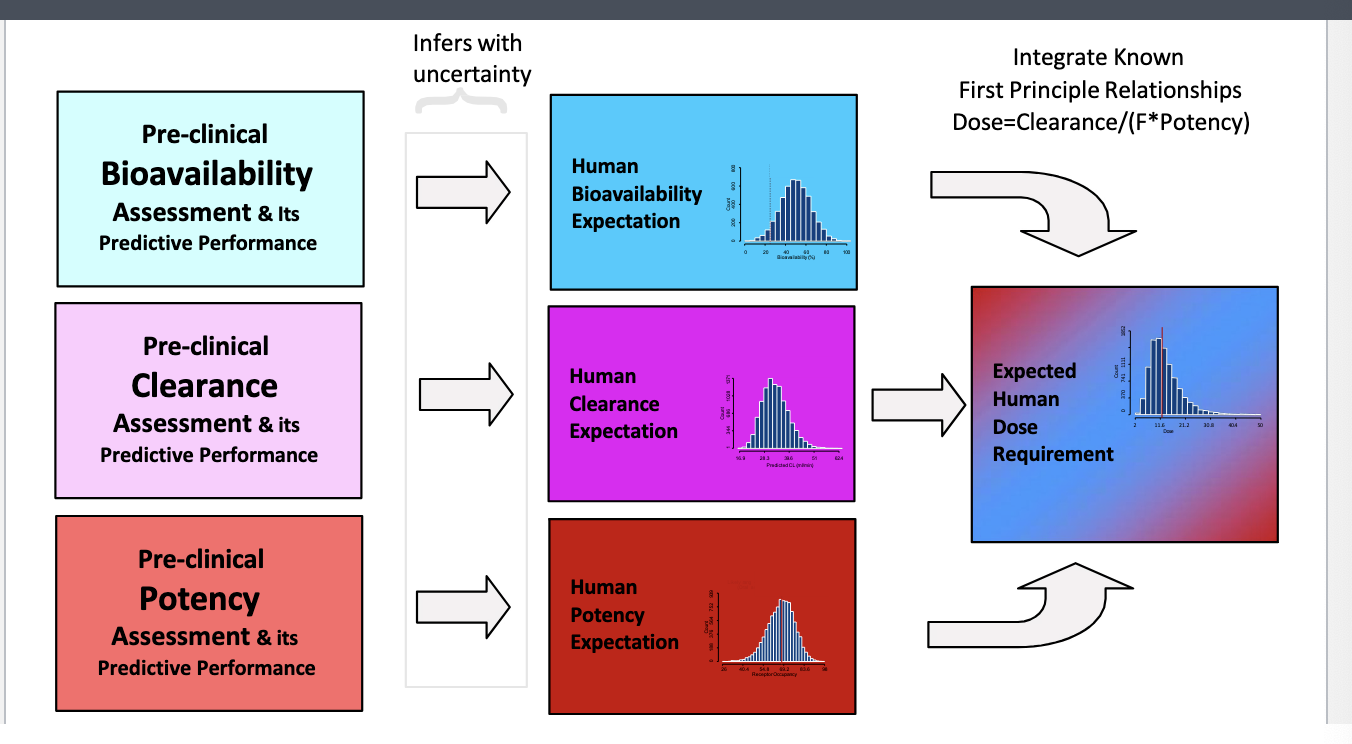
human dose prediction: 3 primary attributes determine human dose
bioavailability, CL, potency
preclinical estimates of the 3 attributes is translated into human expectations with uncertainty
integrate all the human expectations into expected human dose requirement
integrate known 1st principle relationships:
dose = CL/F*potency
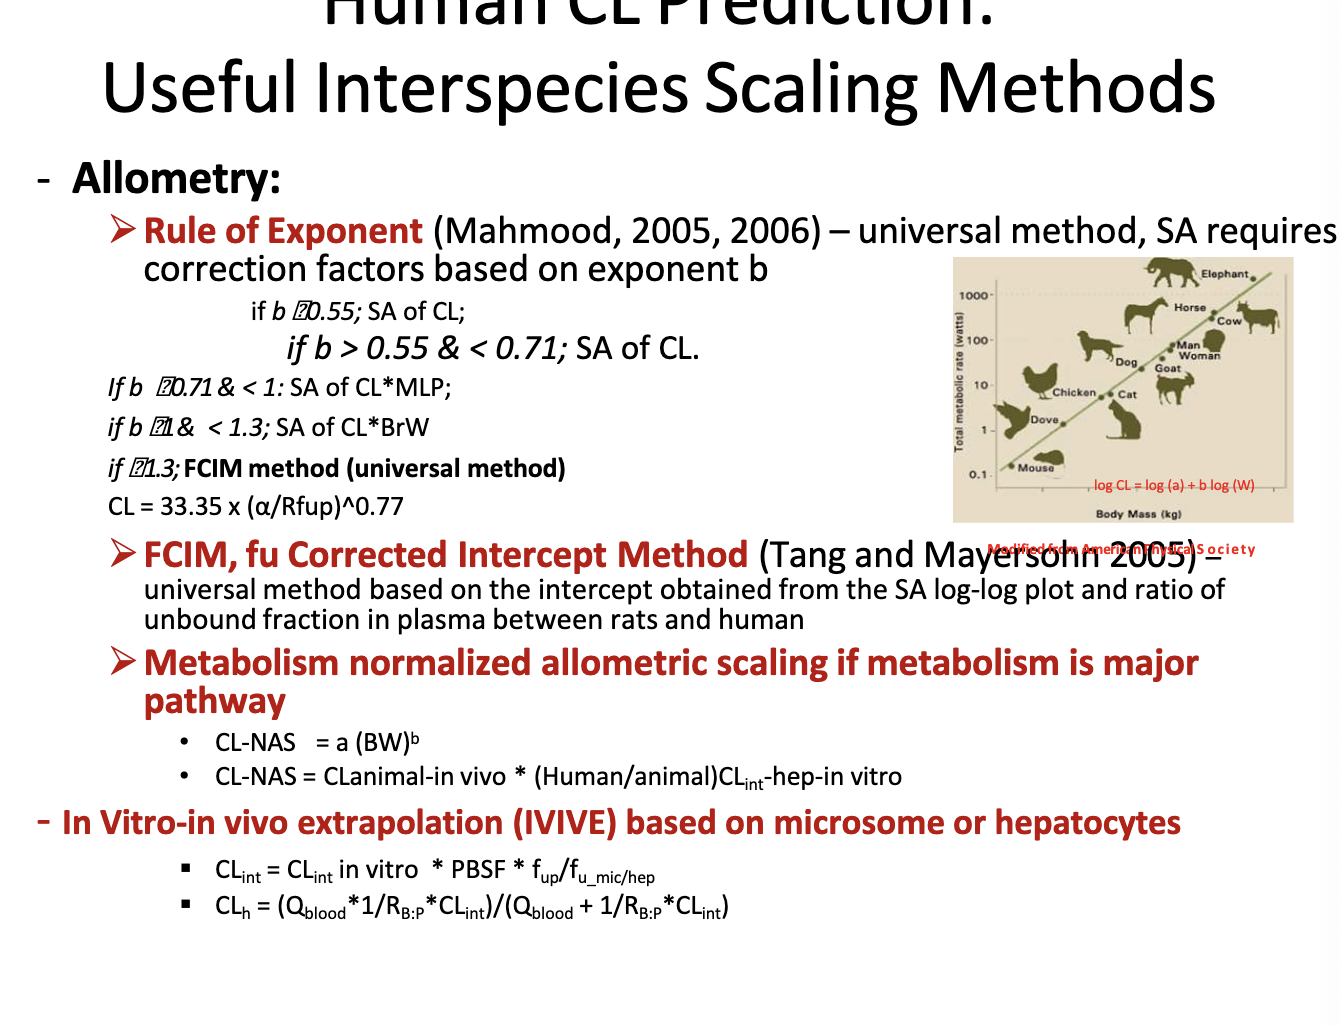
human CL prediction: useful interspecies scaling methods
allometry → scaling using the relationship between body size and biological processes across species to predict drug CL
rule of exponent → universal method, SA requires correction factors based on exponent b
if b < 0.55 → simple allometry is ok
if if 0.55<b<0.71 → use simple allometry
if 0.71<=b<1 → use CL x MLP (max. lifespan potential)
if 1<b <1.3 → use CL x BrW (brain weight)
if b>=1.3 → use FCIM method
FCIM, fu corrected intercept method → universal method based on the intercept obtained from the SA log-log plot and ratio of unbound fraction in plasma between rats and humans
metabolism normalized allometric scaling if metabolism is major pathway
CLNAS = a(BW)b
CLNAS = CLanimal-in-vivo * (humanCLint-hep-in-vitro/animalCLin-hep-in-vitro)
in vitro-in vivo extrapolation (IVIVE) based on microsome or hepatocytes
bro just look at the equations in the photo
PBSF = physiological-based scaling factor
Q blood= hepatic blood flow
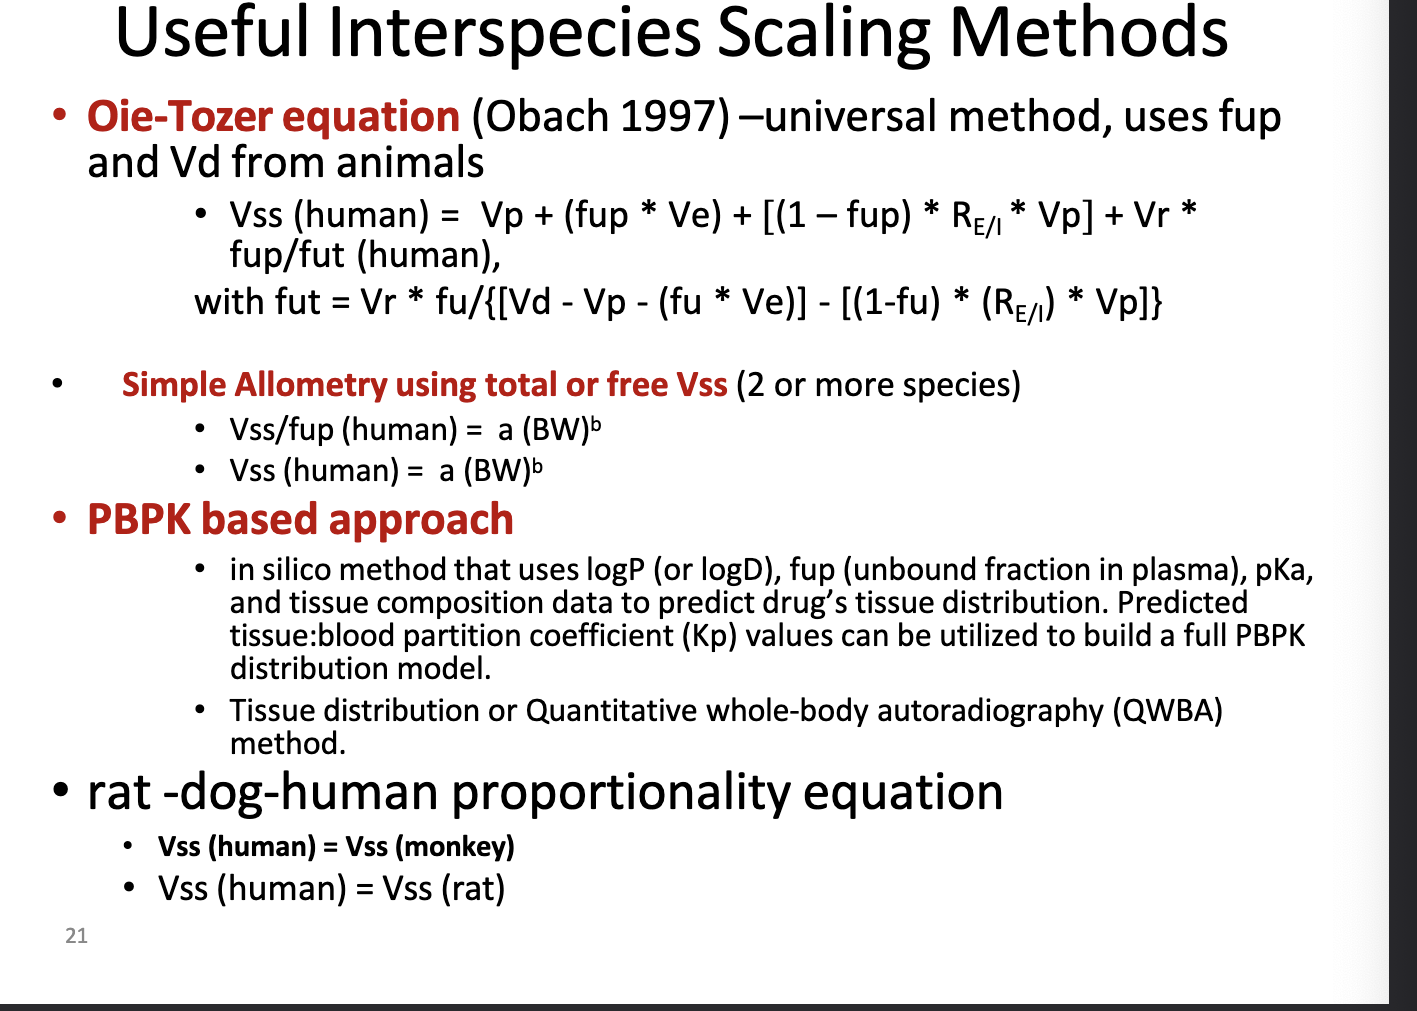
human Vss prediction: useful interspecies scaling methods
oie-tozer equation → universal method, uses fup and Vd from animals
look at photo for equation b/c i aint typing all that
fup = fraction unbound in plasma
accounts for binding in plasma and tissues UNLIKE simple allometry
simple allometry using total or free Vss (2 or more species)
look at photo for equation
power law method using body weight scaling
can also normalize to unbound drug
used when multiple species data are available
PBPK based approach
in silico method (computer based/mathematical models) that uses logP (or logD), fup, pKa, and tissue composition data to predict drug’s tissue distribution
predicted tissue:blood partition coeff (Kp) values can be used to build a full PBPK distribution model
tissue distribution or quantitative whole=body autoradiography (QWBA) method
rat-dog-human proportionality equation
assume Vss(human) = Vss(monkey) or Vss(human) = Vss(rat)
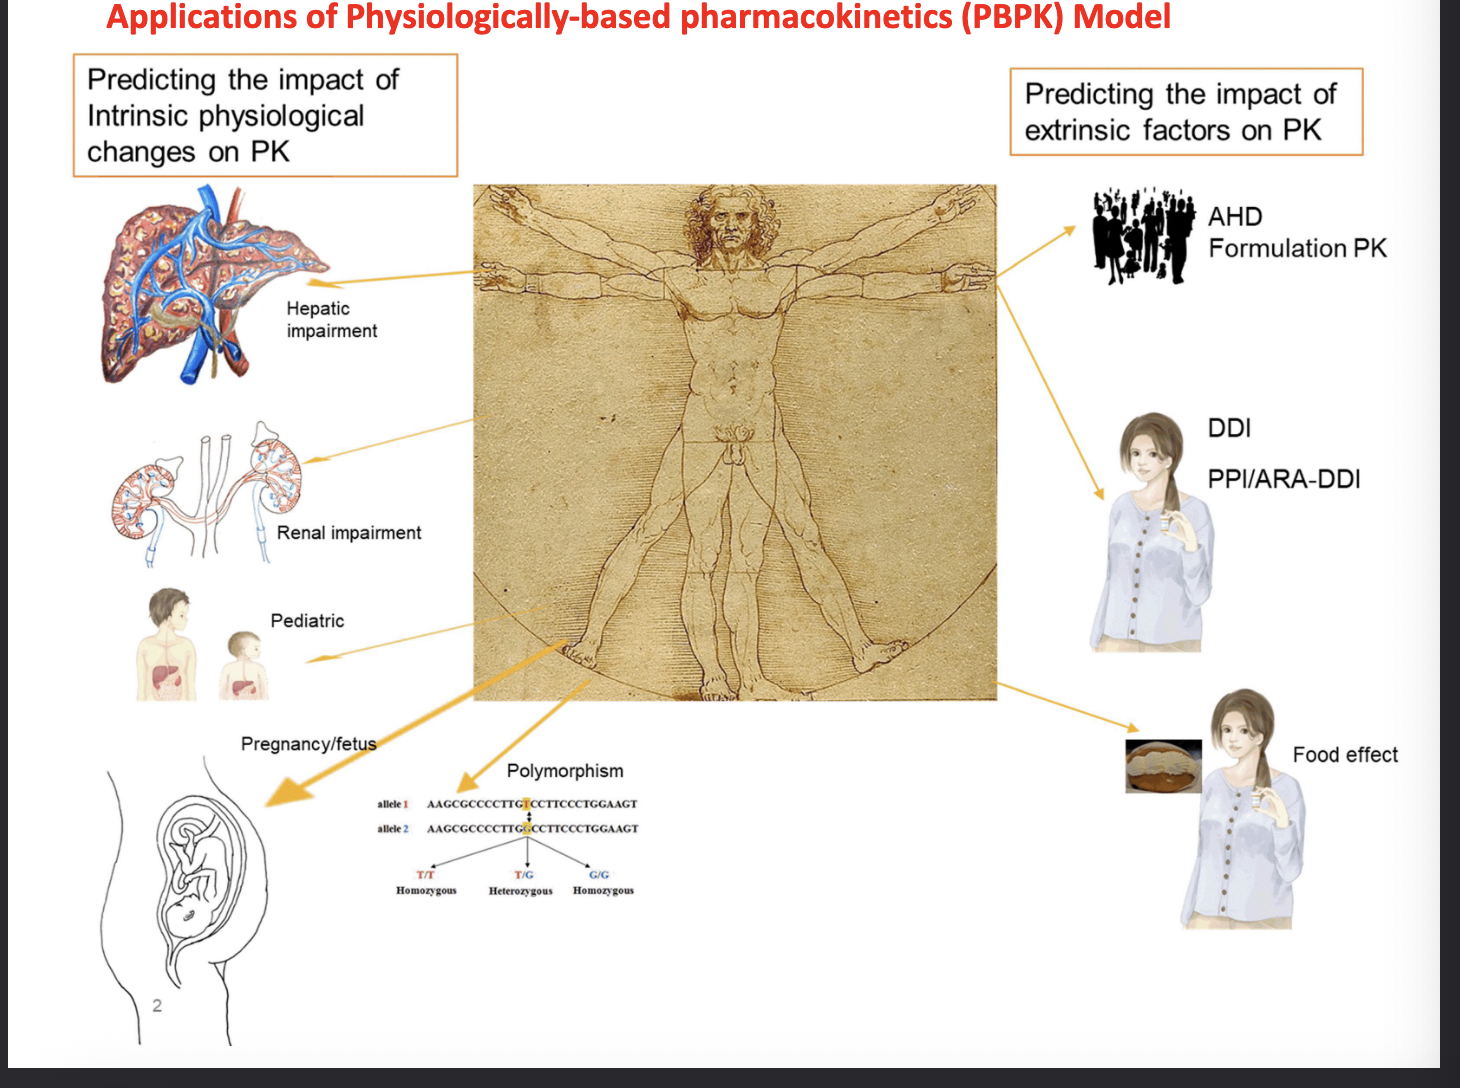
applications of physiologically-based pharmacokinetics (PBPK) model
predicting the impact of intrinsic physiological changes on PK
hepatic impairment
renal impairment
pediatric
pregnancy/fetus
polymorphism
predicting the impact of extrinsic factors on PK
age, health, demographic formulation PK
drug-drug interaction
PPI/ARA-DDI
ARA = acid-reducing agents
food effect
PBPK model: the interplay of system-specific factors and drug-specific factors
drug specific parameters
molecular weight
pkA
logD/logP
pH-solubility profile
dissolution
particle size
dosage form
dosing regimen
permeability
Km, Vmax
fup, B:P, fuinc
system-specific paramteres
demographic and genetic factors
age
weight
height
sex
genetics
race
disease
physiological factors
GI transit time
gastric pH
bile salt concentration
organ size and the associated tissue types
blood flow
drug metabolizing enzymes
drug transporters
plasma protein
hematocrit
some tools for PBPK modeling
simcyp
gastroplus
pk-sim
PSE
stella (GI-Sim)
population PK and PD
evaluate concentration-response relationships
estimate mean PK/PD parameters
evaluate variability
determine influence of co-variates on PK/PD
individual parameters
concomitant medication
address regulatory concerns
special populations
product labeling
population PK/PD: sources of variability in population
body size
age
protein binding
difference in CL
hepatic CL
renal CL
differences in endogenous substances
differences in disease stage
drug-drug interactions
co-variates ID by population PK analysis
adalimumab → immunogenicity and age
akakinra → weight
alosteron → dose and sex
aripiprazole → age, race smoking
busulfan → smoking, pediatric
daptomycin → renal function
delaviridine → ketoconazle co-admin
fexofenadine → geriatric, renal, and hepatic impairment
galantamine → fluoxetine coadmin
pramipexole → cimetidine coadmin
rifapentin → sex
rosuvastatin → race
tiagabine → carbamazepine coadmin
valgancyclovir → kidney, heart, and liver transplant pts
population PK/PD data analysis
intensive sampling vs sparse sampling
hypothesis testing vs exploratory analysis
non linear mixed effect modeling
combines fixed effects (avg clearance in population) and random effects (variability between individuals)
non-linear = accounts for complex, real world PK relationships
complicated and time consuming
extensive statistical analysis
identify and quantify sources of variability
between subject variability → differences across individuals
within subject variability (between occasion variability) → change sin individual across time or treatment cycles
inter-study variability → differences across separate studies or populations
residual variability → unexplained noise in data
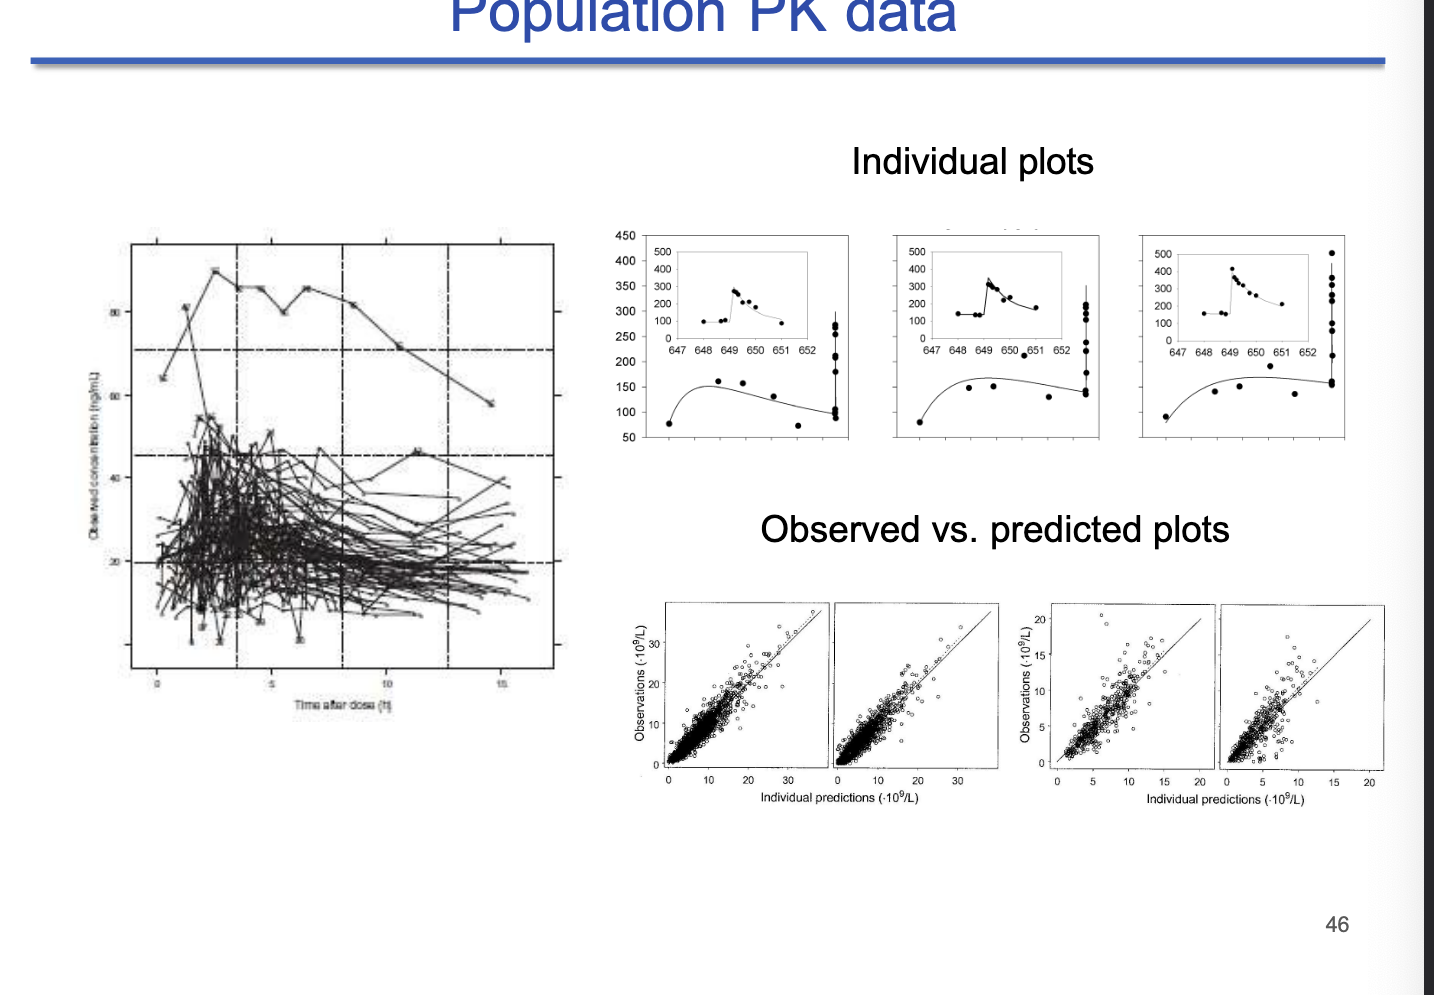
population PK data
left panel = population spaghetti plot
each line represents one individual
observed vs predicted plots
tight clustering = good fit
software
General PK/PD and compartmental modeling tools
Phoenix WinNonlin → for non-compartmental and compartmental analysis
ADAPT 5 → for nonlinear mixed-effects modeling
Berkeley Madonna → fast differential equation solver for PK/PD modeling
Matlab → general purpose math software
Population PK modeling tools
Nonmem → gold standard for population PK modeling
Monolix → for nonlinear mixed effects modeling
S-ADAPT → simulation and estimation engine
PBPK Modeling pathways
Gastroplus → used to simulate ADME
Simcyp → simulates drug interactions and special populations