VARIATION
1/18
Earn XP
Description and Tags
Name | Mastery | Learn | Test | Matching | Spaced |
|---|
No study sessions yet.
19 Terms
VARIATION
Presence of diff characteristics and this leads to diff survival rates. Diff between individuals of the same species.
This is needed for natural selection to occur
Types of variation
Continuous or discontinuous
Genetic or phenotypic
Discontinuous
Variation which can only take particular values- gender, shoe size. Controlled by 1/few genes. Environmental- little effect on these characteristics. Qualitative diff in phenotypes of individuals
Discrete
Continuous variation
Variation within a range and is measurable- height, mass, length of index finger
It’s polygenic + controlled by the environment.
Quantitative diff in phenotypes of individuals.
Normal distribution curve
Genetic variation
Diff between DNA base sequences of individuals within a species.
Phenotypic variation
Diff between the observable characteristics of individuals within a species.
Polygenes
A no of diff genes at diff loci that all contribute to a particular aspect of phenotype.
Genetic basis of discontinuous variation
Variation only occurs due to genetic factors. Diff alleles at a single gene locus have a large effect on the phenotype.
Example: F8 Gene codes for blood clotting protein factor VIII. Diff alleles in this gene locus dictate whether or not normal Factor VIII is produced and if the person has haemophilia.
Genetic basis of continuous variation
Only caused by an interaction between genetics + environment
PHENOTYPE= GENOTYPE + ENVIRONMENT.
Eg height- genes inherited that affect growth which interact w lifestyle factors- diet.
Genetic level- discontinuous variation
Diff alleles on the same locus have a large effect on the phenotype
Diff genes have quite different effects on the phenotype
Genetic level- continuous variation
Diff alleles at a single locus have a small effect on the phenotype.
Diff genes can have the same effect/ hv a large effect on the phenotype and these add together to have an ADDITIVE EFFECT.
If. A large no. Of genes have a combined effect on the phenotype- polygenes
Genetic variation- process
Mutations- that affect mitotic cell cycle.
Cell divides uncontrollably- lead to a development of a tumour.
Mutations in cells in ovaries/testes- can be inherited by offspring.
Variation caused by the environment- not passed onto the offspring
Variation T-test method
Compare the means of 2 diff sets of data to see if they are sig diff.
Data should be continuous, normally distributed + sample size should be between 10-30 readings for set.
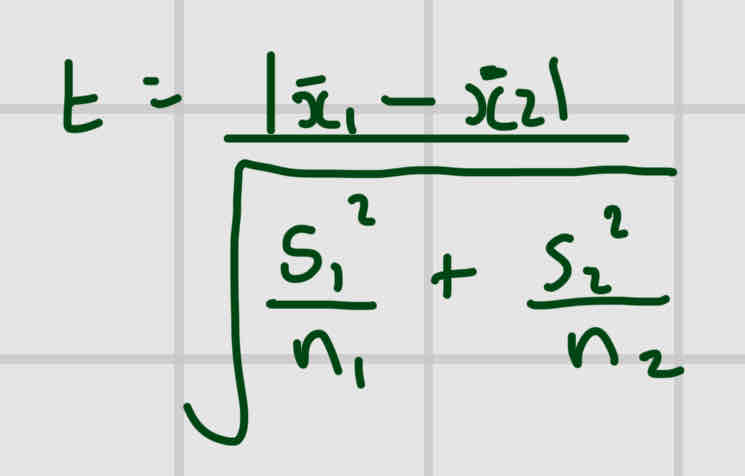
Formula For T-test
X1= mean of sample 1
X2= mean of sample 2
N1/N2- no of individuals measurements in sample ½
S1²= standard deviation of sample 1 squared
S12²= standard deviation of sample 2 squared

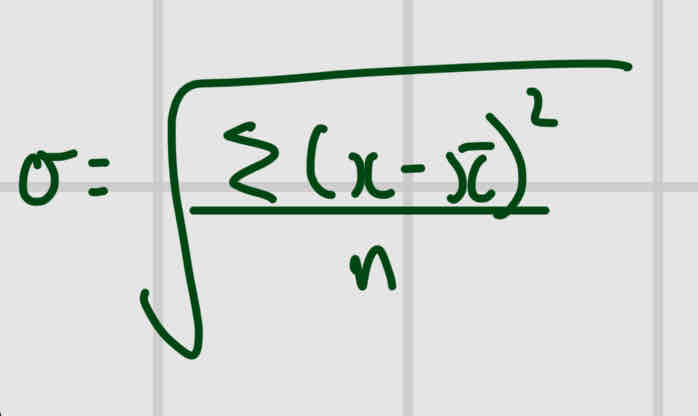
Standard deviation

Null hypothesis
Baseline assumption- no sig diff
STEPS OF T-TEST
State null hypothesis
Carry out test
Degrees of freedom (V)
Look at the table then value of t. If val of t> critical val= reject null hypothesis.- means there is a sig diff between the 2 sets of data
Degrees of freedom (V)
(N1-1)(n2-1)
P values
Probability that could have produced the results observed