Macro econ exam 1
0.0(0)
Card Sorting
1/127
Earn XP
Description and Tags
Last updated 6:59 PM on 3/15/23
Name | Mastery | Learn | Test | Matching | Spaced | Call with Kai |
|---|
No analytics yet
Send a link to your students to track their progress
128 Terms
1
New cards
Economics
the study of how best to allocate scarce resources among competing uses
The two branches of economics are closely \n intertwined, yet distinct: they address different \n questions.
The two branches of economics are closely \n intertwined, yet distinct: they address different \n questions.
2
New cards
Microeconomics
the study of how households and firms make decisions and how they interact in markets
3
New cards
Macroeconomics
the study of economy-wide phenomena, including inflation, unemployment, and economic growth.
4
New cards
Assumptions
=simplifications
simplify the complex world, make it easier to understand
Example: When studying international trade, we might assume the world consists of two countries and two goods.
simplify the complex world, make it easier to understand
Example: When studying international trade, we might assume the world consists of two countries and two goods.
5
New cards
Models
Economists use models to study economic issues. A model is a highly simplified representation of a more complicated reality.
Pros: Focuses only on what you want to know
Cons: Leaves out a lot of detail, does not focus of the complex whole-limitations
Pros: Focuses only on what you want to know
Cons: Leaves out a lot of detail, does not focus of the complex whole-limitations
6
New cards
marginal change
a small increment of adjustment to a plan of action
Rational people think on the margin
They will take an action only if marginal benefit exceeds marginal cost
Rational people think on the margin
They will take an action only if marginal benefit exceeds marginal cost
7
New cards
Economist play two roles
– Scientists: try to explain the world
– Policy advisors: try to improve it
– Policy advisors: try to improve it
8
New cards
In the first role:
economists employ the scientific method:
the dispassionate development and testing of theories about how the world works
As scientists, economists make positive statements
the dispassionate development and testing of theories about how the world works
As scientists, economists make positive statements
9
New cards
Positive statements
attempt to describe the world as it is
10
New cards
As policy advisors:
economists make normative statements
11
New cards
Normative statements
attempt to describe how the world should be, these can be confirmed or refuted, positive statements cannot
12
New cards
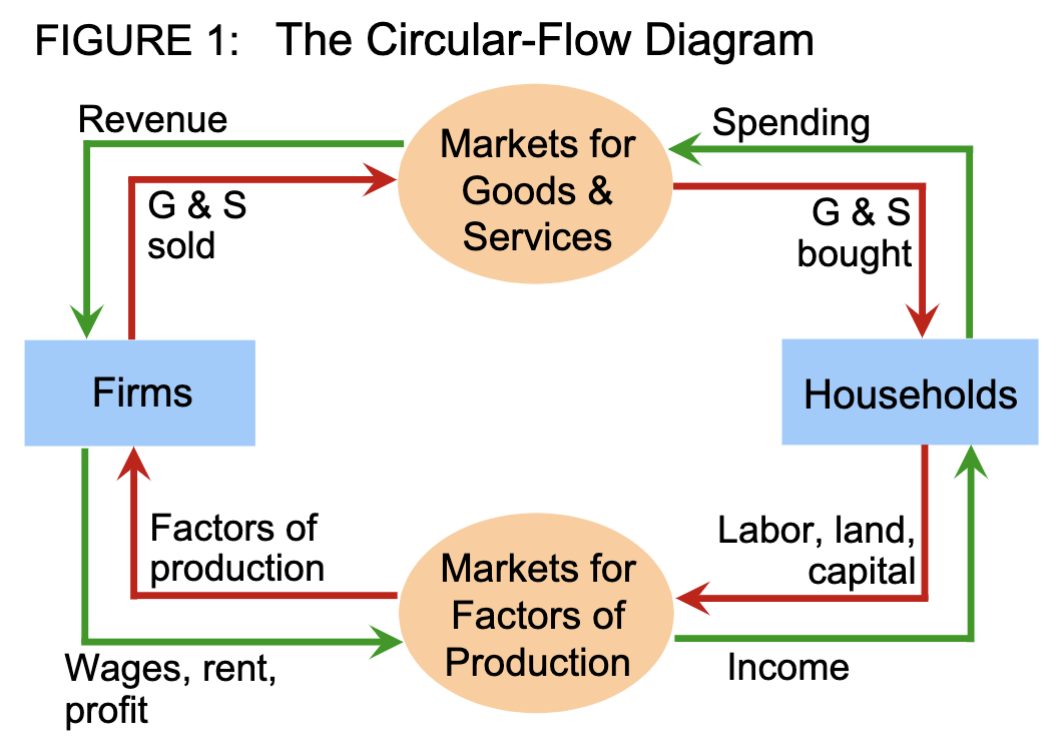
Circular-Flow Diagram
Aka a simple economy (no government, doesn’t exist so as to not complicate the model)
\
\-A visual model of the economy, shows how dollars flow through markets among households and firms
\
•Includes two types of “actors”:
– households: holders of houses, want goods (nice things) and services(doc., police) to increase utility, own factors of production (like labour, land, capital), but don’t know how to use them
– firms: own nothing, only ability to take factors of production and hand them back as goods and services
\
Households and firms depend on each other, must interact
\
• This happens in two markets:
– the market for goods and services: households spend money on goods and services, which then becomes revenue for firms, Firms sell goods and services which are bought by households
– the market for “factors of production”
\
What is fueling this? The need for happiness.
\
\-A visual model of the economy, shows how dollars flow through markets among households and firms
\
•Includes two types of “actors”:
– households: holders of houses, want goods (nice things) and services(doc., police) to increase utility, own factors of production (like labour, land, capital), but don’t know how to use them
– firms: own nothing, only ability to take factors of production and hand them back as goods and services
\
Households and firms depend on each other, must interact
\
• This happens in two markets:
– the market for goods and services: households spend money on goods and services, which then becomes revenue for firms, Firms sell goods and services which are bought by households
– the market for “factors of production”
\
What is fueling this? The need for happiness.
13
New cards
Market for Goods and Services
Money: Households R:(spending) pay money for goods and services and firms R:(selling) receive this money as revenue
Red: Firms>sold>goods>bought>household
Green: Firms
Red: Firms>sold>goods>bought>household
Green: Firms
14
New cards
Factors of production
Also called resources (inputs)
Goods and services are outputs
\
The households are sellers, the firms are buyers
Green arrows are the dollar flow from firms to households in wages, rent, income, profit.
\
the resources that the economy uses to produce goods and services, these include:
* labor (teachers, bakers, etc.)
* land
* capital (buildings & machines used in production to provide a service)
Money: Firms pay wages, rent, profit for factors of production which households receive as income
Firms>wages, rent, profit>Factors>Income>household
Item: Households sell factors to firms as factors of production
Household>land,labor,capital>factors of production>firms
15
New cards
Production Possibilities Frontier (PPF)
A line or curve that shows all the possible combinations of two outputs that can be produced using all available resources
A graph that shows the combination of two goods the economy can possibly produce given the available resources and the available technology.
Moving along a PPF involves shifting resources (factor of production)
(e.g., labor) from the production of one good to the other.
When a country’s economy isn’t doing well its ppf shifts in
Straight line = constant oppc
steeper = higher oppc
16
New cards
Points on the PPF line
possible and efficient
17
New cards
Points under the PPF line
possible but not efficient
18
New cards
Points above the PPF line
not possible
19
New cards
opportunity cost
whatever must be given up to obtain some item.
20
New cards
PPF and opportunity cost
• Moving along a PPF involves shifting resources
(e.g., labor) from the production of one good to the other.
• Society faces a tradeoff: Getting more of one good requires sacrificing some of the other.
• The slope of the PPF tells you the opportunity cost of one good in terms of the other.
/gain
(e.g., labor) from the production of one good to the other.
• Society faces a tradeoff: Getting more of one good requires sacrificing some of the other.
• The slope of the PPF tells you the opportunity cost of one good in terms of the other.
/gain
21
New cards
Shift in ppf
More or less resources, and better technology
22
New cards
Why the PPF Might Be Bow-Shaped
• PPF is bow-shaped when different workers \n have different skills, different opportunity costs \n of producing one good in terms of the other. \n • The PPF would also be bow-shaped when \n there is some other resource, or mix of \n resources with varying opportunity costs. \n – E.g., different types of land suited for \n different uses
23
New cards
market economy
an economy that allocates resources through the decentralized decisions of many firms and households as they interact in markets for goods and services
24
New cards
property rights
the ability of an individual to own and exercise control over scarce resources
25
New cards
business cycle
fluctuations in economic activity, such as employment and production
26
New cards
3 Pillars in economic growth
1. Produce more 2. More jobs 3. Stable prices
27
New cards
inflation
an increase in the overall level of prices in the economy
28
New cards
The goods market
29
New cards
Demand
Demand comes from the behavior of buyers
30
New cards
quantity demanded
the amount of the good that buyers are willing and able to purchase at alternative prices.
31
New cards
Law of demand
the claim that the quantity demanded of a good falls when the price of the good rises, other things equal.
32
New cards
Demand schedule
A table that shows the relationship between the price of a good and the quantity demanded
33
New cards
demand curve
A graph of the relationship between the price of a good and the quantity demanded
Negative slope because people have different willingness to pay.
Negative slope because people have different willingness to pay.
34
New cards
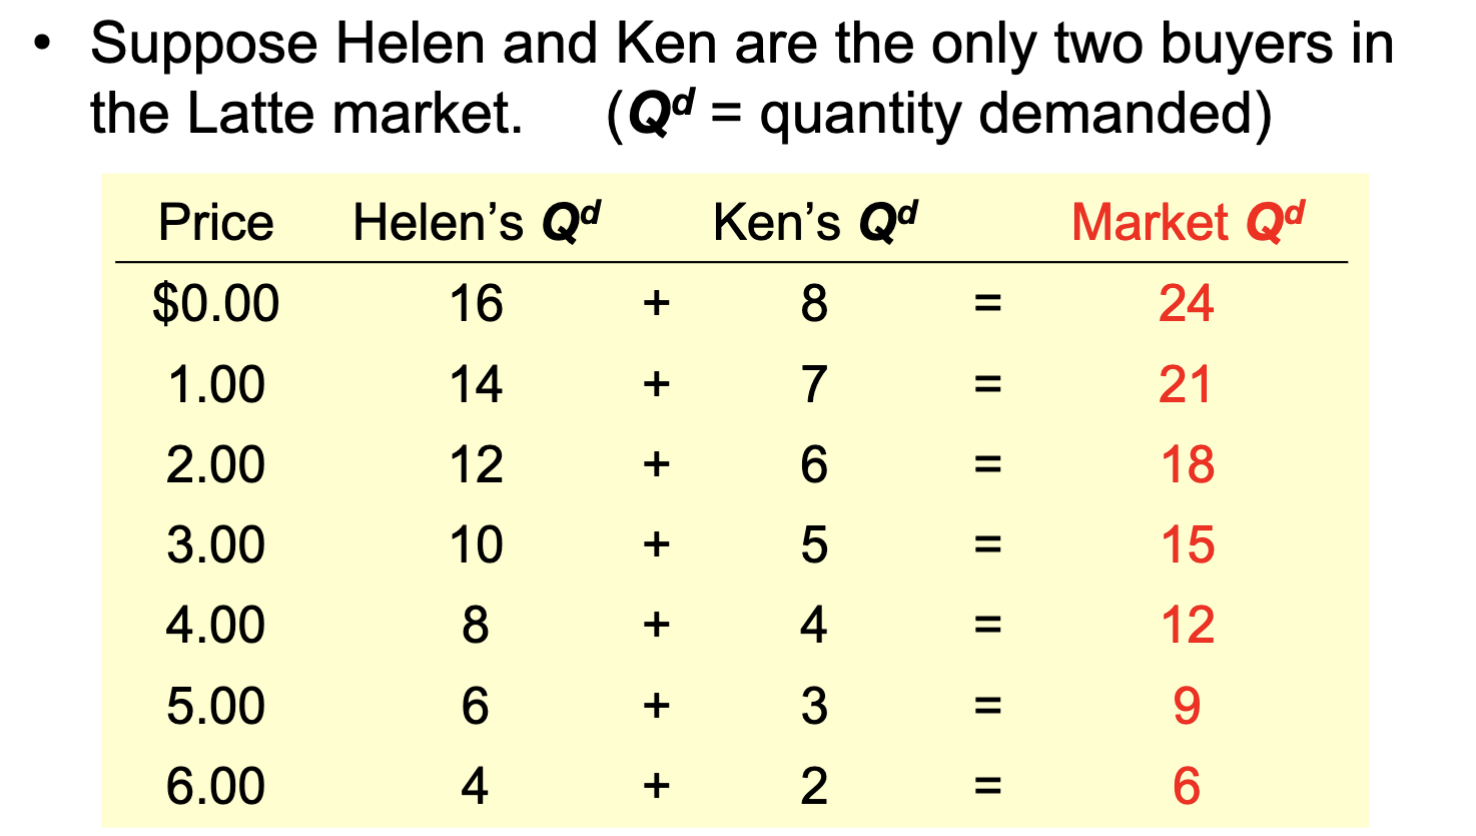
Market Demand
The quantity demanded in the market is the sum of the quantities demanded by all buyers at each price
35
New cards
Demand Function
Qd \= f(P)
36
New cards
How to know what price people want aka equilibrium price
Firms just throw prices out there and see what happens
37
New cards
Ten principles of Economics
people face tradeoffs, the cost of something is what you give up to get it, rational people think at the margin, people respond to incentives, trade can make everyone better off, markets are usually a good way to organize economic activity, governments can sometimes improve market outcomes, a country’s standard of living depends on its ability to produce goods and services, prices rise when the government prints too much money, society faces a short- run trade off between inflation and unemployment
38
New cards
normal good
Demand for this good is positively related to income.
39
New cards
inferior good
demand for this good is negatively related to income
40
New cards
Substitutes
an increase in the price of one causes an increase in demand for the other
41
New cards
Complements
an increase in the price of one causes a fall in demand for the other
42
New cards
Expectations
affect consumers' buying decisions
43
New cards
quantity supplied
the amount of a good that sellers are willing and able sell at alternative prices
44
New cards
law of supply
the claim that, other things being equal, the quantity supplied of a good rises when the price of a good rises
45
New cards
Supply schedule
a table that shows the relationship between the price of a good and the quantity supplied
46
New cards
supply curve
a graph of the relationship between the price of a good and the quantity supplied. Affected by Technology, expectation, and number of sellers.
47
New cards
The Supply function
Qxs \= f(Px)
48
New cards
equilibrium
a situation in which the market price has reached the level at which quantity supplied equals quantity demanded
49
New cards
equilibrium price
the price that balances quantity demanded and quantity supplied
50
New cards
equilibrium quantity
the quantity supplied and the quantity demanded at the equilibrium price
51
New cards
surplus
a situation in which quantity supplied is greater than quantity demanded
52
New cards
shortage
a situation in which quantity demanded is greater than quantity supplied
53
New cards
law of supply and demand
the claim that the price of any good adjusts to bring the quantity supplied and quantity demanded for that good into balance
54
New cards
Three steps to analyzing changes in equilibrium
1. Decide whether event shifts supply curve demand curve or both. 2. Decide in which direction curve shifts. 3. Use supply-demand diagram to see how the shift changes equilibrium price and quantity
55
New cards
Gross domestic product (GDP)
the market value of all final goods and services produced within a country in a given period of time.
All countries want this number to be high. It’s like a score/gpa for a country.
A way to measure happiness is to look at the amount of goods and services produced bcs households are happier with these.
\
There are two ways of calculating this, by totalling up the spending of a country, or totaling up the income, because they should be about the same. Known as: Income and expenditure
56
New cards
The market value…
Goods are valued at their market prices, so: \\n - All goods measured in the same units \\n
(e.g., dollars in the U.S.) \\n
\- Things that don’t have a market value are excluded, e.g., housework you do for yourself.
(e.g., dollars in the U.S.) \\n
\- Things that don’t have a market value are excluded, e.g., housework you do for yourself.
57
New cards
…of all final (goods)…
intended for the end user
GDP only includes final goods – they already embody the value of the intermediate goods used in their production.
GDP only includes final goods – they already embody the value of the intermediate goods used in their production.
58
New cards
(Intermediate goods)
Not included in GDP
Used as components or ingredients in the production of other goods
Used as components or ingredients in the production of other goods
59
New cards
….goods & services…
GDP includes tangible goods
(like DVDs, mountain bikes, beer)
and intangible services
(dry cleaning, concerts, cell phone service).
(like DVDs, mountain bikes, beer)
and intangible services
(dry cleaning, concerts, cell phone service).
60
New cards
…produced…
GDP includes currently produced goods, \n not goods produced in the past. Produced this year.
61
New cards
…within a country…
GDP measures the value of production that occurs \n within a country’s borders, whether done by its own \n citizens or by foreigners located there.
62
New cards
…in a given period of time.
Usually a year or a quarter (3 months)
63
New cards
The Components of GDP
Recall: GDP is total spending.
\
Four components:
\- Consumption (C)
\- Investment (I)
\- Government Purchases (G)
- Net Exports (NX)
These components add up to GDP (denoted Y):
Y=C+I+G+NX
\
Four components:
\- Consumption (C)
\- Investment (I)
\- Government Purchases (G)
- Net Exports (NX)
These components add up to GDP (denoted Y):
Y=C+I+G+NX

64
New cards
Consumption (C)
Spending by households on goods and services with the exception of purchases of new housing
Note on housing costs: \n - For renters, C includes rent payments. \n - For homeowners, C includes the imputed rental value of the house, but not the purchase price or mortgage payments
Note on housing costs: \n - For renters, C includes rent payments. \n - For homeowners, C includes the imputed rental value of the house, but not the purchase price or mortgage payments
65
New cards
Investment (I)
Spending on capital equipment, inventories and structures, including household purchases of new housing
\
\- Business capital: business structures, \n equipment, and intellectual property products \n
\- Residential capital: landlord’s apartment \n building; a homeowner’s personal residence \n
\- Inventory accumulations: goods produced but \n not yet sold
\
“Investment” does not mean the purchase of \n financial assets like stocks and bonds.
\
\- Business capital: business structures, \n equipment, and intellectual property products \n
\- Residential capital: landlord’s apartment \n building; a homeowner’s personal residence \n
\- Inventory accumulations: goods produced but \n not yet sold
\
“Investment” does not mean the purchase of \n financial assets like stocks and bonds.
66
New cards
GDP equation
Consumption + Investment + Government Purchases + Net Exports
67
New cards
Government purchases (G)
Spending on goods and services by local, state, and federal governments
\
\- At the federal, state, and local levels.
\
Excludes transfer payments \n -Such as Social Security or unemployment \n insurance benefits.
\-They are not purchases of goods and services
\
\- At the federal, state, and local levels.
\
Excludes transfer payments \n -Such as Social Security or unemployment \n insurance benefits.
\-They are not purchases of goods and services
68
New cards
Net exports (NX)
We’re trying to figure out how much stuff the US produces by looking at the spending. But we spend money on a lot of stuff that’s not made here, aka imports, so we subtract them.
Also, some stuff that’s produced here, is being sold over seas, aka exports, so we add them to GDP.
Spending on domestically produced goods by foreigners (exports) minus spending on foreign goods by domestic residents (imports).
\
\- Net exports, NX = exports – imports
\- Exports: foreign spending on the economy’s goods and services
\- Imports: are the portions of C, I, and G that are spent on goods and services produced abroad
\
If net exports are negative, we have more imports than exports.
69
New cards
Real versus Nominal GDP
Inflation can distort economic variables like \n GDP, so we have two versions of GDP:
70
New cards
Nominal GDP
the production of goods and services valued at current prices
\
We’re going to value the production of goods in each year using the prices of those goods in each year
\
values output using current prices \n - not corrected for inflation
\
The change in nominal GDP reflects both prices \n and quantities.
\
(Price x quantity) + (Price x quantity)= Nominal GDP
\
We’re going to value the production of goods in each year using the prices of those goods in each year
\
values output using current prices \n - not corrected for inflation
\
The change in nominal GDP reflects both prices \n and quantities.
\
(Price x quantity) + (Price x quantity)= Nominal GDP
71
New cards
Real GDP
the production of goods and services valued at constant prices
\
values output using the prices of a base year is corrected for inflation
\
The change in real GDP is the amount that GDP would change if prices were constant (i.e., if zero inflation).
Aka gives you quantity produced each year.
Hence, real GDP is corrected for inflation.
\
(Price @ base year x quantity) + (price @ base year x quantity) = GDP
\
values output using the prices of a base year is corrected for inflation
\
The change in real GDP is the amount that GDP would change if prices were constant (i.e., if zero inflation).
Aka gives you quantity produced each year.
Hence, real GDP is corrected for inflation.
\
(Price @ base year x quantity) + (price @ base year x quantity) = GDP
72
New cards
GDP deflator
A measure of inflation in the prices of goods and services produced in the United States, including exports
\
A measure of the price level calculated as the ratio of nominal GDP to real GDP times 100
The GDP deflator is a measure of the overall level of prices.
One way to measure the economy’s inflation rate is to compute the percentage increase in the GDP deflator from one year to the next.
\
Nominal GDP
= ----------------- x 100
Real GDP
\
A measure of the price level calculated as the ratio of nominal GDP to real GDP times 100
The GDP deflator is a measure of the overall level of prices.
One way to measure the economy’s inflation rate is to compute the percentage increase in the GDP deflator from one year to the next.
\
Nominal GDP
= ----------------- x 100
Real GDP
73
New cards
Gross National Product
Total income earned by the nation's factors of production, regardless of where located.
The value of goods and services produced by the citizens of a nation irrespective of the geographical limits in a financial year is known as GNP
The value of goods and services produced by the citizens of a nation irrespective of the geographical limits in a financial year is known as GNP
74
New cards
Inflation
“Average” increase in price level
Alternative Measures of Inflation
\-GDP Deflator
\-Consumer Price Index
\-Producer Price Index
\-PCE Deflator
Alternative Measures of Inflation
\-GDP Deflator
\-Consumer Price Index
\-Producer Price Index
\-PCE Deflator
75
New cards
Consumer Price Index (CPI)
A measure of the overall cost of the goods and services bought by a typical consumer
\
An index in statistics is a sample of a population. In this case, we take a sample of products that an urban family of four usually buys, and track these prices. The price change of this index/sample mimics or represents the price changes of the overall economy.
\
An index in statistics is a sample of a population. In this case, we take a sample of products that an urban family of four usually buys, and track these prices. The price change of this index/sample mimics or represents the price changes of the overall economy.
76
New cards
How to calculate CPI
1\. Fix the “basket.”
The Bureau of Labor Statistics (BLS) surveys consumers to determine what’s in the typical consumer’s “shopping basket.”
\
2\. Find the prices. The BLS collects data on the prices of all the goods in the basket.
\
3\. Compute the basket’s cost. Use the prices to compute the total cost of the basket.
\
4\. Choose a base year and compute the index.
cost of basket in current year
100 x --------------------------------
cost of basket in base year
\
5\. Compute the inflation rate. The percentage change in the CPI from the preceding period.
CPI this year – CPI last year
inflation rate = ----------------------------- x 100%
CPI last year
77
New cards
Inflation rate
the percentage change in the price index from the preceding period
78
New cards
producer price index
a measure of the cost of a basket of goods and service bought by firms
Because firms eventually pass on their costs to consumers in the form of higher consumer prices, changes in the PPI are often thought to be useful for predicting changes in the CPI.
Because firms eventually pass on their costs to consumers in the form of higher consumer prices, changes in the PPI are often thought to be useful for predicting changes in the CPI.
79
New cards
Contrasting the CPI and GDP Deflator
Imported consumer goods:
included in CPI
excluded from GDP deflator
\
Capital goods:
excluded from CPI
included in GDP deflator (if produced domestically)
\
The basket:
CPI uses fixed basket
GDP deflator uses basket of currently produced goods & services
This matters if different prices are changing by different amounts.
included in CPI
excluded from GDP deflator
\
Capital goods:
excluded from CPI
included in GDP deflator (if produced domestically)
\
The basket:
CPI uses fixed basket
GDP deflator uses basket of currently produced goods & services
This matters if different prices are changing by different amounts.
80
New cards
Comparing Dollar Figures from Different Times with CPI
Inflation makes it harder to compare dollar amounts from different times.
Example: the minimum wage
\- $1.25 in Dec 1963
\- $7.25 in Dec 2013
Did min wage have more purchasing power in
Dec 1963 or Dec 2013?
To compare, use CPI to convert 1963 figure into
“2013 dollars”...
\
cpi= 30.9 in year T
CPI = 234.6 today
Example: the minimum wage
\- $1.25 in Dec 1963
\- $7.25 in Dec 2013
Did min wage have more purchasing power in
Dec 1963 or Dec 2013?
To compare, use CPI to convert 1963 figure into
“2013 dollars”...
\
cpi= 30.9 in year T
CPI = 234.6 today
81
New cards
Amount in todays dollars =
Amount in year T dollars x Price level today
-------------------
Price level in Year T
-------------------
Price level in Year T
82
New cards
Indexation
A dollar amount is indexed for inflation if it is automatically corrected for inflation by law or in a contract.
\
For example, the increase in the CPI automatically determines
the COLA in many multi-year labor contracts
the adjustments in Social Security payments and federal income tax brackets
\
For example, the increase in the CPI automatically determines
the COLA in many multi-year labor contracts
the adjustments in Social Security payments and federal income tax brackets
83
New cards
nominal interest rate
the interest rate as usually reported without a correction for the effects of inflation
\
\n Interest rate not corrected for inflation \n Rate of growth in the dollar value of a deposit or debt
\
\n Interest rate not corrected for inflation \n Rate of growth in the dollar value of a deposit or debt
84
New cards
real interest rate
the interest rate corrected for the effects of inflation
Corrected for inflation
Rate of growth in the purchasing power of a deposit or debt
\
Real interest rate = (nominal interest rate) – (inflation rate)
Helps to predict how much interest you are actually getting back
Calculated by predicting the inflation rate
In the future, after inflation has occurred and you know know what it actually is, you can recalculate the interest rate to get the realized real interest rate.
85
New cards
Labour statistics
Produced by Bureau of Labor Statistics (BLS), in \n the U.S. Dept. of Labor
Based on a monthly survey of 60,000 \n households: Current Population Survey \n Based on “adult population” (16 yrs. or older)
Based on a monthly survey of 60,000 \n households: Current Population Survey \n Based on “adult population” (16 yrs. or older)
86
New cards
BLS divides population into 3 groups:
employed: paid employees, self-employed, and unpaid workers in a family business
unemployed: people not working who have looked for work during previous 4 weeks
not in the labor force: everyone else
The labor force is the total # of workers, including the employed and unemployed.
unemployed: people not working who have looked for work during previous 4 weeks
not in the labor force: everyone else
The labor force is the total # of workers, including the employed and unemployed.
87
New cards
*Employed:*
* This category includes those who worked as paid employees, worked in their own business, or worked as unpaid workers in a family member’s business. Both full-time and part-time workers are counted. This category also includes those who were not working but who had jobs from which they were temporarily absent because of, for example, vacation, illness, or bad weather. Work for at least one hour a week.
88
New cards
*Unemployed:*
This category includes those who were not employed, were available for work, and had tried to find employment during the previous four weeks. It also includes those waiting to be recalled to a job from which they had been laid off.
89
New cards
*Not in the labor force:*
This category includes those who fit neither of the first two categories, such as full-time students, homemakers, and retirees and children.
90
New cards
labor force
the total number of workers, including both the employed and the unemployed
91
New cards
unemployment rate
the percentage of the labor force that is unemployed
92
New cards
labor-force participation rate
the percentage of the adult population that is in the labor force
93
New cards
natural rate of unemployment
the normal rate of unemployment around which the unemployment fluctuates
94
New cards
cyclical unemployment
the deviation of unemployment from its natural rate
95
New cards
discouraged workers
individuals who would like to work but have given up looking for a job
96
New cards
frictional unemployment
unemployment that results because it takes time for workers to search for the jobs that best suit their tastes and skills
97
New cards
structural unemployment
unemplyoment that results because the number of jobs available in some labor markets is insufficient to provide a job for everyone who wants one
98
New cards
job search
the process by which workers find appropriate jobs given their tastes and skills
99
New cards
unemployment insurance
a government program that partially protects workers' incomes when they become unemployed
100
New cards
union
a worker association that bargains with employers over wages, benefits, and working conditions