10 - Spatial Dynamics & Communities through Time
1/94
There's no tags or description
Looks like no tags are added yet.
Name | Mastery | Learn | Test | Matching | Spaced | Call with Kai |
|---|
No analytics yet
Send a link to your students to track their progress
95 Terms
is populations and species static or not static
Populations and species are not static; they move, disperse, and shift across landscapes
why do populations move, disperse, and shift across landscapes
in response to resources, competition, climate, and disturbances.
Types of Movement
Dispersal
Migration
Colonization
Local Extinction & Recolonization
Dispersal
Movement of individuals from birthplace to new habitats (e.g., seeds carried by wind or animals).
Migration
Seasonal movement between habitats (e.g., caribou herds, monarch butterflies).
Colonization
Establishment of populations in new areas following disturbance or opportunity
Local Extinction & Recolonization
Dynamic balance within metapopulations.
Ecological Significance of movement
o Maintains genetic diversity through gene flow.
o Enables species persistence across fragmented landscapes.
o Shapes community structure and biodiversity patterns.
o Critical for conservation planning and wildlife corridors
“In ecology, movement means survival; staying in one place too long may mean disappearing altogether.”
Four essential questions that need to be answered with movement data
• 1. How do organisms move (tied to physiology and anatomy)?
• 2. Why do they move (tied to life history and fitness)?
• 3. Where and when do they move (tied to navigation)?
• 4. How do external factors interact with and affect the how, why, where, and when of movement
Migration versus Dispersal
Migration is A regular, often seasonal movement of individuals or populations between two or more locations, usually involving a return journey. it is Driven by predictable environmental cues such as temperature, food availability, or breeding cycles.
Dispersal is A one-way movement of individuals from their birthplace to a new location where they settle and reproduce. it involves colonization of new habitats and promotes gene flow among populations.
Key Difference: Migration versus Dispersal
✓ Migration is cyclical and temporary, while
✓ Dispersal is permanent and spatially expansive.
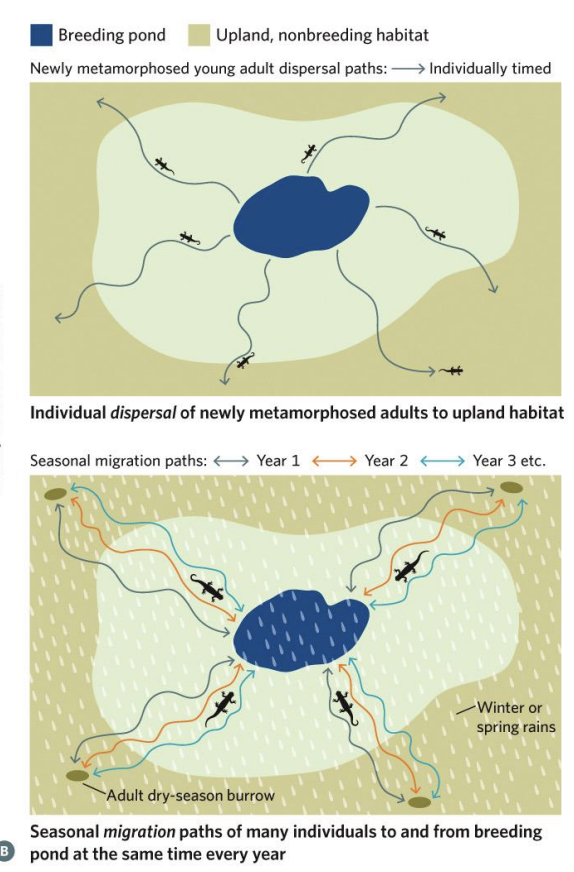
The movement behavio u r of coast range newts exemplifies the distinction between dispersal and migration.
Young individuals disperse by themselves from their natal ponds to upland, nonbreeding habitats after they mature into adults.
As adults, however, they make a seasonal breeding migration from their summer dry-season burrows to ponds and then return to the upland after breeding.
Humpback whales migration
Humpback whales from different numbered pods make long distance migrations (indicated by dashed lines) across the oceans of the world.
Notice that pod one moves from its feeding areas (green shapes) in the cold waters of the North Atlantic to the warm Caribbean waters that are its birthing grounds (blue area 1)

Canada geese migration patterns
Canada geese make long migrations to the southern United States for the winter and back north to Canada and Alaska in the summer to nest and raise their young
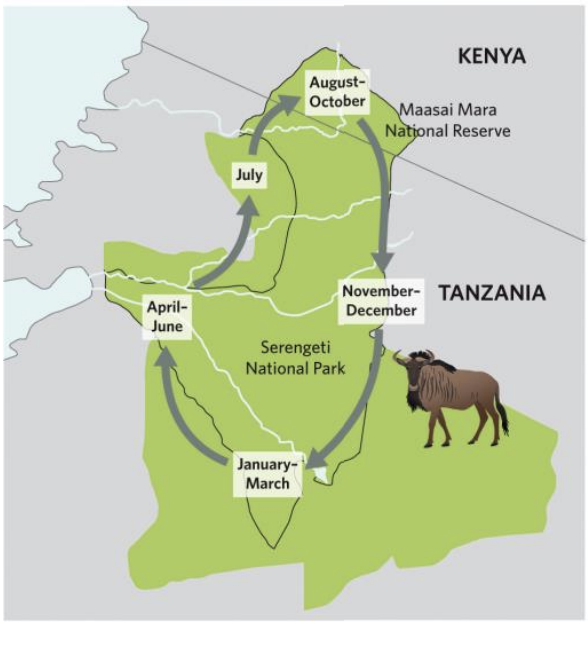
Wildebeest migration patterns
Wildebeest in Maasai Mara, Kenya, make annual migrations around East Africa.
longest migrations of any mammal
Humpback whales undertake one of the longest migrations of any mammal.
They travel thousands of kilometres between feeding grounds in polar waters and breeding grounds in tropical/subtropical regions each yea
Humpback whales seasonal migration pattern
Summer: Feed in cold, nutrient-rich polar regions (e.g., Alaska, Antarctic waters) to build energy reserves.
Winter: Migrate to warm tropical regions (e.g., Hawaii, Central America, Western Pacific) to breed and give birth
Whale migration is seasonal, predictable, and cyclical, often spanning 8,000–10,000 km round-trip.
Orcas
also known as killer whales travel and hunt in pods. As a group, such pods are very effective predators that can kill much larger whales.
Orcas have been known to kill many types of whales, including humpback whales, and are a common cause of mortality for young humpbacks as they migrate to summer feeding grounds in the Arctic from the warm waters where they were born.
Ecological Relevance to Killer Whales (Orcas)
• Killer whales (Orcinus orca) track humpback movements for predation and competition.
• Predation on humpback calves is highest near breeding grounds where killer whales gather.
• Humpback migration routes and timing have evolved partly due to predation risk and food availability.
Anadromous
type of migration: Anadromous: born in freshwater, mature in the ocean, and return to spawn.
Sockeye Salmon Life Cycle & Migration Stages
1. Spawning (Freshwater):
• Adults migrate upstream to their natal streams (where they hatched).
• Females lay thousands of eggs in gravel nests called redds.
2. Fry & Smolt Stage:
• Juveniles (fry) hatch and spend 1–3 years in lakes before migrating downstream to the ocean (smoltification).
3. Ocean Phase:
• Spend 1–4 years feeding on plankton and small fish in the open ocean — rapid growth period.
4. Return Migration:
• Adults travel thousands of kilometres back to their natal streams using olfactory imprinting and geomagnetic cues.
5. After spawning, all adults die — completing a semelparouslife cycle
Ecological Importance of Sockeye Salmon Migration
• Nutrient Transport: Carcasses enrich freshwater ecosystems with marine-derived nutrients (N & P).
• Food Web Role: Provide critical food for bears, eagles, and other scavengers.
• Indicator Species: Reflects ecosystem health, hydrology, and climate stability.
• Population Synchrony: Migration timing is highly sensitive to temperature, stream flow, and ocean conditions
Monarch Butterfly (Danaus plexippus) Migration
• Known for one of the longest insect migrations on Earth.
• Travel up to 4,000–5,000 km between breeding grounds in North America and overwintering sites in central Mexico.
• Migration involves multiple generations — no single butterfly completes the full round trip.
Monarch Butterfly Migration Pattern
➢ Spring: Butterflies leave Mexico and migrate north through the U.S. to
southern Canada.
➢ Summer Generations: Breed and die along the way, offspring continue the
journey northward.
➢ Autumn: The fourth generation (the “super generation”) flies back to Mexico
to overwinter in the oyamel fir forests.
➢ Winter: Enter a state of reproductive diapause (temporary dormancy) until
spring warmth triggers their return migration.
Monarch Butterfly Ecological and Biological Adaptations
• Navigate using the sun’s position and a time-compensated internal compass.
• Store fat reserves to sustain energy during migration and overwintering.
• Sensitive to temperature and photoperiod cues that signal migration timing.
Monarch Butterfly Conservation and Ecological Importance
• Populations have declined sharply due to:
✓ Habitat loss, deforestation, and pesticide use.
✓ Climate change is disrupting migration timing and overwintering conditions.
Common Reasons (Drivers) for Dispersal
1.Avoiding Inbreeding:
2.Escaping High Population Density:
3.Searching for Scarce Resources:
1.Avoiding Inbreeding:
1. Reduces the probability of genetic inbreeding among close relatives.
Example: Young mammals often leave their natal group to mate elsewhere.
2.Escaping High Population Density:
1. Dispersal helps reduce competition for food, space, and mates in overcrowded habitats.
Example: Aphids produce winged individuals under crowded conditions to colonize new plants.
3.Searching for Scarce Resources:
1. Individuals relocate to find new food, territory, or nesting sites when local resources decline.
Example: Juvenile birds often disperse after fledging to find unoccupied territories
Types of Dispersal
1. Natal Dispersal
2. Breeding Dispersal
1. Natal Dispersal
Movement of an individual from its birthplace (natal area) to the location where it first reproduces.
• Common in many animals as a mechanism to prevent inbreeding and reduce competition with parents.
• Example: Young male lions leave their birth pride to join or form new prides elsewhere.
2. Breeding Dispersal
Movement of an individual between successive breeding attempts, usually after unsuccessful reproduction.
• Often occurs when conditions or mates are better elsewhere.
• Example: A bird moving to a different nesting site after a failed breeding season
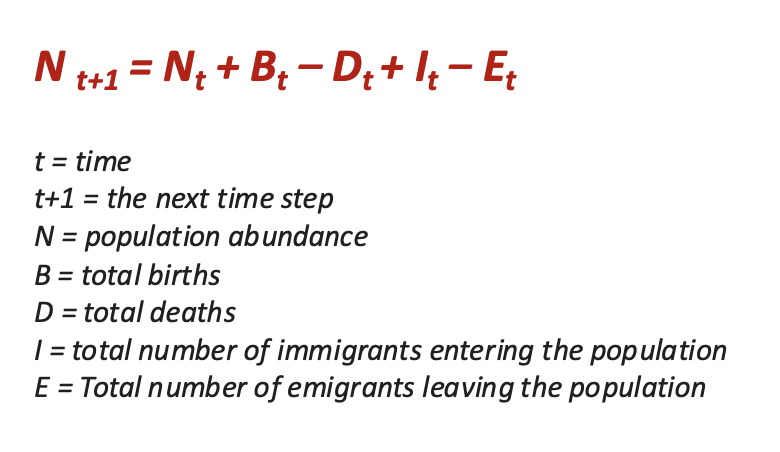
Population Growth Model with Dispersal
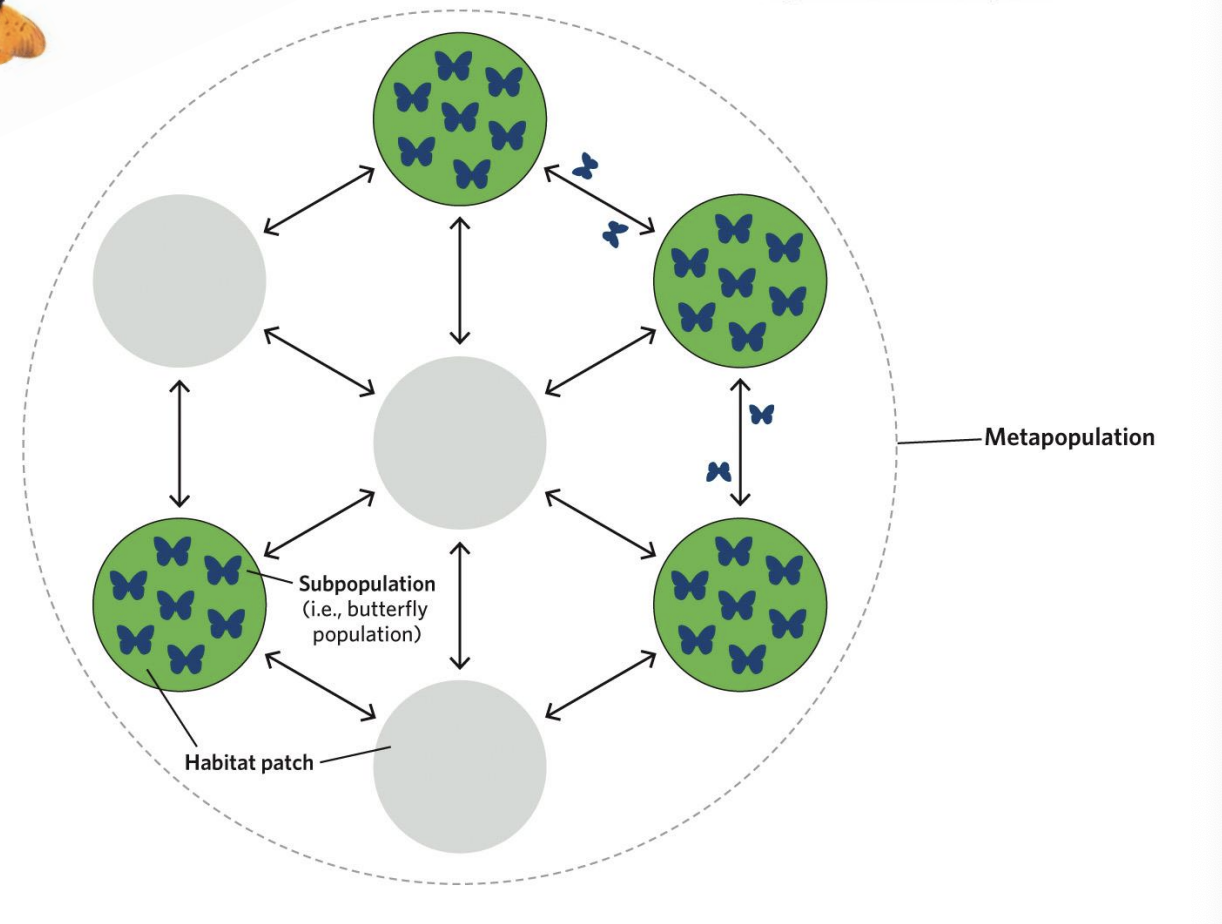
metapopulation
a set of populations of a single species spread across a landscape and linked by dispersal.
classic metapopulation model
habitat occurs in discrete patches
all populations have a substancial risk of extinction
dispersal occurs among all patches
patch dynamics are asynchronous
ignore populatoin dynamics within a patch
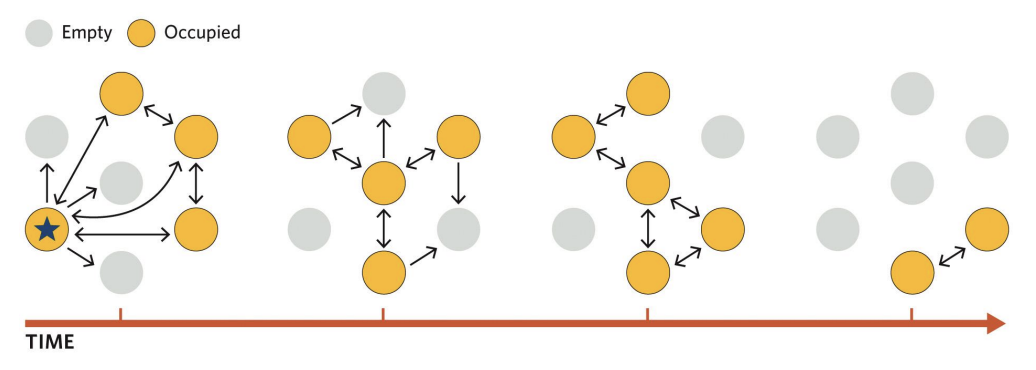
Each subpopulation may go extinct over time,
But the entire network should persist much longer than any single subpopulation
because extinct habitat patches can be recolonized by immigrants from other subpopulations
➢ Unfilled circles represent unoccupied patches.
➢ Arrows represent dispersal.
➢ All possible dispersal arrows for only the left-most occupied patch in the first time step (labelled with a star).
➢ Dispersers can move to any patch from any occupied patch.
➢ Dispersal to an unoccupied patch can lead to a newly occupied patch in the next time step.
➢ Random extinction leads to the loss of the subpopulation on occupied patches.
Species richness accumulates____ and then____ as the sample area increases in size.
quickly at first
more and more slowly
Larger areas are also more likely to have ____, which may support a ____.
more habitats
wider array of species
Island Biogeography
The study of the factors that affect the species richness and diversity of isolated natural communities, such as islands, lakes, or mountaintops.
who developed Island Biogeography
Developed by Robert MacArthur and Edward O. Wilson (1967) in The Theory of Island Biogeography.
Islands serve as ____ for understanding___
“natural laboratories”
colonization, extinction, and evolution.
equilibrium theory of island biogeography
The two opposing ecological processes, colonization and extinction, both operate in real time
The number of species on an island is determined by the balance of these two opposing forces
The number of species on an island reaches an equilibrium where colonization and extinction balance out.
Two key assumptions - Island Biogeography
1. The mainland contains a finite number of species (P),
2. The timeframe is too short to allow any possibility of speciation on the island
Species on small islands are considered more likely to go extinct for at least three reasons.
1. Small islands have fewer resources, leading to smaller populations that are more prone to extinction than larger ones.
2. Small islands have fewer habitats, so each species has less chance to find a habitat where it is the top competitor and can survive as more species arrive.
3. As species richness on an island rises, extinction rates should also increase due to more species going extinct, increased competition for resources, and fewer habitats for each species.
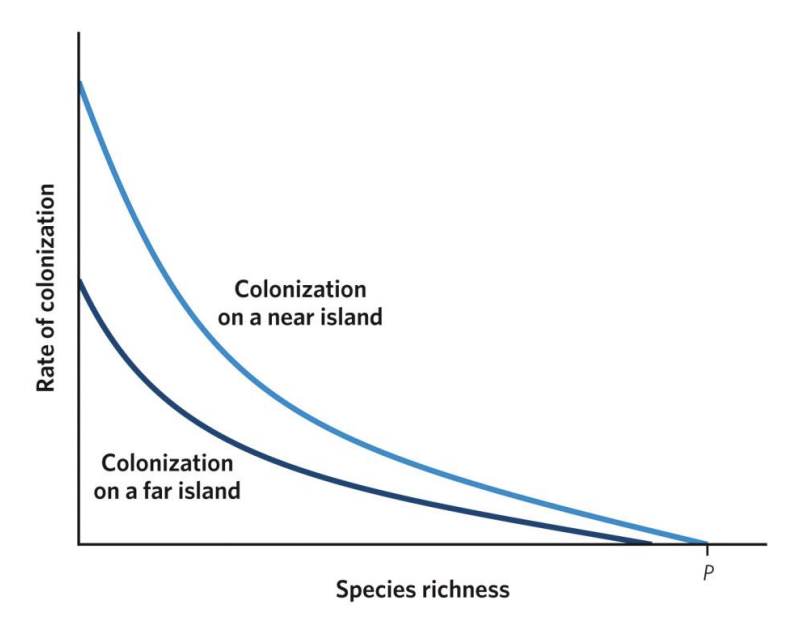
Island Biogeography - rates of colonization vs species richness
As species richness increases, the rate of novel colonizations decreases in near and far islands. Near islands, though, have higher colonization rates (notice that the curve for near islands sits above the curve for far islands) and can acquire a greater total number of species (notice where each curve intersects with the x-axis) because they are more accessible to species with lower dispersal capacity. Although the mainland contains a finite number of species (P), not all of those species may be able to reach the far islands.
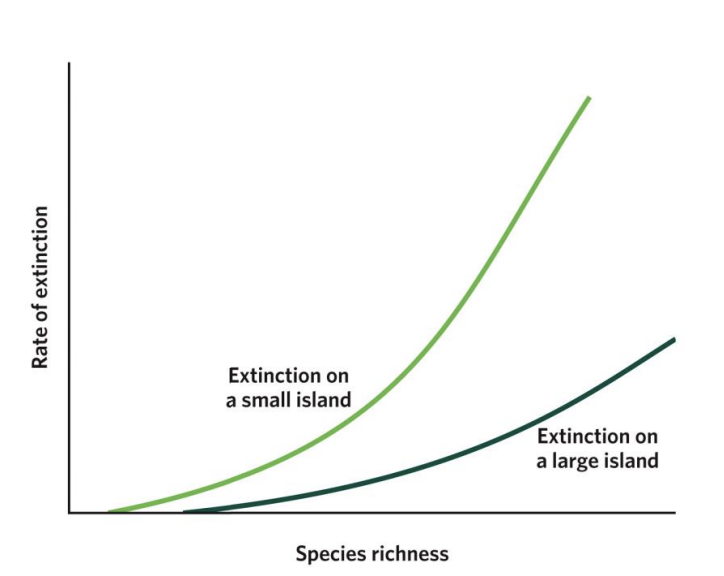
Island Biogeography - rates of extinction vs species richness
As species richness increases, extinction rates also increase, but these increases are different for large islands and small islands. On all islands, having more species leads to more competition, which increases extinction rates. On small islands, low resources, small population abundance, and fewer habitat types cause extinction to start at lower species richness (notice where each curve starts on the x-axis) and increase faster than on large islands (notice that the curve for small islands sits above the curve for large islands).
Equilibrium Points (S₁, S₂, S₃, S₄)
The intersection points of colonization and extinction curves represent equilibrium species richness (S)* — where immigration = extinction.
T₁–₄
represent the turnover rates (how quickly species are replaced)
S₁
Small, far islands (S₁):
Few species; low colonization, high extinction.

s2
Large, far islands (S₂):
More species than small islands but still limited by distance.
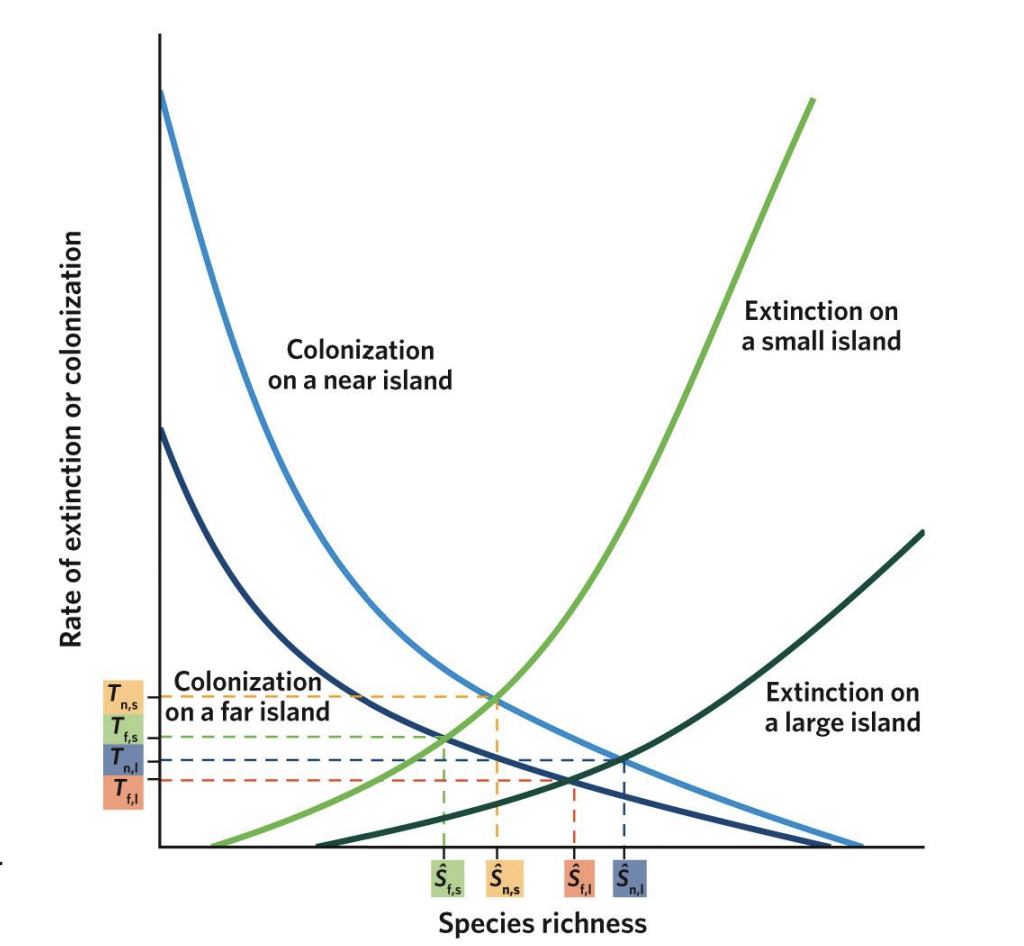
s3
Small, near islands (S₃):
More species than far ones, but higher extinction due to small area.

s4
Large, near islands (S₄):
Highest species richness — low extinction and high colonization.

island type -Large & Near
colonization rate, extinciton rate, species richness, turnover rate, explanantion
colonization rate - high
extinction rate - low
species richness - highest
turnover rate - high
explanantion - Easy to reach → high immigration; large area → low extinction; frequent species replacement (high turnover).
island type - Small & Near
colonization rate, extinciton rate, species richness, turnover rate, explanantion
colonization rate - high
extinciton rate - high
species richness - moderate
turnover rate - highest
explanantion - Close to mainland → many arrivals, but small area → frequent extinctions; dynamic system with high turnover.
island type - Large & Far
colonization rate, extinciton rate, species richness, turnover rate, explanantion
colonization rate - low
extinciton rate - low
species richness - moderate to high
turnover rate - moderate
explanantion - Far distance limits immigration, but large area keeps extinction low; moderate stability.
island type - Small & Far
colonization rate, extinciton rate, species richness, turnover rate, explanantion
colonization rate - low
extinciton rate - high
species richness - lowest
turnover rate - low
explanantion - Few arrivals and high extinction → low diversity and low species replacement (few colonizations).
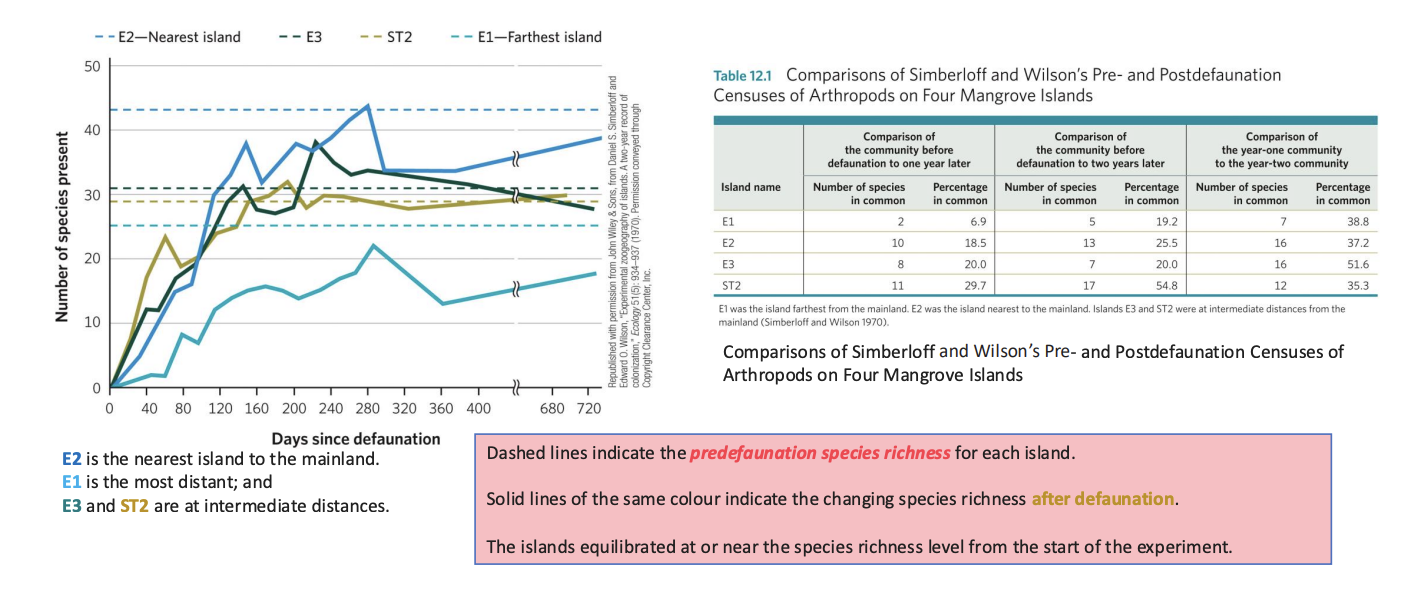
Island Biogeography - Empirical Test: The Mangrove Island Experiment
In 1969, E.O. Wilson and Daniel Simberloff conducted a landmark experiment in the Florida Keysto test their theory.
Island Biogeography - methods
❖ Selected several small mangrove islands.
❖ Fumigated them with methyl bromide to remove all arthropods (insects, spiders, etc.).
❖ Monitored species recolonization over time from the nearby mainland.
Island Biogeography - results
❖ Species numbers initially dropped to zero.
❖ Over time, species recolonized the islands until reaching a stable equilibrium.
❖ Islands closer to the mainland regained species faster and had higher final species richness.
❖ Farther islands recolonized more slowly and reached lower equilibrium diversity.
Island Biogeography - Conclusion
Supported the prediction that island distance and size jointly shape species richness through a dynamic balance between colonization and extinction.
Broader Implications - Island Biogeography
➢ The theory applies not only to oceanic islands, but also to “habitat islands” like mountaintops, forest patches, or nature reserves isolated by human development.
➢ It forms the foundation for conservation biology — influencing the design of protected areas, corridors, and the “SLOSS debate” (Single Large Or Several Small reserves)
Simberloff and Wilson (1970) recorded this pattern of recolonization and equilibration of arthropod assemblages on mangrove islands after the islands were sprayed with pesticide to remove all insects.
how is Nature Dynamic
Before Darwin’s work, nature was typically viewed to be “in balance”, where each species “plays its part” to maintain a stable ecosystem, and where ecosystems always return to a “natural state” after a small disturbance. This view persists in popular culture to this day
Change is the rule rather than the exception.
Communities are dynamic, not static: They change in composition, structure, and function over time.
Ecological succession:
the gradual change in species composition following disturbance or creation of a new habitat.
Disturbances (e.g., fire, storms, human activity) act as
resets that shape community trajectories.
Clements’ Concept of Community
A biological community is a highly integrated, organized unit, like a superorganism, where different species interact and function together in a coordinated way.
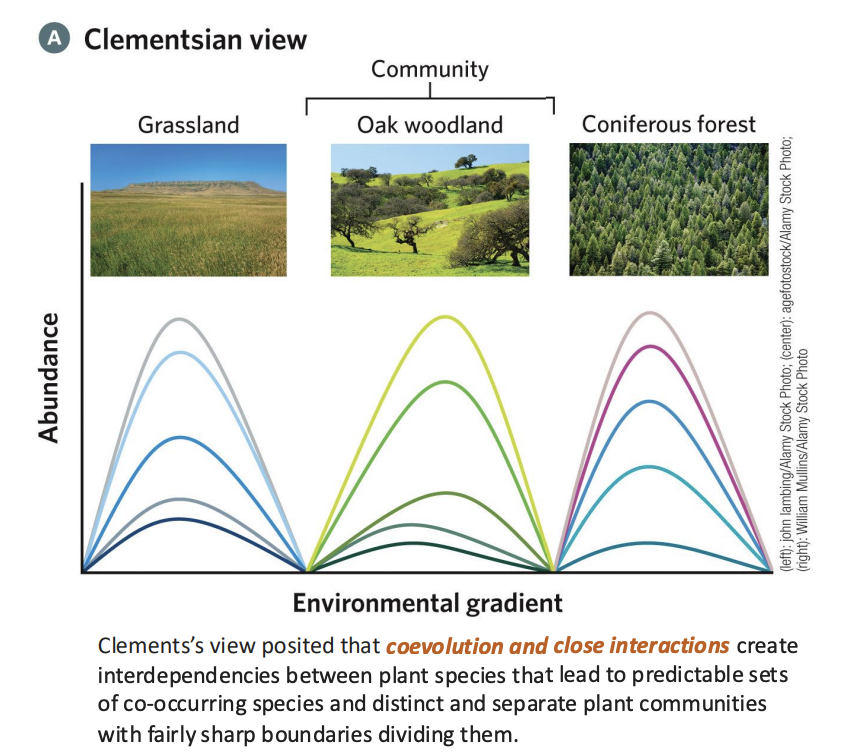
The Superorganism Concept
• A community functions like an organism: it has a life cycle (birth,
development, maturity, and death).
• Species are interdependent, cooperating in predictable ways to form stable, structured units.
Deterministic Succession
• Ecological succession follows an orderly, predictable sequence of stages (seres) leading to a climax community.
• Each stage paves the way for the next—similar to developmental stages in an organism.
Climax Community
• A stable, self-perpetuating end-point determined by climate and soil (the “climatic climax”).
• Represents the final stage of succession, in which the community achieves equilibrium with its environment.
example of Clements’ Concept of Community
Example: In a forest ecosystem: Bare rock → lichens → mosses → grasses → shrubs → trees → climax forest
• Each stage modifies conditions, allowing new species to establish — showing the predictable developmental sequence that Clements emphasized.
Individualistic Concept
• Each species in a community responds independently to environmental gradients (like temperature, moisture, light, or nutrients).
• There are no strict boundaries between communities — species distributions overlap gradually rather than forming distinct units.
Community as a Coincidence
• A community forms when species co-occur whose ecological requirements allow them to persist under the same conditions.
• It is not a tightly knit or co-evolved entity (unlike Clements’ “superorganism” model).
Gleason’s Concept of Community
A community is not a fixed, integrated “superorganism” but rather an individualistic assemblage of species that happen to occur together in a particular place because they share similar environmental requirements and tolerances.

Individualistic Concept
• Each species in a community responds independently to environmental gradients (like temperature, moisture, light, or nutrients).
• There are no strict boundaries between communities — species distributions overlap gradually rather than forming distinct units.
Community as a Coincidence
• A community forms when species co-occur whose ecological requirements allow them to persist under the same conditions.
• It is not a tightly knit or co-evolved entity (unlike Clements’ “superorganism” model).
Non-deterministic Succession
• Ecological succession is not predictable or uniform.
• Community development depends on chance events, such as which species arrive first, seed dispersal patterns, and local disturbances.
No Single Climax State
• has multiple potential stable states, depending on local environmental factors and historical contingencies.
• This view introduces the idea of community variability across landscapes.
Succession
is the gradual, predictable process of change in species composition and community structure in an ecosystem over time. It describes how ecosystems develop, from bare or disturbed areas into more complex and stable communities.
Succession involves a series of stage
from early colonizing species (pioneer species) to a mature, stable community (often called the climax community).
Each stage: Modifies the environment (e.g., adds nutrients, alters soil or light conditions).
Creates conditions that make it easier for other species to establish later.
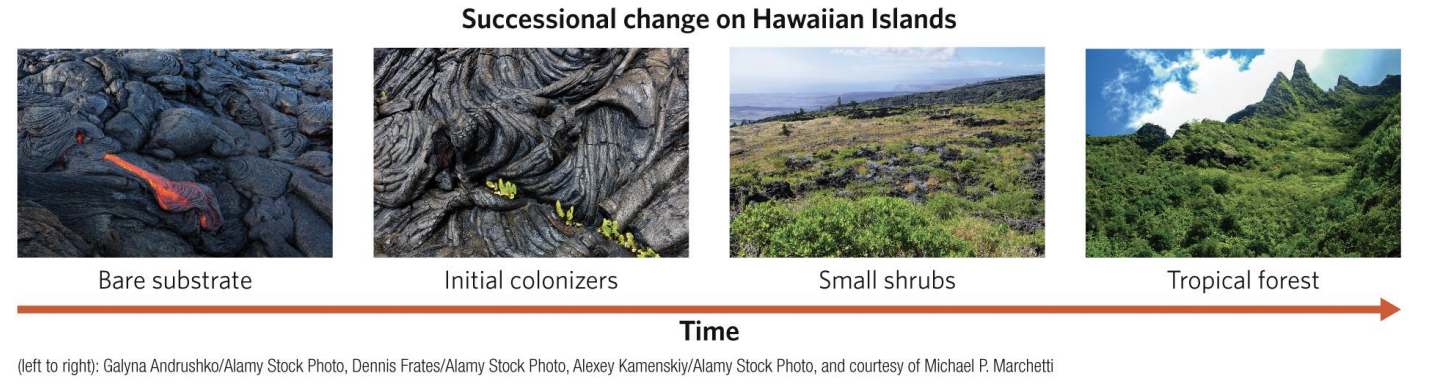
Primary Succession
Primary succession occurs on surfaces where no soil or life previously existed; it starts from scratch.
Primary Succession - Examples
❑ After a volcanic eruption creates new rock.
❑ On glacial retreats, where bare rock is exposed.
❑ Anthropologically initiated sites, like abandoned urban sites, mine tailings
Primary Succession - Process
1. Pioneer species such as lichens and mosses colonize bare rock.
2. They help break down rock and accumulate organic material, forming soil.
3. Grasses, shrubs, and small plants follow as the soil deepens.
4. Over long periods, larger plants and trees establish, leading to a stable climax community (e.g., forest).
Primary Succession - Time Scale
It can take hundreds to thousands of years — it’s a slow process because soil must form first.
Secondary Succession
Secondary succession occurs in areas where a community previously existed but was disturbed or destroyed, and the soil remains intact.
Secondary Succession -Examples
▪ After a forest fire, flood, or hurricane.
▪ Abandoned farmland that becomes overgrown again.
▪ Areas cleared by human activities (e.g., logging)
Secondary Succession - Process
1.Weeds and grasses quickly colonize the area.
2.Shrubs and small trees establish as competition increases.
3.Eventually, a mature community re-forms, similar to the
one before the disturbance.
Secondary Succession - Time Scale:
Faster than primary succession—can occur over decades rather than centuries
Life History
Life history describes how an organism allocates time and energy to: Growth, Survival and Reproduction
Species differ in traits such as:
• Age at first reproduction
• Number and size of offspring
• Longevity
• Parental investment
r-selected species:
fast reproduction, high dispersal, thrive in disturbed habitats (e.g., weeds, insects).
K-selected species:
slow reproduction, high competitive ability, dominate stable environments (e.g., large mammals, long-lived trees).
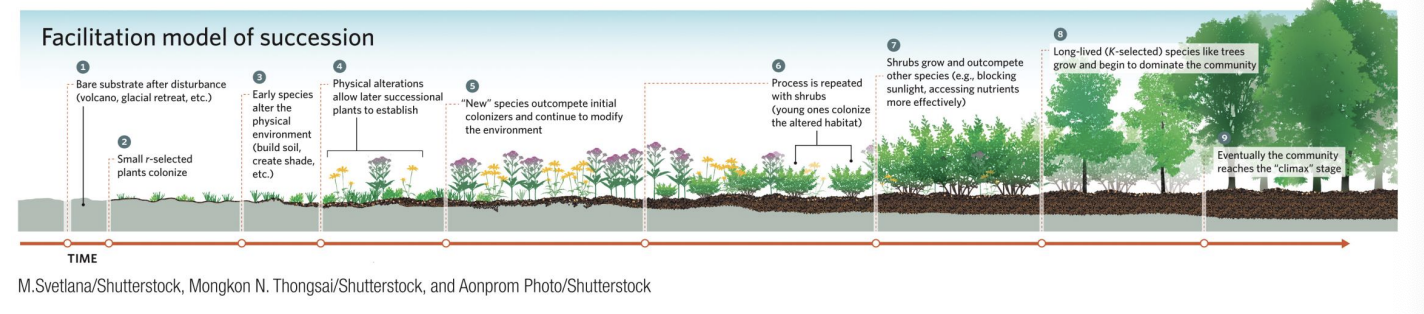
Facilitation Model
▪ In this model of succession, early colonizers grow and provide organic matter that helps break down rock and build soil.
▪ The new soil holds water and nutrients that allow later species to germinate, grow, and eventually replace the early species.
▪ The newer plants add more organic matter and more nutrients and may provide nursery areas for shrubs.
▪ The facilitated shrubs eventually outcompete smaller plants through shading, add more organic material and nutrients, and often change the soil pH.
▪ All of these changes encourage the germination and growth of trees that outcompete the shrubs and form a climax community.
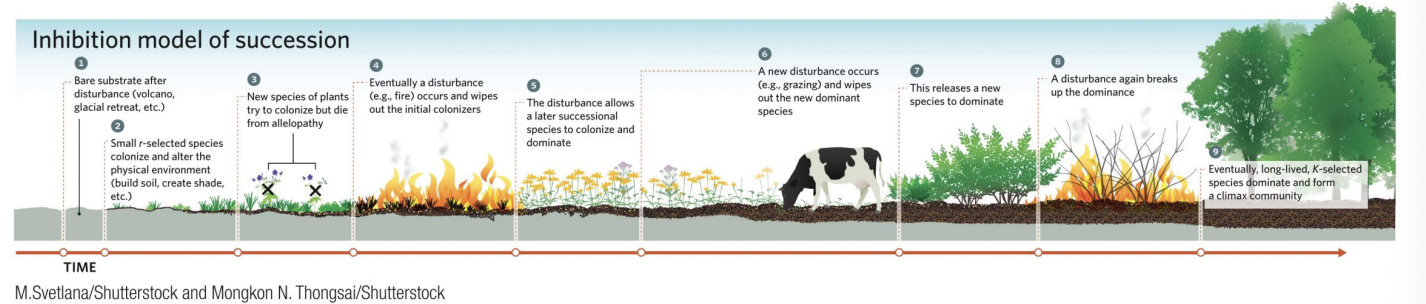
Inhibition Model
If inhibition were dominant throughout the successional process, we might see the stages shown in this example. At each stage, a disturbance, such as fire or grazing, is necessary to remove the dominant early-colonizing species and allow other species to colonize or perhaps eventually to outcompete the early colonizers.
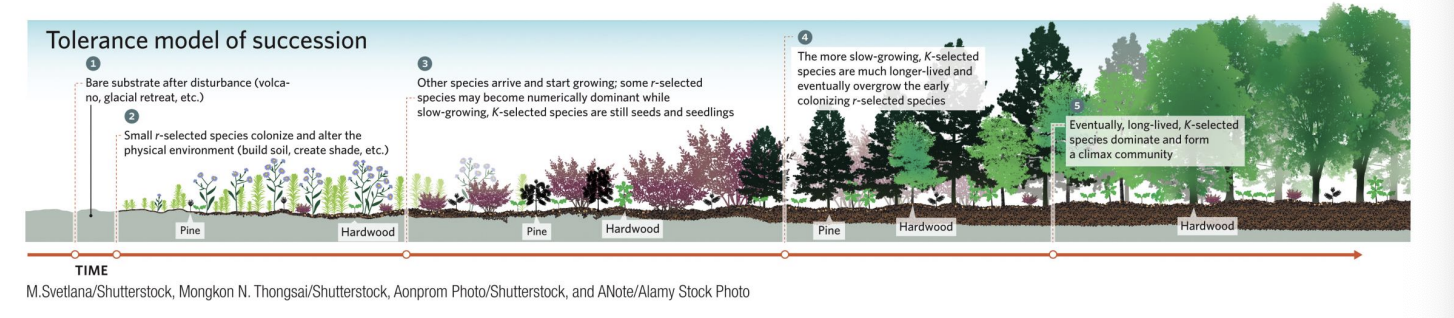
Tolerance Model
Under the tolerance model of succession, species arriving later in the process are neither helped nor hindered by earlier colonizers.
Because later
K-selected species grow slowly,
r-selected species dominate early successional stages
Eventually, the K-selected species outcompete the r-selected species and dominate the community.