ECO- chapter 9.1
1/25
Earn XP
Description and Tags
Name | Mastery | Learn | Test | Matching | Spaced | Call with Kai |
|---|
No analytics yet
Send a link to your students to track their progress
26 Terms
aggregate demand
total amount of real output (real GDP) that consumers, firms, the govt and foreigners want to buy eat each possible price level, over a particular time period
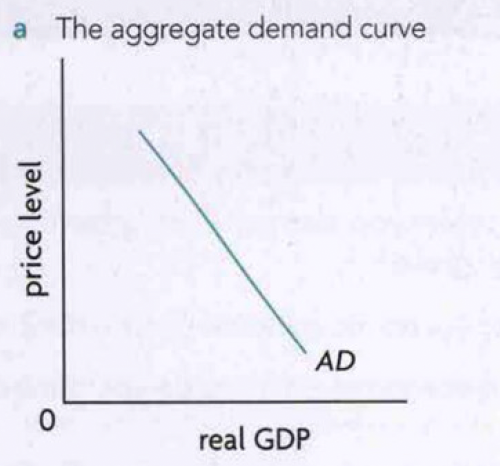
the aggregate demand AD curve
shows relationship between the total amount of real output demanded by the four components and the economy’s price level over a particular time period.
it is downward sloping, indicating a negative relationship between the price level and the aggregate output demanded
aggregate demand curve
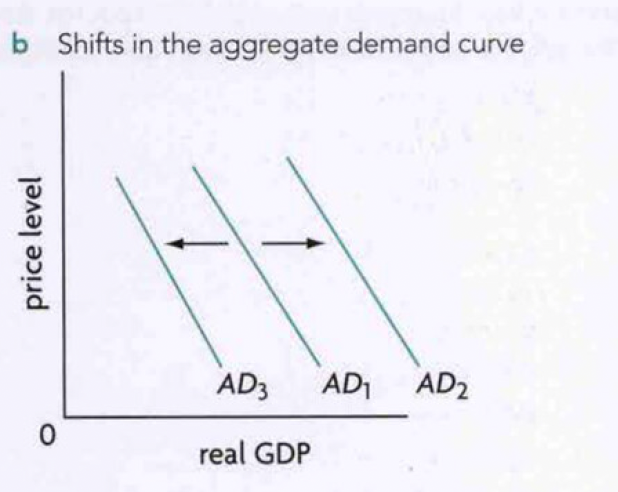
AD curve shifts
rightward shift from AD1 TO AD2 means AD increases: for any price level higher GDP is demanded
leftward shift from AD1 TO AD3 means AD decreases: for any price level a smaller amount of GDP is demanded
shifts of aggregate demand curve are causes by
changes in consumer spending
changes in investment spending
changes in government spending
changes in foreigners’ spending
reasons for changes in consumer spending
change in consumer confidence
changes in interest rates (monetary policy)
changes in wealth
changes in personal income taxes (fiscal policy)
changes in the level of household indebtedness expectations of future price levels
changes in investment spending
changes in business confidence
changes in interest rates (monetary policy)
improvement of tech
changes in business taxes (fiscal policy)
changes in the level of corporate indebtedness legal/institutional changes
changes in govt spending
changes in political priorities
changes in economic priorities: deliberate efforts to influence AD (fiscal policy)
changes in foreigners’ spending
changes in national income abroad
changes in exchange rats
changes in the level of trade protection
change in consumer confidence (change in consumer spending)
consumer confidence is the measure of how optimistic consumers are about their future income and the future of the economy
if consumers are optimistic, they spend more on buying goods and services and AD curve shifts right
low consumer confidence= falling incomes and worsening economic conditions and hence to due to fars of cuts in wgaes or unemployment —> decrease in spending and left shift of AD curve
level of consumer confidence is measured by govts to predict level of consumer spending
changes in interest rates (change in consumer spending)
consumer spending is also financed through borrowing hence interest rates matter
left shift: increase in interest making borrowing more expensive and low consumer spending
right shift: fall in interest rates makes borrowing less expensive and more consumer spending
changes in wealth (change in consumer spending)
wealth is the value of assets people own
increase in wealth makes people feel more reach, thus more consumer spending and right shift of AD curve
decrease in wealth lowers AD and AD curve shifts to the right
changes in income taxes (change in consumer spending)
increase in income taxes would lead to decrease in consumer disposable income hence spending drops and AD curve shifts toward left
lower income taxes would increase disposable income, spending increases AD curve shifts right
change in the level of household indebtness (change in consumer spending)
high levels of indebtedness lower consumer spending and shift AD curve to left because consumers feel pressure to pay the high monthly payments and pay back their loan plus interest.
low level of indebtedness increases consumer spending and ad curve shifts to right
expectation to future price levels (change in consumer spending)
often consumers expect prices to fall or rise and hence delay their consumption
expecting fall- consumer spending decrease- ad curve left
expecting rise- consumer spending increase- ad curve right
change in business confidence (change in investment spending)
business confidence is the optimism businesses have for their future sales and economic activity
if optimistic, they spend more on investment and AD curve shifts to right
if pessimist, results in leftward shift
change in interest rates (change in investment spending)
increase in interest rates raises cost of borrowing, forces businesses to reduce investment spending financed through borrowing. ad curve shift left
if interest rates are low, spending by borrowing at a lower cost, the AD curve shifts right
result of monetary policy
improvement in tech (change in investment spending)
improvements in tech stimulate investment spending, thus causing increases in aggregate demand and a rightward shift in the AD curve
changes in business taxes (change in investment spending)
=taxes on profits (corporate income taxes)
if taxes rise, after tax profits fall and investment spending falls —> left shift in ad curve
decrease in profits on taxes increases aggregate demand and a rightward shift in ad curve
level of corporate indebtedness (change in investment spending)
with high levels of debt due to borrowing, businesses are less willing to make investments and the AD curve will shift to the left
low level of corporate indebtedness, leads to more investment and a rightward shift in ad curve
legal/institutional changes
some countries mostly developing lack laws and institutions for businesses. small businesses face a lot of issues, like not having access to credit fence can do investment spending through borrowing. many developing economies don’t have proper laws for securing property rights (legal rights to ownership). this decreases ad
in such situations, increasing access to credit (ability to borrow) and securing property rights would result in increases in investment spending, shifting AD curve to right
change in political priorities (causes of changes in govt spending)
govts have many expenditure, arising from provision of merit goods and public goods, spending on subsidies and pensions, payments of wages and salaries to employees, purchases of goods for own use and on
increase in govt spending, ad curve right and reverse also
changes in economic priorities: deliberate efforts to influence aggregate demand (change in govt spending)
govts can use its own spending to influence the aggregate demand
changes in national income abroad (changes in export spending minus import spending)
countries are dependant on each other
if country B’s national income increases, it will import more goods and services from country A, so that country A can increase their exports AD curve would shift to the right
if country B, national income falls, country A’s exports decreases and ad curve shifts to left cha
change in exchange rates (changes in export spending minus import spending)
increase in price of a country’s currency has two effects, fall in exports because other countries find it too expensive and increase in imports because imports are cheaper—> ad curve shifts left due to X-M
and opposite
price of country A’s currency decreases exports increase imports decrease —> ad curve right due to X-M
change in trade policies and level of trade protection (changes in export spending minus import spending)
trade protection= restrictions to free international trade often imposed by govts.
take example of country B putting trade restriction on imports from from country A. now country A ad curve to left. for country B lower imports means X-M increases so AD curve shifts to right