Ecology - Mod 17 (Ch 24 + part of Ch 9): Landscape ecology and ecosystem management
1/40
There's no tags or description
Looks like no tags are added yet.
Name | Mastery | Learn | Test | Matching | Spaced |
|---|
No study sessions yet.
41 Terms
landscape ecology
the study of patterns across a landscape, the processes that create and maintain those patterns, and the effect these patterns have on ecological processes
landscape
an area in which at least one element is spatially heterogeneous (i.e. forms a mosaic)
spatially heterogeneous: variable or non-contiguous
element: points or patches clearly distinct from their surroundings
e.g. ecosystem types: e.g. deciduous forest, prairie, lake
e.g. habitat types: e.g. trees, bushes, large rocks
e.g. habitat characteristics: e.g. forest ages, soil types (sand, clay)
e.g. usage: e.g. recreation, urban, farm
the research question determines which elements are considered
describing landscape heterogeneity
landscape composition
landscape structure
landscape heterogeneity: landscape composition
the kinds of elements or patches in a landscape and how much of each kind is present
e.g. delineating Greater Yellowstone Area based on various landscape elements: Lodgepole pine:
what are the age classes of patches of L.P. pine in an area?
how many patches of each age-class of LP pine are there?
what is the total area of each age-class of LP pine?
landscape heterogeneity: landscape structure
the physical configuration of the different elements or patches
e.g. in delineating Greater Yellowstone Area based on various landscape elements: Lodgepole pine
patch sizes relative to another?
patch arrangement relative to one another?
are patch shapes simple or complicated?
how fragmented are patches?
ecological scale
the spatial or temporal dimension of an object or process
the pattern detected in any ecological mosaic is a function of this
a landscape may be heterogeneous at a scale important to one organism, but homogeneous at a scale important to another
e.g. same landscape relative to a beetle vs a duck
essential to consider when designing ecological studies
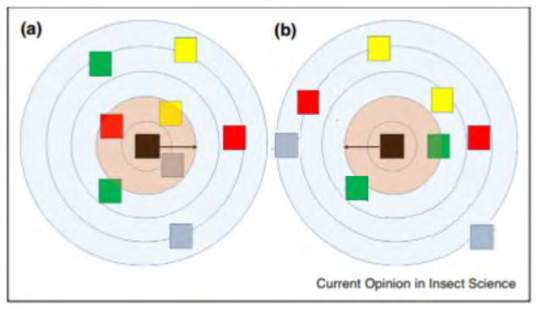
effects of spatial scale on measures of landscape complexity
number of habitat types increases with spatial scale
assuming there are two sampled areas with the same amount of habitat types, but different spatial distributions:
a study of the entire area for both areas will yield the same results
more limited spatial scales will yield different results (see picture)
effect of temporal scale on measures of heterogeneity
e.g. vegetation moisture
within a particular year, vegetation moisture level may be relatively stable
over time there is substantial variability
characterizing scale
extent and grain
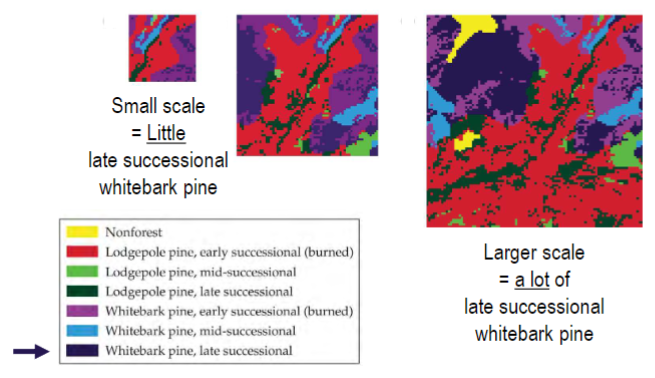
extent
the area or time period encompassed by a study
determines the outcomes so it must be chosen based on the research question
e.g. whitebark pine: small scale = little late successional pine; larger scale = a lot of late successional pine
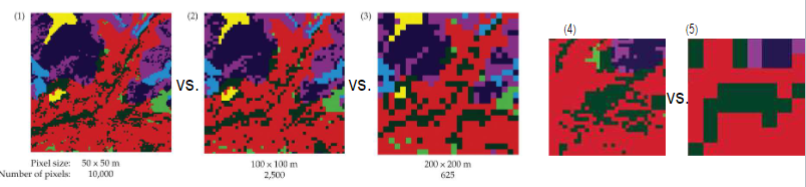
grain
the size of the smallest homogeneous unit of study
determines the resolution at which a landscape is studied and the quantity of data which must be compared
fine-grained studies allow greater differentiation of elements but require more data to be compared
larger-grained studies are better when looking at regional to continental patterns
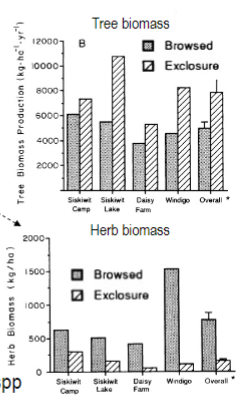
example of understanding processes that cause/maintain patterns: moose
Isle Royale - Lake Superior
exclosures have been used since 1940 to see the effect of moose browsing on vegetation
moose browsing: alters forest structure (decreases tree biomass, increases herb biomass because of increased light), alters tree spp composition (increases spruce biomass, decreases balsam fir and dogwood biomass), affects amount of leaf litter (thus nutrient availability and thus primary productivity)
these changes likely also affect many animal spp
example of understanding processes that cause/maintain patterns: fragmentation from clearcutting
question: does fragmentation from clearcutting mimic the effects of natural fragmentation caused by fires?
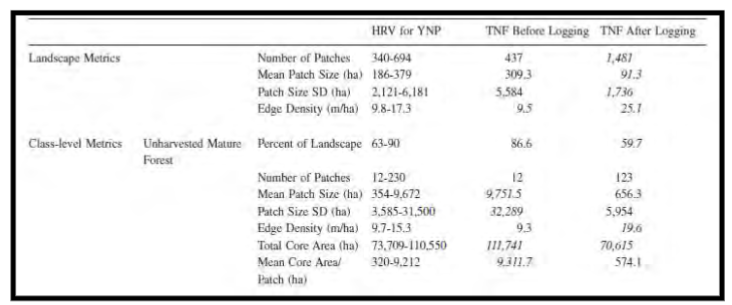
to test: Tinker et al (2003) compared forest structure in 2 adjacent forests in the Greater Yellowstone Area; fragmented two different ways
YNP: fragmented by natural fire
TNF: fragmented by clear-cutting
prior to logging, TNF was within historic range of variability (HRV)
after logging, many metrics were not withing HRV:
indicates that fire- and clearcut-caused fragmentation have different long-term effects
indicates that 3 decades of timber harvesting has dramatically altered landscape structure
how patterns affect ecological processes
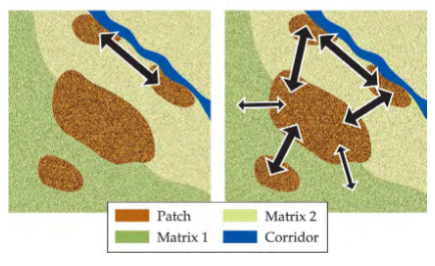
landscape structure affects movement
for movement between patches to occur, patches must be directly connected or the surrounding habitat (matrix) must be suitable for dispersal
landscape structure affecting movement: butterfly example
e.g. bog fritillary butterfly movement patterns:
many 180* turns occurred in highly fragmented study area; indicated that butterflies tended to turn around at the edge rather than leave the patch
in moderately fragmented areas, patches were closer together, and butterflies readily crossed between patches
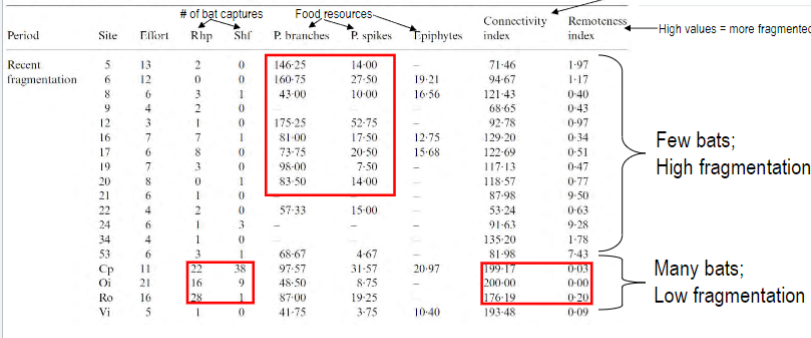
landscape structure affecting movement: fruit-eating bat example
e.g. fruit-eating bats in tropical rainforest fragmented by reservoir construction
landscape connectivity index (high value = less fragmented) and remoteness index (high value = more fragmented) were calculated for many study sites
more isolated fragments were less likely to be visited by bats even though they contained abundant food sources
foraging movements of bats are not well adapted to habitat fragmentation, preventing them from reaching these resources (despite being highly mobile and feeding on highly scattered fruits)
disturbance and heterogeneity
disturbance shapes landscape heterogeneity, and is shaped by landscape heterogeneity
e.g. landscape fires of 1988: fires burned through forest patches of different ages and spp compositions, had different intensities and effects based on these varied patches, leaving behind a mosaic patches burned at different intensities
reciprocal interactions: disturbance shaped landscape pattern, but landscape pattern determined fire characteristics (disturbance)
landscape legacies
effects of altered landscape continuing long after a disturbance (e.g. humans) has left
e.g. Roman farm settlements abandoned for ~1600 years still shows altered landscape
higher plant spp richness in forests that grew back than in the surrounding area; soil with more phosphorus and higher pH from lime mortar?
habitat fragmentation
the process by which habitat loss results in the division of a large, continuous habitat into multiple smaller, isolated remnants
effects of loss of area
loss of area → decreased resources → loss of:
spp that need large amounts of resources (which may now be less abundant)
wider ranging spp (need more area to acquire enough resources)
these changes lead to wider spp composition changes
e.g. Venezuelan Amazon rainforest, 1.1 million acres flooded to make new electric dam; created many patches (islands) of varying sizes and distances from mainland
small/medium sized islands lacked top predators (e.g. jaguars, pumas, ocelots, hawks, snakes) and wide-ranging herbivores, frugivores, and pollinators → hyperabundance of many herbivore spp (e.g. leaf-cutter ants, birds, rodents, monkeys) → dramatic effects on vegetation → higher tree mortality, fewer new trees (seedlings, saplings)
human health consequences from habitat fragmentation
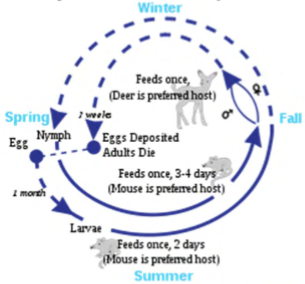
e.g. Lyme disease caused by Borrelia type
deer ticks usually acquire bacteria in nymph stage from mouse, chipmunk or birds, rarely deer
tick must be usually attached to a human for 36-48 hours before the bacteria can spread
nymph tick is most likely to spread disease since it is small and more likely to go unnoticed for long periods
transmission is rare, only 1% of recognized tick bites resulting in Lyme disease
early symptoms: rash, fever, headache, lethargy
if untreated, may cause facial paralysis, joint pain, severe headaches
increased mouse densities in smaller forest fragments in Hudson River valley (likely due to lack of predators) → increased infected deer tick nymphs → increased Lyme disease
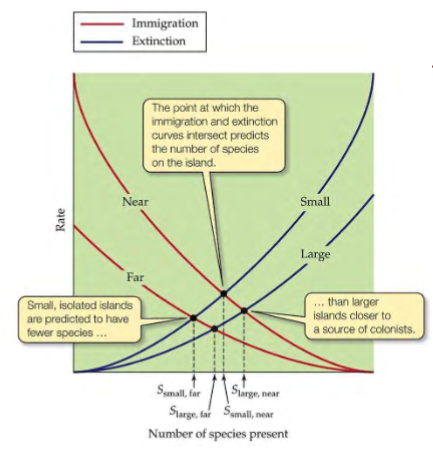
early models of habitat fragmentation
derived from island biogeography theory
the # of spp in a fragment depends on size of fragment and distance of the fragment to a large contiguous forest source
e.g. documented in Brazil: fragments of different sizes and distance from sources had differences in spp abundance and composition
matrix between habitat fragments
complex
consists of different patches that vary in permeability
permeability of matrix varies among spp
e.g. Castellon and Sieving tested matrix permeability for an understory bird; birds were moved to fragments in open and shrub habitats
birds in fragments surrounded by pasture were reluctant to move; birds surrounded by shrubby matrix or with a corridor were more likely to move
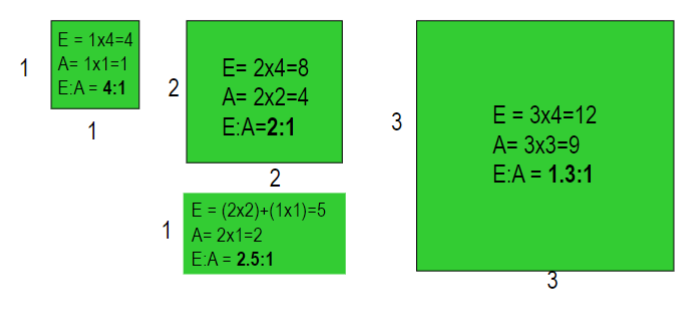
edge to area ratio
increases in smaller fragments
e.g. 1×1 square E:A = 4:1
2×2 square E:A = 2:1
2×1 rectangle E:A = 2.5:1
3×3 square E:A = 1.3:1
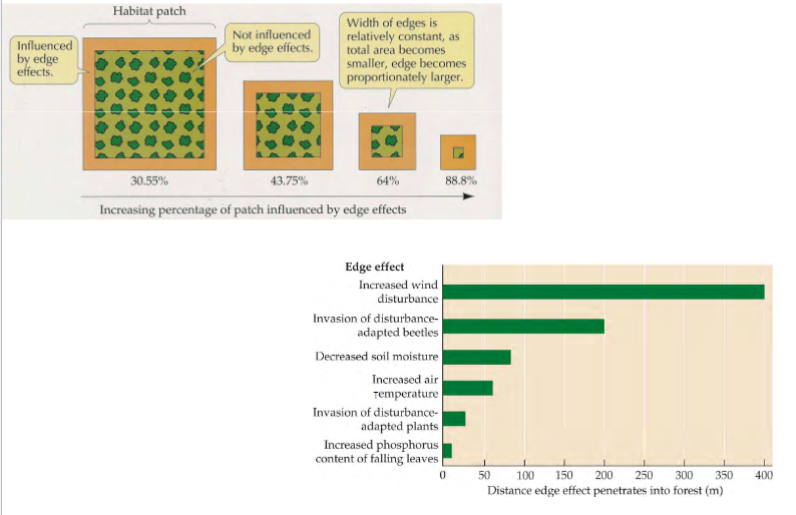
edge effects
deforestation creates new edges, exposes organisms once surrounded by forest to new abiotic and biotic conditions
increased E:A ratio leads to increased light penetration, microclimate shifts (change in temp and/or humidity), easy access and exploitation of interior resources (by predators, herbivores, diseases, non-native spp, humans)
smaller fragments are affected by more edge effects
edge effects lead to spp loss and homogenization (fragments with similar spp composition)
e.g. before: diverse mix of interior and edge spp
after: many interior spp lost and increased abundance of edge spp
across landscape, different patches are relatively similar having few interior spp and most of the same edge spp
habitat corridors
linear patches that connect habitat patches
can help maintain biodiversity in a fragmented landscape
connectivity can reduce effects of fragmentation by preventing isolation of populations
e.g. rivers and riparian corridors: essential to both aquatic and terrestrial spp
Riparian zone: area adjacent to rivers or streams (may contain upland forest or wetlands)
e.g. land bridges
effectiveness: good at facilitating movement of animals (e.g. butterflies, pollen, bird-dispersed fruits); also introduced predators/invasive spp/pathogens in between patches (e.g. indigo bunting nest predation increased)
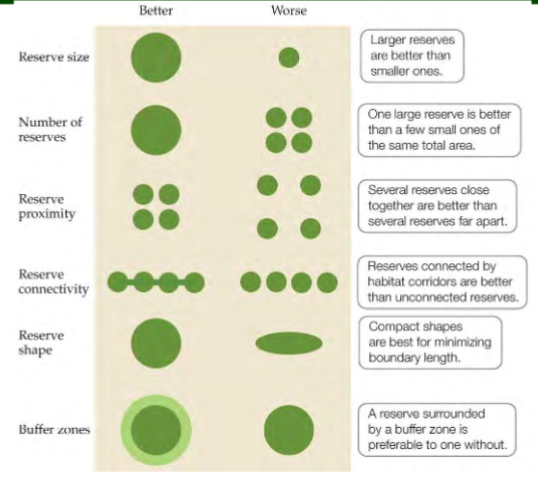
nature reserve design guided by fragmentation effects
larger reserves > smaller reserves
one large reserve > a few small ones equaling the same total area
several reserves close together > several reserves far apart
reserves connected by habitat corridors > unconnected
compact shapes > stretched shapes (minimize boundary length)
reserve surrounded by a buffer zone > one without a buffer zone
patchy landscapes
most landscapes are patchy; not continuously distributed throughout a region
broken into smaller suitable areas separated by unsuitable areas
unsuitable areas create nearly uncrossable barriers for some spp
other spp can move more easily across unsuitable areas → allow populations in each to interact (gene flow)
increased movement between patches = increased genetic similarity among patches = decreased likelihood that an organism will go extinct from a patch
e.g. Florida scrub ecosystems, very patchily distributed (yellow in picture)
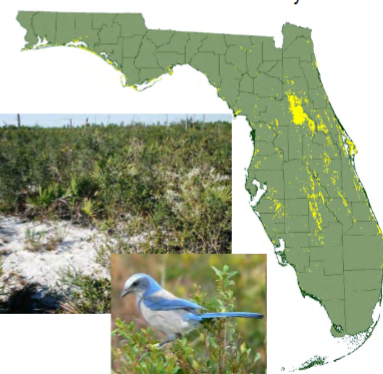
metapopulation
a set of subpopulations interconnected by occasional movement between them (i.e. gene flow)
subpopulation
individuals living in a suitable habitat patch
habitat patch
area with necessary resources and conditions for population persistence
some suitable habitat may be unoccupied
occupied/unoccupied status of patches may change
as long as at least 1 patch is occupied, the metapopulation persists
3 processes occurring in a metapopulation which determine the probability that it will persist
persistence of a subpopulation
extinction of subpopulations
colonization of empty patches forming new subpopulations
local persistence of an individual patch is not as important as regional persistence (if a subpopulation goes extinct, the metapopulation sill exists, but if all subpopulations go extinct then the metapopulation is extinct)
rate of movement between subpopulations
determines if a metapopulation exists
if movement between subpopulations is frequent: little fluctuation in N within each subpopulation; patches don’t go extinct; allele diversity is the same in all patches; subpopulations behave more like one large population with clumped dispersion; NOT a metapopulation
if movement between subpopulations is infrequent: subpopulations behave independently (i.e. N is not affected by other subpopulations); subpopulations are not reestablished once extinct; leads to extinction of subpopulations and eventually of metapopulation; NOT a metapopulation
if movement between subpopulations is intermediate: there is a shifting mosaic of occupied and unoccupied patches; IS a metapopulation
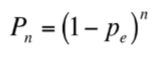
mathematical model of local persistence probability
Pe = probability of extinction
n = # of time steps
positively related to local population size
lower probability of local persistence = fewer time steps the population will persist
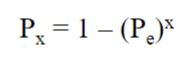
mathematical model of regional persistence probability
probability at least 1 patch remains at t+1
probability all patches don’t simultaneously go extinct
Pe = probability of extinction
x = # of patches
inreasing x spreads risk of extinction and increases the probability of regional persistence to the next time step at a given local probability of extinction
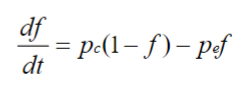
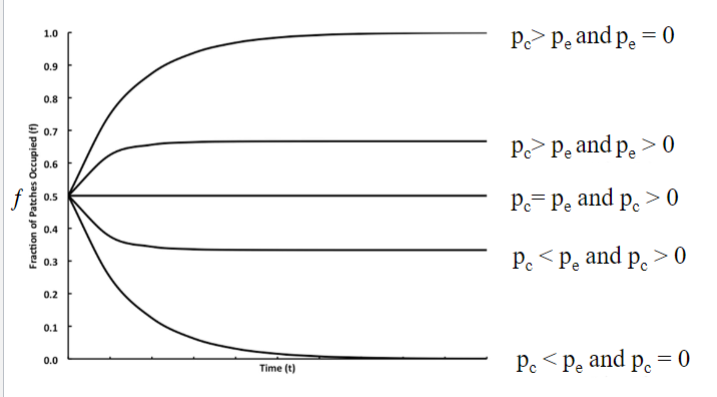
general model of metapopulation dynamics
change in the proportion of occupied sites over a very small amount of time
proportion of occupied sites at any one time depends on rate at which patches are colonized and go extinct (i.e. a balance between colonization and extinction)
Pe = probability of extinction
Pc = probability of colonization
f = fraction (proportion) or occupied patches
metapopulation dynamics as a graph/function
metapopulation model assumptions
(assumption: conditions that, when true, allow the model to more accurately make predictions)
patches are homogenous (i.e. no variation in size, habitat quality, degree of isolation, etc.)
probability of colonization (Pc) is constant and equal for all patches (does not differ between time t and t+1 nor between patches)
probability of extinction (Pe) is constant and equal for all patches (does not differ between time t and t+1 nor between patches)
the intervening matrix does not affect Pc and Pe
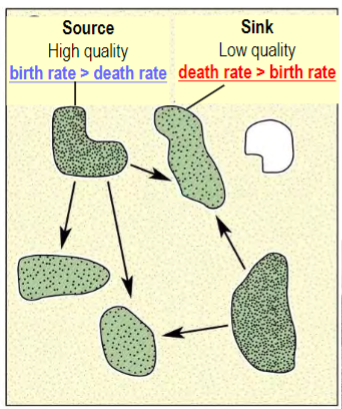
source-sink model
a modification of the metapopulation model that eliminates the first three assumptions (patches are not homogeneous and Pc and Pe are not equal for all patches)
patch quality differs, thus Pc and Pe also differ (i.e. size, resources, predators, diseases, competitors, etc affect Pc and Pe)
low quality patches are repopulated by excess offspring from high quality patches (rescue effect); buffers a population from extinction due to poor quality habitat
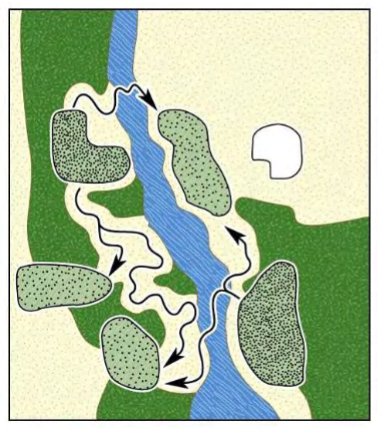
landscape model
modification of the source-sink model that eliminates the last assumption (the intervening matrix does influence Pc and Pe)
matrix influences movement between patches, patch quality due to what is in the matrix
positives in patch quality from matrix: food, roosts, nesting material, pollinators
negatives in patch quality from matrix: predators, disease
how habitat fragmentation causes metapopulation extinction
even when suitable habitat remains, fragmentation can cause extinction of a metapopulation
Pc decreases since patches become harder to reach
Pe increases as patches become smaller with smaller populations