DATA 475 Midterm
1/37
There's no tags or description
Looks like no tags are added yet.
Name | Mastery | Learn | Test | Matching | Spaced | Call with Kai |
|---|
No analytics yet
Send a link to your students to track their progress
38 Terms
Shannon information: formula and how the base changes
h(x) = log2(1/p(x)) = -log2p(x)
The logarithm base is based on the number of options: binary questions have base 2, 3 answer questions have base 3
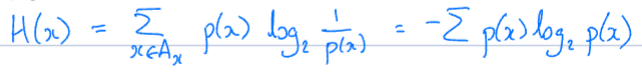
Entropy: formula, what it measures, and how values correspond to outcome probability
Formula
sum of Shannon information with an additional p(x) term
x = event, A_x = set of events that can happen (all possible options)
Entropy is a measure of uncertainty, unpredictability, or ‘surprise’ associated with a random variable’s possible outcomes
Higher entropy = lower predictability, lower entropy = more certain or biased system
Information Gain: What is it used for? How do you calculate it?
Info gain is used to measure the change in entropy; used to determine which feature gives the most info, and therefore decreases entropy the most
Information Gain = Entropy(S) - ∑feature f (|Sf| / |S|) Entropy(Sf)
For worked example, see 475 Assign 1
Decision tree: how do the terms ‘greedy’, ‘Occam’s Razor’, and ‘inductive bias’ relate to it?
Greedy - DT always picks feature that gives the most info now, doesn’t think about the future
Occam’s Razor - simple solutions are better than long and complicated ones; so small trees are good
Inductive bias: the idea that you build on what you’ve already got, so if you make all your big decisions at the top, everything else will get easier
For DT: put highly informative features at the top of the tree
highly informative features are the ones closest to slipping the data into equally l likely parts; as splitting things evenly with give the most efficient tree
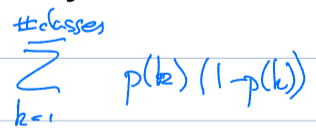
Gini impurity: what does it measure, and what is the formula?
Gini impurity measures the probability of getting the wrong class if you chose randomly from the data distribution
measures the frequency with which a randomly chosen element would be incorrect labeled if it were randomly labeled according to the data distribution
Used to evaluate node putrid, with lower values indicating cleaner, more homogeneous nodes
You want to pick the one that makes Gini impurity the worst
when you have no info closer to the top of the tree, just picking randomly is alright; but this gets worse to do as you go lower down the tree
Is there any randomness in the decision tree algorithm? How do you make the trees different?
No randomness in DT algorithm!
Make the trees different by
varying the feature set for each tree
varying the data set - done in bagging
or both! - Random Forest
Bagging: what is it? how does it apply to decision trees?
Bootstrap aggregation (bagging)
Bootstrap sample: a sample the same size as the dataset, taken with replacement
Every time you take a sample out, you put it back in so you can sample it again
Ex: data set has 100 things in it, so you make a sample that has 100 things in it
Some of them will be in this new data set lots of times, some one or two times, and some not at all
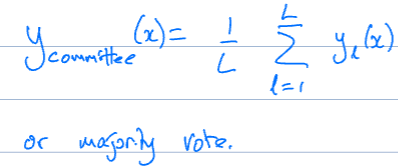
Decision Trees:
For each of L trees:
Sample with replacement to get a new dataset
Train the tree on the dataset
Randomness comes only from sampling
Trivial to parallelise because every processor gets its own independent tree
Result on test set is average or majority vote
Random Forest: how does it work?
Random Forest
For each of L trees:
Get a bootstrap sample
Use that sample to train, but:
At each node only consider m randomly selected features to choose from
Stumping: what is it used for? how does it work?
Stumping /\
A way to ensure trees are weak by just limiting depth (another way would be to make the whole tree and prune it)
“One choice” - you can only ask about one feature
We want to choose the features that split the data 50/50 on either side. Unless your data is perfectly split, it’s going to be biased to one side or the other.
Definitely weak, but as long as they are better than 50% right, it will work
Boosting: what is the idea? how does it work? what learners can it be used with?
Idea: get the learners to improve each other
Boosting
Train tree 1 on the data
Run it on the training data, keep track of the data points it gets wrong
Make those data points more important
using weights
Train tree 2 on that data
Repeat until you have enough learners
Take what tree 2 got wrong, amplify them for tree 3, train tree 3…
Because of the focus on different data points, the resulting trees are different
CANNOT BE PARALLELISED cuz each tree builds on the previous one
Boosting works with various ‘weak learner’ classifiers
including decision trees, logistic regression, SVM, neural networks, and Naive Bayes
Challenges with non-DT learners:
high cost / computational inefficiency with NNs or complex SVMs
overfitting with strong learners (best when base learners are weak)
best with high-bias, low-variance classifiers like DTs; low-bias, high-variance like SVMs can lead to unstable model
reduced interpretability (reduced insight into how model makes decisions)
sensitivity to noise/outliers
Explain majority vs weighted majority vs randomised majority voting.
Majority
Final label is what majority (>50%) of learners chose.
Weighted Majority
Final label is based on whichever label has a greater summed weight from the learners that chose it (each learner’s weight contributes to that label’s sum)
Set up a vector of weights, one for each learner, initially all as 1; then reduce weights for those that are wrong
gives more weight to learners that are more consistently correct
Randomised Majority
Final label is based on a randomly selected single learner
If some learners are good and some are bad, then the learners with high weights are more likely to be picked.
Initialise each learner’s weight to 1
For each datapoint:
Add up the weights
Choose learner l with probability w_l/w
Make the prediction that learner says
Reduce the weight for those that get it wrong
Bias and variance: what are they? what is the bias-variance tradeoff?
Bias:
measures how far off predictions are from the true values due to overly simplistic assumptions; how wrong your model is on average (systematic error)
high bias model = simple and fails to capture complexity of data, low bias = good fit to training dataset (accurate models true relationship)
Variance:
captures how much predictions fluctuate based on different training data
high variance implies that the model does not perform well on previously unseen (testing) data; low variance implies the model performs well on test set (consistent results)
These are both reducible errors, noise is irreducible error
Overfit models have low bias + high variance, underfit have high bias + low variance
Bias-variance tradeoff:
In general, as variance reduces, bias gets higher, and vice versa
linear: very simple (high bias), low variance
non-linear: low bias, high variance
How does the bias-variance tradeoff relate to bagging, random forest, and boosting?
Bagging and Random Forest
Train many models independently, then averages them
Reduces variance due to averaging ‘cancelling’ out randomness; avoids overfitting
Can be high bias if not adequately modeled
Boosting
Trains models sequentially, focusing on the errors of the previous one
Reduces bias b/c models become more accurate over time
Can increase variance due to noise sensitivity / can overfit
What are the mean and variance? Why use sum of squares rather than just sum up the values?
The mean minimises the sum of square distances to each datapoint
the point the data would balance around
The variance is the expected value of the difference between each data point and the mean squared
still a sum of squares minimiser thing, but it’s telling us how spread out can we expect the data to be
Why do the sum of the squares? (rather than just sum the values)
1) We want to be sure positive and negative values do not cancel out
2) It’s easy to differentiate f(x)2 and its symmetric
parabola behaves well - comes down nicely and goes up again, so it's easy to find when you got to a bottom point)
What is the process from which data comes from?
y = f(x) + ε
We assume there is known function f(x) that generates it and is deterministic (if you give it the same input, it will generate the same data point)
What causes the variance in the data then?: noise (ε), the stuff we don’t have control over
We usually assume it is Gaussian with a mean = 0 and variance
We assume Gaussian because of the law of large numbers: “If you get enough randomly distributed things, they will look Gaussian.”
We fit a machine learning model here(x) to minimise the sum of squared differences (between actual answer and prediction)
learning is changing model parameters in h(x) to minimise error
What are the different types of random variables? Different types of probability distributions?
RVs
Discrete, finite outcomes
E.g. number of wins in a sports season (numerical), rat trapped or not (categorical)
Discrete, infinite (countable)
E.g. number of patients arriving at hospital in 1 day
Continuous infinite (uncountable)
E.g. height
Probability Distributions Family = distribution with same shape, different parameter values
Discrete (Bernoulli)
the support of the distribution (i.e. the set of possible things that can happen as an outcome) are ‘yes’ and ‘no’
Binomial
E.g. Number of students in the class with brown hair
Distribution is like of a discrete graph with a sort of peak in the middle
Continuous (Normal)
The support of this distribution is going to have some sort of lower and upper limits
but you’ve essentially got infinitely many possible outcomes

Expected value: what is it? How do you calculate it?
Expected value is the long-term average / typical value of a random variable
its used as a decision-making rule
Can extend to expected payoff:
E[R] = ∑R(x)P(x=x)
sum up the reward * event probability for all events x
![<ul><li><p><span style="background-color: transparent;">Expected value is the long-term average / typical value of a random variable</span></p><ul><li><p>its used as a decision-making rule</p></li></ul></li></ul><ul><li><p>Can extend to expected payoff:</p><ul><li><p>E[R] = ∑R(x)P(x=x)</p><ul><li><p>sum up the reward * event probability for all events x</p></li></ul></li></ul></li></ul><p></p>](https://assets.knowt.com/user-attachments/d245b241-2634-410f-8e40-15cd87e3a4e9.png)
What are
marginal probability (plus how do you calculate it?)
conditional probability
joint probability (plus how do you calculate it?)
Marginal:
P(A), marginal probability of A, regardless of what’s going on with B
calculate by summing up all joint probabilities involving P(A)
Conditional:
P(B | A) = P(B ; A) = conditional probability of B given A has occurred
Joint:
P(A, B) = P (A ∩ B) -> joint prob of A and B occurring
joint probability = marginal * conditional
P(A,B) = P(B|A)P(A) = P(A|B)P(B)
Baye’s Rule: formula? What is it used for?
P(A|B) = P(A)P(B|A) / P(B)
Used to update the probability of a hypothesis or belief as more evidence or information becomes available.
Main point is to reverse conditional probabilities — allowing us to find the probability of a cause given an effect, based on knowledge of the effect given the cause.
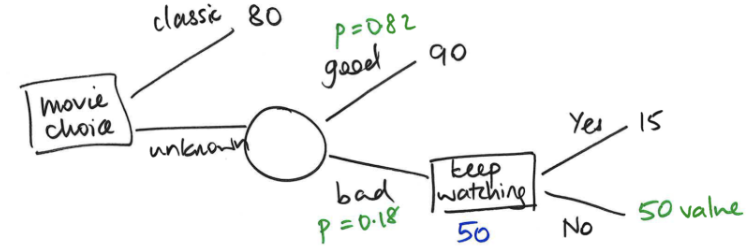
How do you draw a decision tree?
Decision Node
Random Node
Option
Probability
Expected return
Actual return
Expected return = non-leaf node
Actual return = leaf node
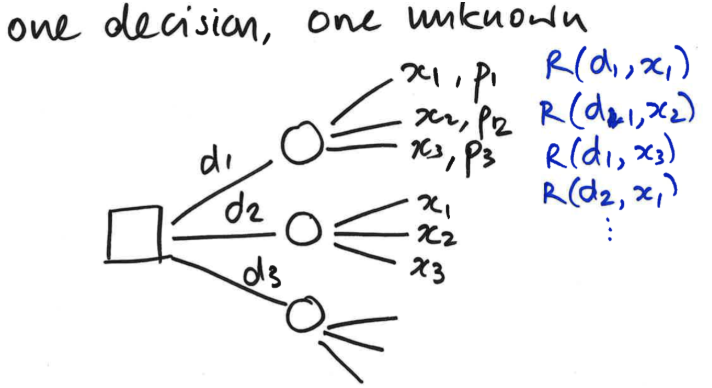
What is a scenario to draw a decision table instead of a decision tree?
There’s a random outcome that is happening regardless of which decision you make, so you end up with a tree where you are replicating these three x branches
You’re going to have different payoffs depending on the decision you went down; but you’ve got the same set of options
In this circumstance, it is easier to draw a table that cross-tabulates the decision with the different outcomes
x1 x2 x3d1
d2
d3
Explain the following decision making rules:
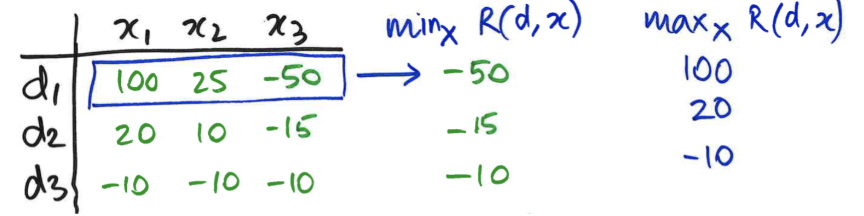
max expected return
maximin
maxima
Max expected return: pick the decision for which the expected return is the highest
Maximin: Pick decision for which minimum payoff is highest (min over outcomes; max over decisions)
Maximax: Pick decision where max payoff is the highest (choosing best possible outcome, ignoring all the ways it could go wrong)
^ these two are each only taking into account one outcome on each row, which isn’t looking at the whole picture
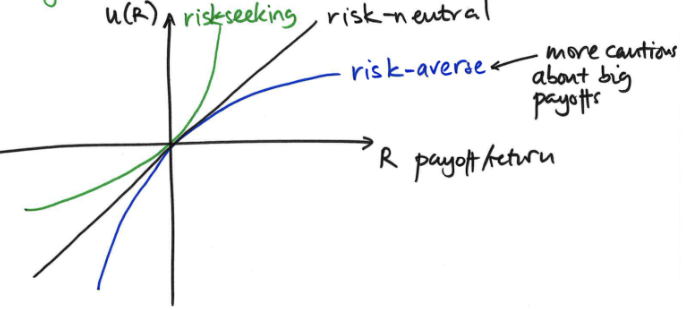
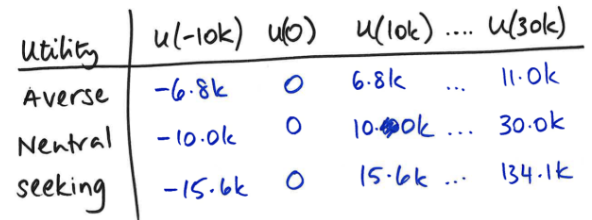
Explain utility and how it relates to risk.
Utility functions: label tree with utility (numerical satisfaction/benefit) of each payoff (since simple decision rules don’t capture how people actually make decisions)
Payoff may not be linearly related to utility
Risk-neutral: payoff and utility have linear relationship (they are essentially the same)
risk-averse is concave, risk-seeking is convex
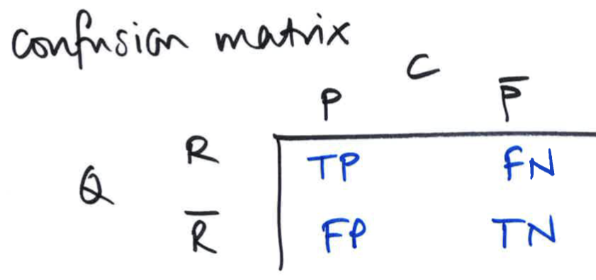
PPV and NPV: what are they and how do you calculate them?
Positive Predictive Value (PPV) = TP/(TP+FP)
Tells you the actual probability of a predicted positive outcome
PPV answers: "If my test result is positive, what is the probability that I actually have the disease?".
Negative Predictive Value (NPV) = TN/(TN+FN)
Tells you the actual probability of a predicted negative outcome
NPV answers: "If my test result is negative, what is the probability that I truly do not have the disease?
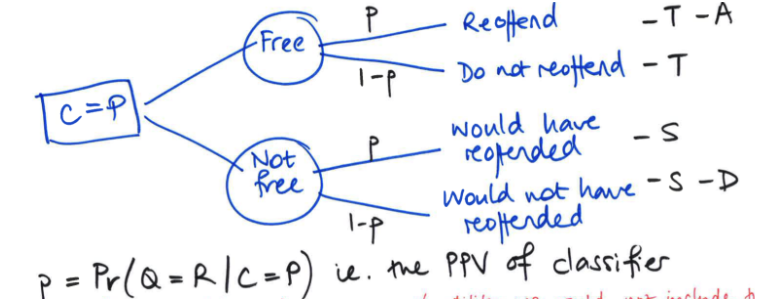
How do you compute the utility for freeing vs not freeing a prisoner given they were determined as C = P (likely to reoffend)?
E[utility(decision) | C=P] = probability*outcome cost for each option
![<p>E[utility(decision) | C=P] = probability*outcome cost for each option</p>](https://assets.knowt.com/user-attachments/d2ae5853-4fd5-4c88-bf87-9e32e2885cc1.png)
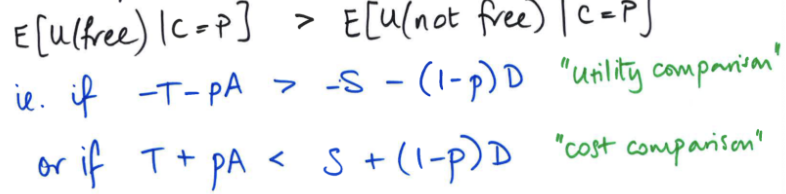
What is the max expected utility rule? Utility vs cost comparison?
By max expected utility rule, free prisoner if expected utility of freeing them is greater than expected utility of not freeing them
Utility comparison is going with whichever option has greater utility, cost comparison is going with the lower cost
For instance, free the prisoner if the cost is less than that of not freeing them
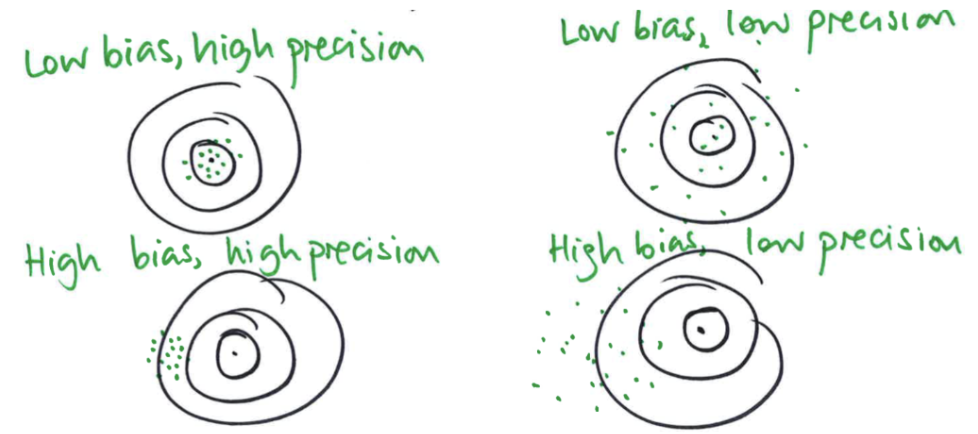
What is the mathematical definition of bias? What is precision?
E[x̄] ≠ μ
x̄ (sample mean/average) is estimate of the true mean μ
A method is biased if, over many repeated samples, its estimates systematically miss the true value instead of centering on it.
Suppose
Lots of people all take their own samples (same size).
Each person calculates their sample mean (their guess of μ).
If you average all those guesses together and the average is off from μ, then the method Is biased
Think of darts scattered but centred around bullseye (unbiased) vs consistency land off to one side (biased)
Precision: 1/var(x̄)
high precision = low variability
basically precision is inverse of variance!
Explain the combos of bias and precision. What’s the worst of both worlds?
Low bias, high precision: guesses are clustered around the target fairly tightly
Low bias, low precision: everything is still centered on the true value (low bias), but there’s a lot of variability in the different estimates
High bias, high precision: a lot of guesses that don’t vary very much (tightly clustered), but they are in the wrong place (they are averaging something that’s off where we want to be)
Worst of both worlds: high bias, low precision
Guesses vary a lot (low precision) and they are not centered on the true value (high bias)
How does mathematical bias differ compared to decision-making bias?
Bias in statistical estimation:
Long-term average of estimates is not equal to parameter being estimated
Bias in prediction or decision-making: Different accuracy/impact for different groups
Mathematical bias is a formulaic or model driven skew in results
consistently off in one direction on average
relates to truth vs estimate (is the method centred on the right value or is it wrong?)
Bias in decision tools occurs when a model produces systematically different outcomes or error rates for different groups (e.g., by race, gender, etc.).
relates to fairness across groups (is the method treating groups differently/unequally?)
Why are algorithms not perfect?
Usually because training data are not perfect
May have less data for some groups vs other groups
May have proxy variables for variables we can’t measure directly
Ex: travel patterns of all people in NZ based on census responses where they say how they travel to work usually
May exclude special variables (e.g. ethnicity) but still use correlated other variables (i.e. variables correlated with excluded one)
e.g. location people live in can be correlated with ethnicity
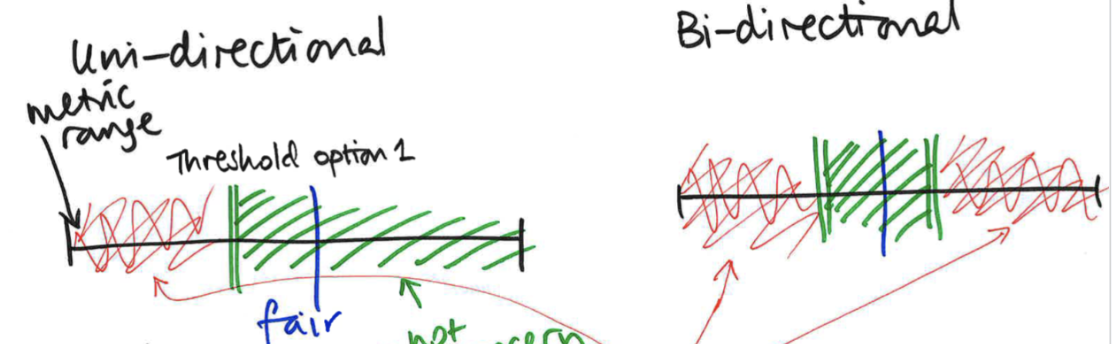
What are the different types of fairness thresholds?
Uni-directional: threshold on one side
Bi-directional: threshold on both sides
Ratio threshold: threshold bounds are multiplicatively symmetric around fair value
Difference threshold: symmetric around fair value by same value (ex 0.1)
What are the trade-offs with a classifier that is <100% accurate?
If it’s <100% accurate then you cannot maximise sensitivity (TPR) and specificity (TNR)
TPR = TP/Actual Positives (TP + FN), TNR = TN/Actual Negatives (TN+FP)
TRADE-OFF between the two types of error (FP and FN)
Can reduce the number of false positives (FP) to 0 by labelling all objects as negative
But this results in many false negatives!
Can reduce the number of false negatives (FN) to 0 by labelling all objects as positives
But this results in many false positives!
What is the use of fairness metrics when it comes to algorithms?
Fairness metrics (accuracy) <- context of algorithms
By looking at fairness metrics, we are not only looking at the algorithm’s fundamental accuracy, but the wider context in which it is operating
Specifically looking at the context of how that accuracy could apply to different groups
What impact do algorithms have?
This is the biggest thing that’s critical when thinking about the context
What are the criteria for summing up an algorithm as problematic?
Damage
What is the negative impact of the algorithm?
Scale
How many people is it affecting?
Opacity
Referring to a situation where some body is imposing this algorithm on people without telling them what the algorithm does, or what kind of data goes into it, or how it makes decisions, or how they can go about challenging those decisions if they are wrong
Opaque means it is difficult for people to challenge it
Not every example ticks all three boxes, but they'll usually tick at least one
if one of the three is bad, then all three is completely disastrous
What is transparency in the context of algorithms and the important of it?
Transparency is being open about what the algorithm does, or what kind of data goes into it, or how it makes decisions
Making visible what it is doing allows people to spot problems rather than expecting them to be fixed in advance
Human in the loop: what is it? Does it always work in practice?
The idea of having a human in the loop is that the algorithm might make mistakes or a decision that humans might not agree with, so having a human there is meant to catch those problems
A human will look at an algorithm’s output and come to their own conclusions based on that output and their understanding of the situation
Rather than just letting the algorithm make decisions, we let humans interact with algorithms since they’ll be able to take into account other factors
BUT, this only works if the human is actually going to challenge the algorithm
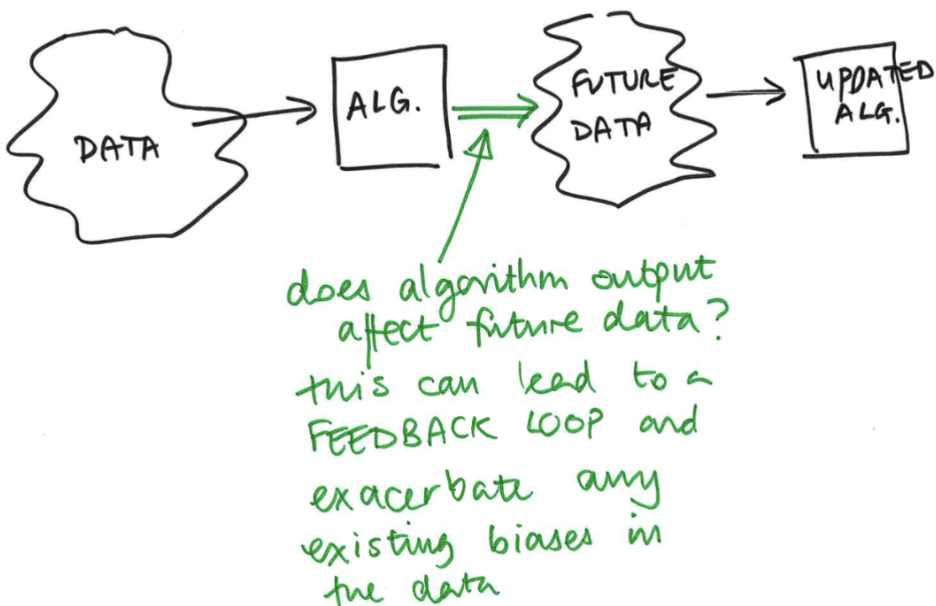
Feedback loop: explain how it works.
A feedback loop is when the output of a system is fed back into the system and influences future outcomes — creating a cycle where results shape what happens next.
When an algorithm’s outputs affect future data, this can create a feedback loop (and exacerbate any existing biases in the data).
If there is bias or error in the original data, the system can reinforce it over time — because its outputs influence future data, making the bias grow or persist.
Ex: PredPol
using reported crimes as proxy for actual crime, sending police to those areas, but # police present can affect # reported crimes, so more police → more crimes feedback loop