Applied Research Methods: Development
5.0(1)
Studied by 10 peopleCard Sorting
1/101
Earn XP
Description and Tags
Last updated 11:56 AM on 7/2/23
Name | Mastery | Learn | Test | Matching | Spaced | Call with Kai |
|---|
No analytics yet
Send a link to your students to track their progress
102 Terms
1
New cards
what type of research can be conducted using observations?
finding phenomena
2
New cards
what type of research can be conducted using correlations and quasi-experiments?
finding relationships
3
New cards
what type of research can be conducted using experiments?
finding causal relationships
4
New cards
what is meant by the precision of a theory?
accuracy of classification of which new data can be explained by the theory
e.g. “A will score higher than B in X, but lower than C, and B will score higher than A in Y".”
e.g. “A will score higher than B in X, but lower than C, and B will score higher than A in Y".”
5
New cards
principle of parsimony
choosing the most straightforward theory from among theories fitting the data equally well
6
New cards
why are falsifiability and testability important?
to distinguish science from pseudoscience and compare studies based on their degree of falsifiability
7
New cards
internal validity
extent to which the observed results represent the truth in the population we are studying
→ observed mean difference
→ observed mean difference
8
New cards
external validity
extent to which the results of the study are generalizable to other situations, populations, …
9
New cards
construct validity
the extent to which your test or measure accurately assesses what it's supposed to
10
New cards
statistical validity
the extent to which drawn conclusions of a research study can be considered accurate and reliable from a statistical test
11
New cards
how can correlations be interpreted?
direction and size
12
New cards
how can regression be interpreted
prediction
13
New cards
\
advantages of within-subject designs
advantages of within-subject designs
* requires fewer participants
* increases chance of discovering a true difference among conditions
* more statistical power (individual variation is reduced)
* increases chance of discovering a true difference among conditions
* more statistical power (individual variation is reduced)
14
New cards
advantages of between-subject designs
* minimizes learning effects across conditions
* shorter sessions
* easier to set up and analyze
* shorter sessions
* easier to set up and analyze
15
New cards
what is the difference between a quasi-experiment and a true experiment?
no randomization in a quasi-experiment
16
New cards
alpha error
type 1 error → false positive
17
New cards
beta error
type 2 error → false negative
18
New cards
effect size
how large the difference/correlation/relationship is
19
New cards
true effect
effect size in the population, cannot be observed only estimated
(should be made before the study)
(should be made before the study)
20
New cards
observed effect
calculated after the study, also an estimation of the true effect
21
New cards
statistical power
probability that the effect is statistically significant and correctly rejects the null hypothesis
22
New cards
what does low/high statistical power mean?
low power → small chance of detecting a true effect, results likely to be distorted
high power → large chance of detecting a true effect
high power → large chance of detecting a true effect
23
New cards
cohen’s d formula
d = (m1-m2) / SD
24
New cards
what are the conventional values for small/medium/large effect sizes?
>0,8 → large
25
New cards
which factors affect the statistical power of a study
* effect size
* alpha
* sample size
* alpha
* sample size
26
New cards
how can the power of a study be increased?
* increasing sample size
* increasing the measured effect size
* increasing the alpha error (because more results are accepted as significant)
* increasing the measured effect size
* increasing the alpha error (because more results are accepted as significant)
27
New cards
disadvantages of small sample studies?
more fluctuation and inflated effect size
→ publication bias
→ publication bias
28
New cards
which results should you not trust?
results of studies with small samples cannot be trusted
29
New cards
cross-sectional design
all measures are collected in a single assessment
30
New cards
longitudinal design
measures collected in repeated assessments
31
New cards
advantages of experimental research
manipulation isolates the effect of interest, so alternative explanations are minimized
32
New cards
disadvantages of experimental research
* difficult to conduct (time & money)
* biases (volunteer & selection bias)
* can be ethically problematic
* limited generalizability
* biases (volunteer & selection bias)
* can be ethically problematic
* limited generalizability
33
New cards
advantages of observational research
* more generalizability
* easier to obtain larger samples
* easier to obtain larger samples
34
New cards
disadvantages of observational research
* longitudinal studies are expensive (time & money)
* greater risk of biases and confounds
* data more likely to be incomplete and of poorer quality
* greater risk of biases and confounds
* data more likely to be incomplete and of poorer quality
35
New cards
cohort studies
assess prospective changes → looking forward in time
36
New cards
case-control studies
assess retrospective predictors → looking backwards in time
37
New cards
selection biases
biases introduced in the selection process, so that proper randomization is not achieved
\
e.g. sampling bias, allocation bias, non-response bias, publication bias, volunteer bias
\
e.g. sampling bias, allocation bias, non-response bias, publication bias, volunteer bias
38
New cards
information biases
biases introduced by systematic differences in the collection and handling of information in a study
\
e.g. misclassification bias, observer bias, interviewer bias, social desirability bias, recall bias, performance bias, detection bias
\
e.g. misclassification bias, observer bias, interviewer bias, social desirability bias, recall bias, performance bias, detection bias
39
New cards
moderator
a variable that alters the strength of the linear relationship between a predictor (X) and an outcome (Y)
40
New cards
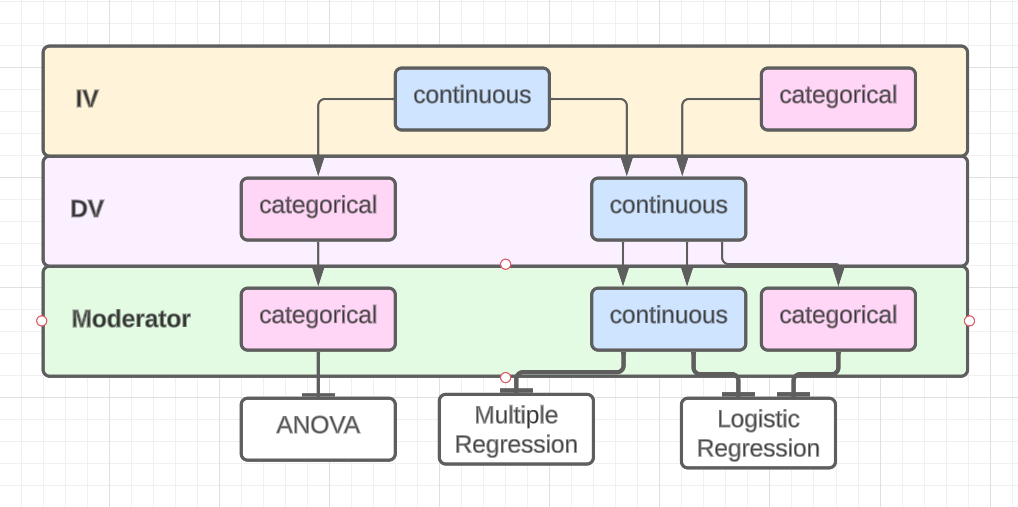
which statistical analyses are commonly used to test moderation
if X and Z are categorical and Y is continuous → ANOVA
if X, Z, and Y are continuous OR if X and/or Z are categorical and Y is continuous → Multiple linear regression
if X and Z are continuous and Y is categorical OR if X is continuous and Z and Y are categorical → Logistic regression
if X, Z, and Y are continuous OR if X and/or Z are categorical and Y is continuous → Multiple linear regression
if X and Z are continuous and Y is categorical OR if X is continuous and Z and Y are categorical → Logistic regression
41
New cards
How to interpret a moderation effect from a linear regression?
1. Center X and Z scores (→ individual score-M)
2. Calculate interaction with centered scores (X\*Z)
3. Perform analysis with centered scores and new interaction effect as predictors
4. If significant → plot simple slopes
42
New cards
When should a moderator variable be measured?
at the same time as predictors
43
New cards
mediator
The IV influences the mediator variable, which in turn influences the DV
44
New cards
total effect (c)
effect X has on Y including the effect of the mediator
45
New cards
direct effect (c’)
effect X has on Y without taking the mediator into account
46
New cards
indirect effect
total effect - direct effect
47
New cards
absolute mediation
indirect effect explains the complete effect
48
New cards
How is mediation commonly tested?
using regression…
1. Show that X predicts Y
2. Show that X predicts the mediator
3. Show that the mediator predicts Y
4. Show the mediator produces an effect of X on Y
1. Show that X predicts Y
2. Show that X predicts the mediator
3. Show that the mediator predicts Y
4. Show the mediator produces an effect of X on Y
49
New cards
bootstrapping
testing of mediation effects using a resampling technique to adjust the standard errors of the coefficitents
50
New cards
3 things to consider before conducting a mediation analysis
1. have a directionality assumption (avoid reversal causal effect)
2. consider when to measure the mediator
3. choose reliable measurements
51
New cards
When should the mediator be assessed?
after the predictor and before the outcome
52
New cards
What is the difference between mediation and moderation?
Mediation describes indirect effects, moderation describes conditional effects
53
New cards
signal detection theory (SDT)
measures the ability to differentiate between stimuli (information-bearing patterns) and noise (random patterns)
→ measures how humans make decisions under circumstances of uncertainty
\
e.g. witness tries to identify a criminal, trying to remember whether you know someone, looking for spelling mistakes, discovering a spider on your wall
→ measures how humans make decisions under circumstances of uncertainty
\
e.g. witness tries to identify a criminal, trying to remember whether you know someone, looking for spelling mistakes, discovering a spider on your wall
54
New cards
According to SDT, what are the 2 factors affecting human discrimination decisions?
1. sensitivity
2. decision/response criterion
55
New cards
sensitivity (in SDT)
* strength of the signal
* ability of the observer
* ability of the observer
56
New cards
decision/response criterion (in SDT)
* consequences of decisions (pay-off matrix)
* frequency of signal
* frequency of signal
57
New cards
According to SDT what are the possible responses (matrix)
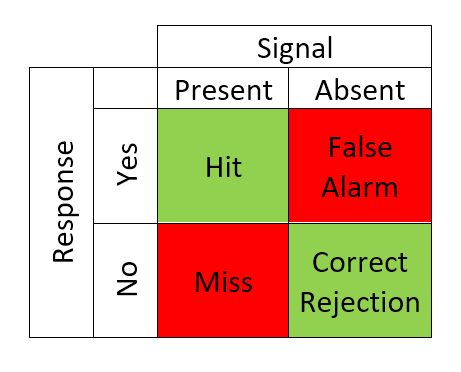
58
New cards
theoretical assumptions that explain differences in sensitivity
in reality, dichotomous events (there is a signal or not) but subjective experience varies and is usually distributed around the mean
59
New cards
what does it mean when someone responds liberally/neutrally/conservatively?
liberal → lot of false alarms but few/no misses
neutral → responds with yes and no equally
conservative → many misses but no few/no false alarms
neutral → responds with yes and no equally
conservative → many misses but no few/no false alarms
60
New cards
d’ (d prime in SDT)
standardized difference between the means of the Signal Present and Signal Absent distributions (strength of the signal relative to noise)
→ d’ = z(Hits) - z(False Alarms)
→ d’ = z(Hits) - z(False Alarms)
61
New cards
β (in SDT)
observers ability to correctly identify a stimulus (willingness to give Yes responses)
→ β = y(Hits) / y(False Alarms)
(β = 1 means neutral responses)
→ β = y(Hits) / y(False Alarms)
(β = 1 means neutral responses)
62
New cards
what does a low/high d’ mean?
low = 0 (personal cannot discriminate at all, guessing)
high = 4.66 (almost perfect at discriminating, 99% accuracy)
high = 4.66 (almost perfect at discriminating, 99% accuracy)
63
New cards
what problems are caused by missing data?
* Response rate bias
* low statistical power
* invalid conclusions
* low statistical power
* invalid conclusions
64
New cards
missingness mechanisms
reasons why data is missing
65
New cards
ignorable missingness mechanisms
MCAR (missing completely at random) → independent of observed or missing values
MAR (missing at random) → partly depends on observed values but not missing ones
MAR (missing at random) → partly depends on observed values but not missing ones
66
New cards
non-ignorable missingness mechanisms
MNAR (missing not at random) → depends on missing values themselves
67
New cards
proactive strategies for minimizing missingness
* advanced warnings
* personalized surveys
* follow-up reminders
* monetary incentives
* personalized surveys
* follow-up reminders
* monetary incentives
68
New cards
listwise deletion
deleting all cases with any missing values
(violates a fundamental principle of missing data analysis)
(violates a fundamental principle of missing data analysis)
69
New cards
pairwise deletion
still including cases with missing values into the analysis
(attempts to minimize the loss that occurs in listwise deletion)
(attempts to minimize the loss that occurs in listwise deletion)
70
New cards
imputation
replacing missing data with substituted values
(SPSS: → Analyze → Multiple Imputation → Analyze Patterns)
(SPSS: → Analyze → Multiple Imputation → Analyze Patterns)
71
New cards
mean item imputation
mean of the observed values for each variable is computed and the missing values for that variable are imputed by this mean
(can lead to severely biased estimates)
(can lead to severely biased estimates)
72
New cards
advantage of using multiple imputation over single imputation
does not provide a deterministic idea of what the missing value should be, but allows it to have a range of different scores
73
New cards
what is the best way of handling missing values?
* Item(s) missing → mean item imputation
* Scale(s) missing → multiple imputation (if not MCAR)
* Scale(s) missing → multiple imputation (if not MCAR)
74
New cards
disadvantage of comparing an experimental treatment with a waiting-list/treatment-as-usual group
easy to show that experimental condition is effective but overall less power
75
New cards
formula: percentage of improvement
(pre-post)/pre\*100
76
New cards
Lasagna’s Law
overestimation (with a factor ten to one) of the number of patients available for inclusion into your study in a certain period
77
New cards
when do you use Bonferroni correction?
→ if you test multiple times (to reduce inflated error probability)
78
New cards
ways to reduce unnecessary within-group variance in treatment outcome measurements
* specific hypotheses
* specific instruments
* inclusion- and exclusion criteria
* treatment manual, trained therapists, trained assessors
* inspection for outliers
* specific instruments
* inclusion- and exclusion criteria
* treatment manual, trained therapists, trained assessors
* inspection for outliers
79
New cards
treatment dropout/´refusal in psychoptherapy
\~25%
80
New cards
What are ERPs and what brain activity do they reflect?
= voltage fluctuations in the ongoing EEG that are time-locked to an event (e.g. stimulus onset or response execution)
\
→ reflect the sensory, cognitive, affective, and motor processes elicited by the event; usually labeled by their polarity (N/P)
\
→ reflect the sensory, cognitive, affective, and motor processes elicited by the event; usually labeled by their polarity (N/P)
81
New cards
Which properties make ERPs useful?
* covert monitoring of processing when overt behavior is difficult to measure
* can measure processes not evident in behavior
→ e.g. in infants, animals, coma patients, …
* can measure processes not evident in behavior
→ e.g. in infants, animals, coma patients, …
82
New cards
major challenge of the ERP technique and how to deal with it
many different processes happen in the brain at the same time
→ using a zero measurement (starting point assessment)
→ using a zero measurement (starting point assessment)
83
New cards
cognitive artifact
something physical or digital that has aided a mental process
→ leftover remnants indicative of the efforts it takes to unravel mental processes
→ leftover remnants indicative of the efforts it takes to unravel mental processes
84
New cards
challenges of recording/studying ERPs in clinical populations and their solutions
* The effect of medication on cognitive processing → compare to unmedicated patients
* opposing effects of comorbid disorders → investigate individuals of the same disorder with and without comorbidity
* individuals with disorder show more artifacts → adjust recording procedures (less conditions, less electrodes, rest breaks, etc.)
* opposing effects of comorbid disorders → investigate individuals of the same disorder with and without comorbidity
* individuals with disorder show more artifacts → adjust recording procedures (less conditions, less electrodes, rest breaks, etc.)
85
New cards
how are ERP components usually quantified?
latency = amplitude and time between stimulus and peak
86
New cards
conclusions that can be drawn from ERP studies
presence, size, or timing of a specific mental operation, and the effect of manipulations or individual differences on these factors
87
New cards
Big Hypothesis (Rossignol et al., 2012)
people with high levels of social anxiety have a greater P1 (encoding of faces) and P2 (attentional resources) effect than people with low levels of social anxiety.
88
New cards
why did they use ERPs? (Rossignol et al., 2012)
attentional bias can already be detected 100ms after the first stimulus is presented
89
New cards
Conclusions (Rossignol et al., 2012)
perceptual processing of social cues is extra strong in people with social anxiety (P1 component), but linking attention is generic for all anxious states
90
New cards
what differences do you look at when comparing ERPs across conditions/individuals?
* amplitude differences
* latency differences
* latency differences
91
New cards
How can ERPs be used to study disturbances in clinical populations?
* between-group comparisons (diagnosed/no diagnosis)
* correlational approach (relate ERPs to symptoms/traits)
* longitudinal studies (assess risk for psychopathology)
* correlational approach (relate ERPs to symptoms/traits)
* longitudinal studies (assess risk for psychopathology)
92
New cards
examples for direct vs. indirect measures
* direct measures: questionnaires (directly infer attitudes)
* indirect measures: reaction time (infer attitudes from results)
* indirect measures: reaction time (infer attitudes from results)
93
New cards
advantages of indirect measures
measure implicit attitudes, which predict automatic behavior
94
New cards
projective tests and their disadvantages
tests that commonly use ambiguous stimuli
e.g. Rorschach, TAT
→ low reliability and validity
e.g. Rorschach, TAT
→ low reliability and validity
95
New cards
advantages of modern indirect measures
* more objective than projective tests
* reliability and validity can be determined
* reliability and validity can be determined
96
New cards
how does the Implicit Association Test (IAT) measure associations?
measures mean reaction time for compatible and incompatible blocks of stimuli → short RTs indicate stronger associations
97
New cards
which 4 types of stimuli are needed for IAT?
2 target stimuli and 2 attribute categories
98
New cards
formula IAT effect
mean RT(incomp. block)-mean RT(comp. block)
99
New cards
problems with the interpretation of IAT effects
two types of targets → effect can be caused by either target being more associated with one stimulus or both (usually both)
100
New cards
problems with most indirect measures
* lack of convergence
* reliability
* validity
* general vs individual stimuli
* reliability
* validity
* general vs individual stimuli