AQA A Level Business - Unit 3
1/69
There's no tags or description
Looks like no tags are added yet.
Name | Mastery | Learn | Test | Matching | Spaced |
|---|
No study sessions yet.
70 Terms
Price taker
A business must accept the SPPU due to little ability to compete with the price maker
Necessity Goods
Demand increase proportionally less than income
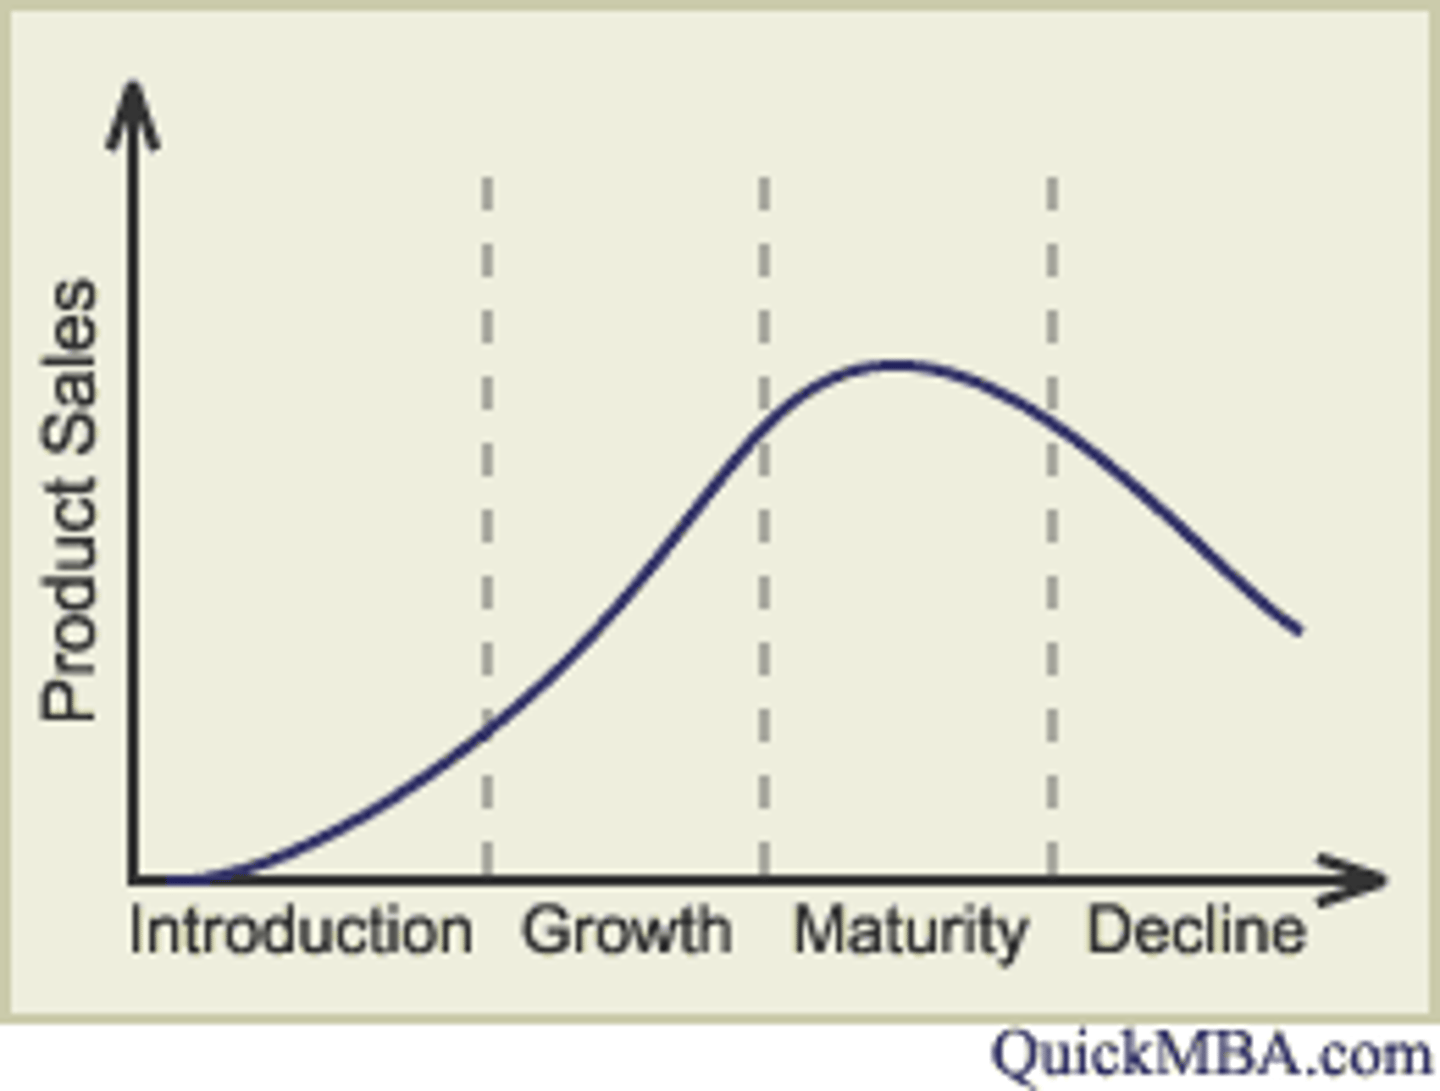
Product life cycle
Theory that sales of all products follow a similar pattern over time - development, introduction, growth, maturity and decline
Brand
A name, sign, symbol, slogan that is recognizable
Builds customer loyalty to brand
Socio Economic Status
Segmentation method using income
Market targeting
Deciding which part of the population to target
Market positioning
Where a product stands in relation to competitors
Sales volume
Number of items sold in a certain time period
Sales value
Volume sold x Selling price
Primary market research
research collected first-handed by the business itself, e.g. surveys
+ Reliable, valid and up to date
- Expensive, difficulties in making analysis
Quantitative
Numerical data from e.g. multiple choice questions, made on a mass scale
+ Concise data, easy to analyse
- Answers 'what' not 'why'
Qualitative
Opinions
+ Great insights, may highlight issues business unaware of
- Expensive to collect, difficult to analyse, small sample
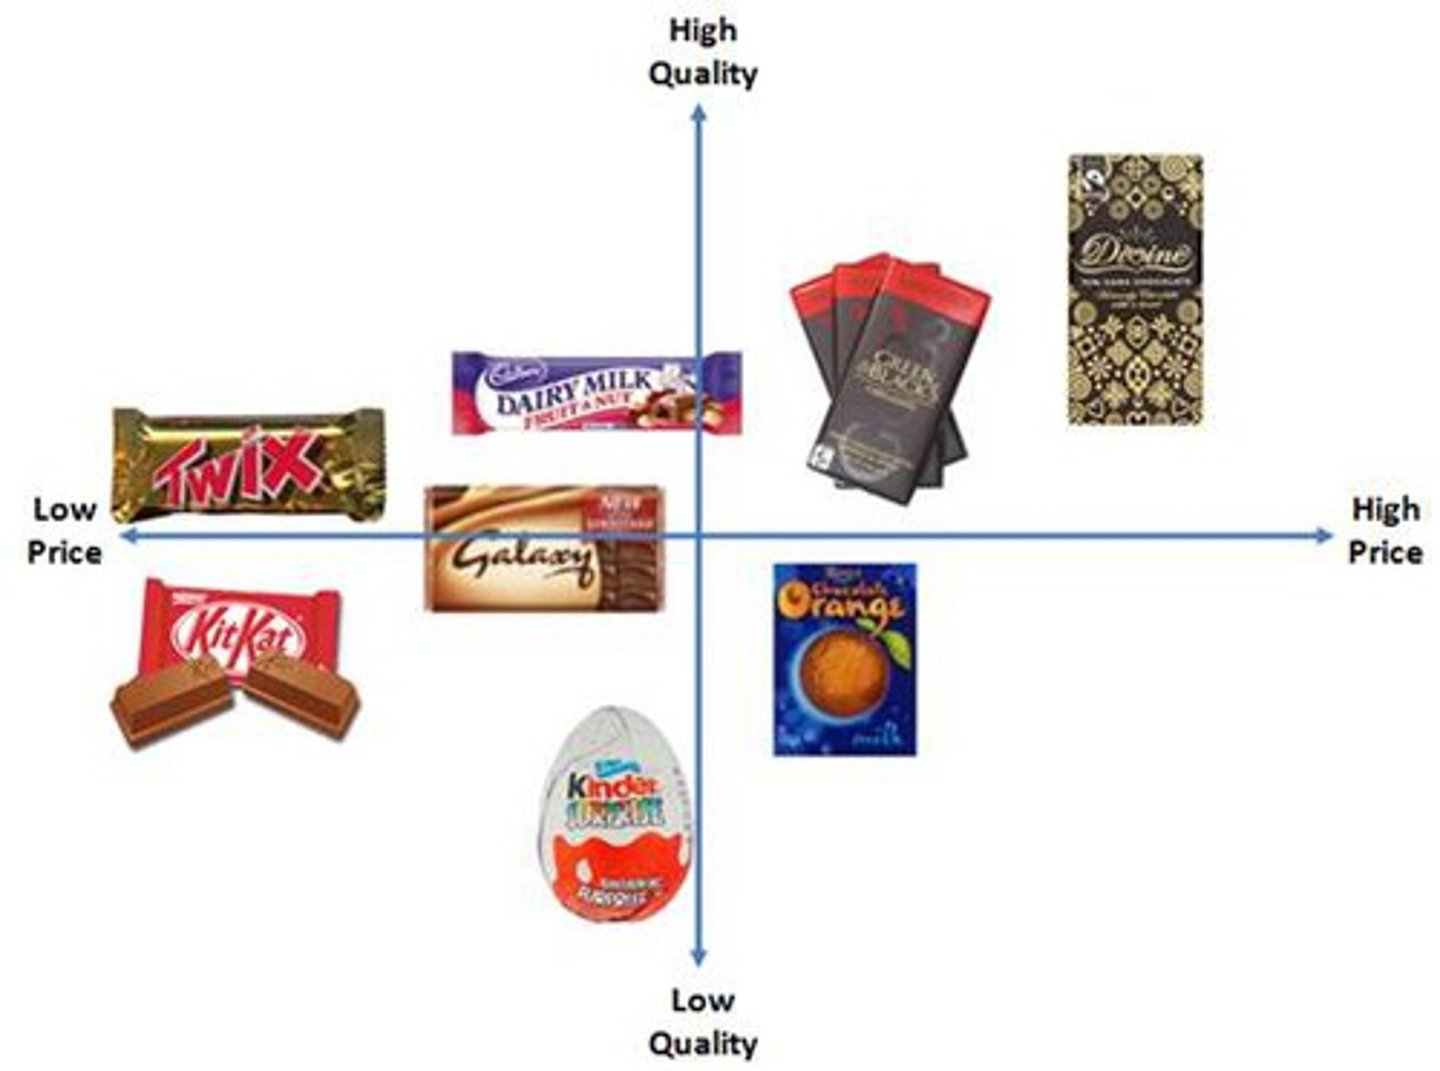
Market mapping
Identifies features of a market
Can find gaps in market
Good starting point for research
Confidence levels
Margin of error in figures
Shows accuracy of sample
Correlation
Strength of relationship between data sets
Technology to collect data
Easy to collect
(Fast, accurate, lots of data)
(Data overload and finding correlations)
Competitiveness
Measures a firms ability to offer a better combination of price and quality than its rivals
USP
A point of genuine difference that makes one product stand out from the crowd
Marketing Objectives
Targets set for the marketing department to help meet the goals of the organisation as a whole, e.g. increase brand loyalty
Corporate Objectives
The targets deciding for the company as a whole
Market share
the percentage of total sales in a market held by one brand or company
(sales of one product / sales in total market) * 100
Repositioning
Positioning the products, branding, and image to shift the proposition to a different place in the market sector
Short termist
Taking decisions on the basis of short-term benefits e.g. for shareholders, rather than long term benefits
Predatory Pricing
When a large company sets prices low with the deliberate intention of driving a weaker rival out of business
Market
Where buyers meet sellers
Luxury Goods
Products that people buy much more of when they feel better off, i.e. when income increase
Normal Goods
Products or services for which sales change broadly in line with the economy
Market Research
Collection and analysis of data and information about consumers, competitors and distributors within a firms target market
Place (7Ps)
Where customers can buy a product (bricks and clicks) or placement on shelf /webpage or distribution channel.
Target audience must be able to buy product / service easily
Price (7Ps)
Having identified the right product to appeal to its target market, the business must set the right price
Product (7Ps)
The business must identify the right features and design to make their offering both appealing and distinctive
Promotion (7Ps)
Marketing managers must create then communicate an image for the product using e.g. advertising or PR to the right target audience
Attention
Interest
Desire
Action
Process (7Ps)
Practical aspects of the purchase process, the customer experience e.g. phoning or trying to use the website
People (7Ps)
Employees that a customer comes into contact with during the sales process. Customers form an impression of the business that can have an effect on customer satisfaction
Bias
A factor that causes research findings to be unrepresentative of the whole population
Sample Size
The number of people interviewed
Sampling Method
The approach chosen to select the right people to be part of the research sample
STANDARD DEVIATION
Sample findings tend to form a bell-shaped curve when shown on a graph. within this curve, the standard deviation of the data reflects how wide or narrow is the likely variation from the mean average of the findings.
MARKET DATA AND ANALYSIS
Breaking the market down statistically to assess the types of product, consumer and competitor
PRODUCT POSTIONING
Deciding on the image and target market you want for your own product or brand
TARGET MARKET
The type of customer your product or service is aimed at
Segmentation
Finding ways to divide a market up to identify untapped opportunities, among older consumers. This offers up the possibility of new targets and a new positioning within the market.
DEMOGRAPHIC
Population subset e.g age, ethnic origin, gender, family size
GEOGRAPHIC
Segmenting by urban, rural, region or by country
BEHAVIOURAL
Method of segmentation - Identifying and reacting to the different ways in which people live and spend their income
INCOME
Segmenting markets in relation to household incomes
MULTIPLE SEGMENTATION
Breaking a market down into many segments and then developing many different products to fill each segment
MASS MARKETING
Devising products with mass appeal and promoting them to all types of customer
NICHE MARKETING
Tailoring a product to a narrow range or particular type of customer. Specialised products / services
MARKETING MIX
Is the balance between seven elements involved in a successful marketing strategy
MARKETING STRATEGY
The medium to long-term plan for meeting the firms marketing objectives
MARKETING BUDGET
The sum of money provided for marketing a product or service during a period of time
PRICE ELASTICITY of DEMAND FORMULA
% change in quantity demanded/ % change in price. Queue up to pee down
PRICE ELASTICITY of DEMAND
The responsiveness of quantity demanded of a good or service to a change in its price (when nothing but the price changes).
INCOME ELASTICITY of DEMAND FORMULA
% change in demand/ % change in real incomes (incomes after inflation)
INCOME ELASTICITY of DEMAND
The sensitivity to quantity demanded for a good or service to a change in the disposible income of the people demanding the good
BOSTON MATRIX
It helps businesses analyse their portfolio of businesses and brands. Two axis - market growth and % share of market. Four categories - problem child/question mark, cash cow, stars and dogs.
Secondary Research
Data already collected by another organisation, e.g. a market research company
+Cheap to collect, quick to analyse
- Unreliable, not up to date
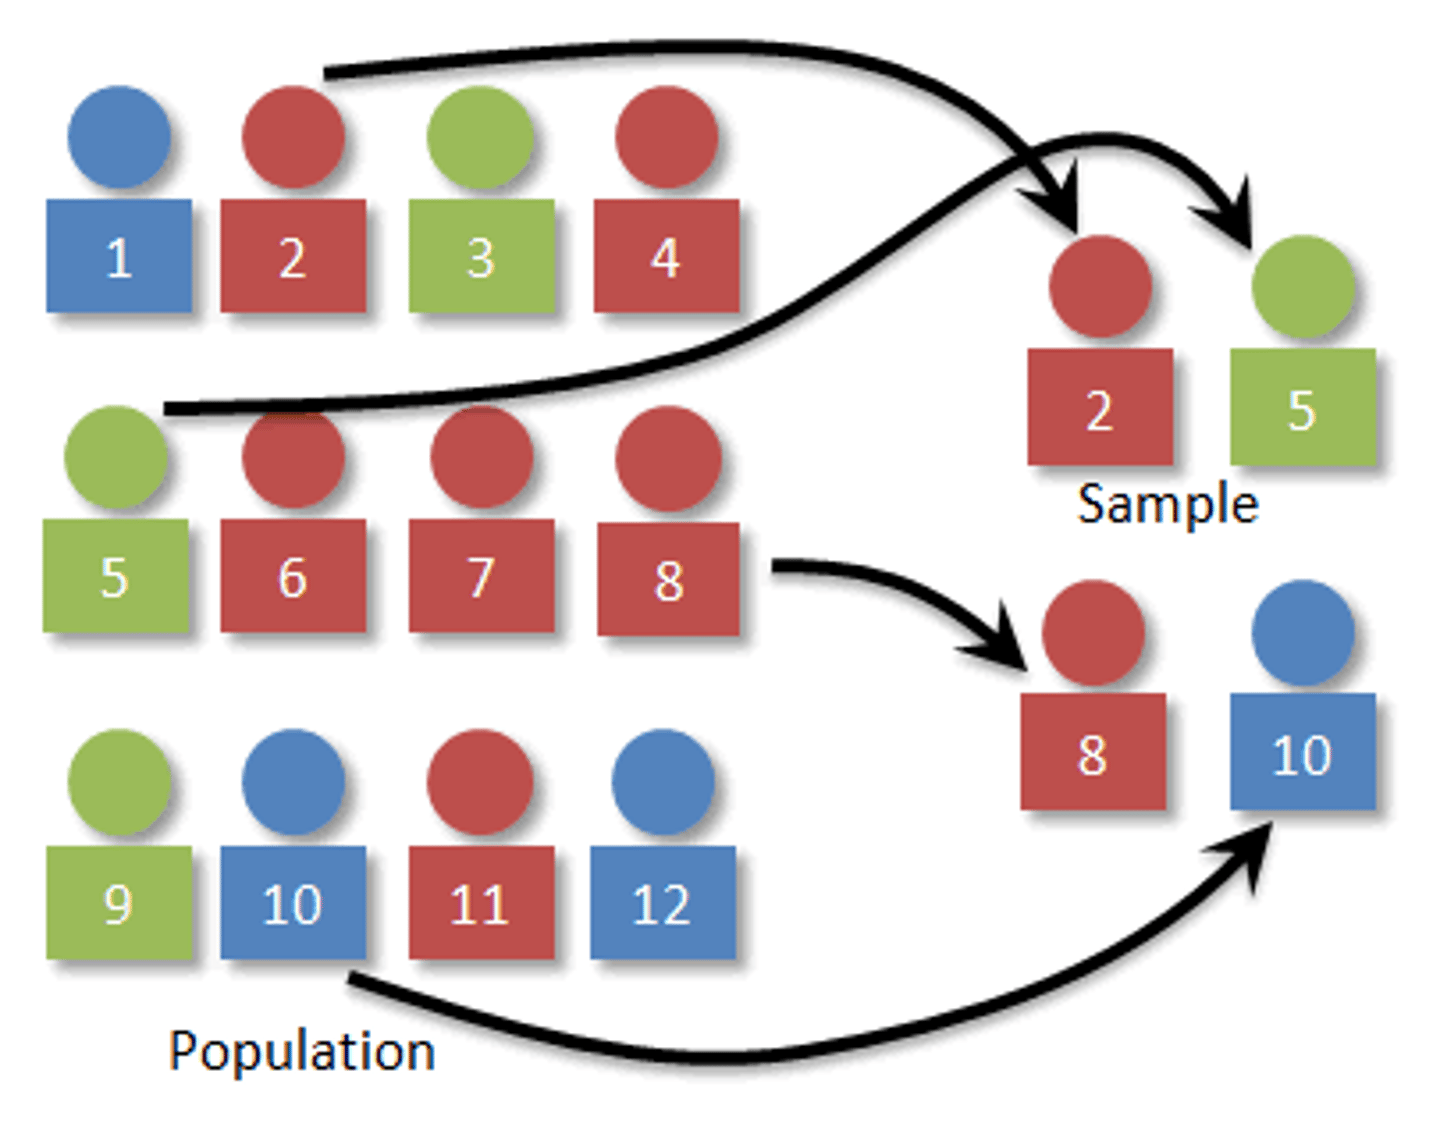
Sampling
A group that represents the whole population/wider society.
Market Segmentation
Classifying potential customers into subgroups makes marketing more targeted. (Demographic, Geographic, Income and Behavioral)
Market Factors
Nature of product: trends/fashion.
Social change: people's attitudes.
Competitors: following market leaders or them following you.
Technology: changes everything.
Economic GDP: interest rates, recession.
Suppliers: Fairtrade, quality or cost-effective.
Ethical and environmental: can be used as PR tool.
Market Leadership
Business which has the highest market share
Market growth
((market size in year - market size in previous year)/market size in previous year) * 100
Extrapolation
Using previous data to predict future data.
Psychological Pricing
A pricing strategy based on the theory that certain prices have a psychological impact
Penetration Pricing
Offering a low price for a new product or service during its initial offering in order to lure customers away from competitors.
Price Skimming
Starts at a relatively high initial price for a product or service at first, then lowers the price over time.
Price Leadership
The setting of prices in a market by a dominant company, which is followed by others in the same market.
Sales Growth
(sales in that year- sales in previous year/ sales in previous year)* 100
External Influences
Influences on a business that they cannot control PESTLE.comp