skewness, kurtosis, and the Normal distribution
1/14
There's no tags or description
Looks like no tags are added yet.
Name | Mastery | Learn | Test | Matching | Spaced | Call with Kai |
|---|
No analytics yet
Send a link to your students to track their progress
15 Terms
skewness
describes the degree to which the distribution of a dataset is asymmetrical
(left and right side are not mirror images)
the comparison between the mean and the median in your dataset is one means of understanding “skewness: in your data, together with loooking at teh histogram of your distribution
negative skew
data that is skewed to the LEFT
positive skew
data that is skewed to the RIGHT
positively skewed distributions: means is ____ than the median
higher
negatively skewed distributions: means is ____ than the median
lower
symetrica distributions: means is ____ to the median
equal
Alternative Pearson Mode Skewness
calculate a statistic that describes the direction and extent of skewness
skew = 3*(mean-median)/standard deviation
google sheets: =skew
interpreting the skewness results
if your data is skewed
if your result is 0, then your data is perfectly symmetrical.
if the value is between -.5 and -0.5, we can still consider the data approx. symmetrical
the direction of the skew
skewness is greater than .5 —> positively (right) skewed data
skeweness is less than -0.5 —> negatively (left) skewed data
how substantially your data is skewed
the larger your skewness statistic, the more strongly your data is leaning to the left or right, and/or the more distortion you have from outliers
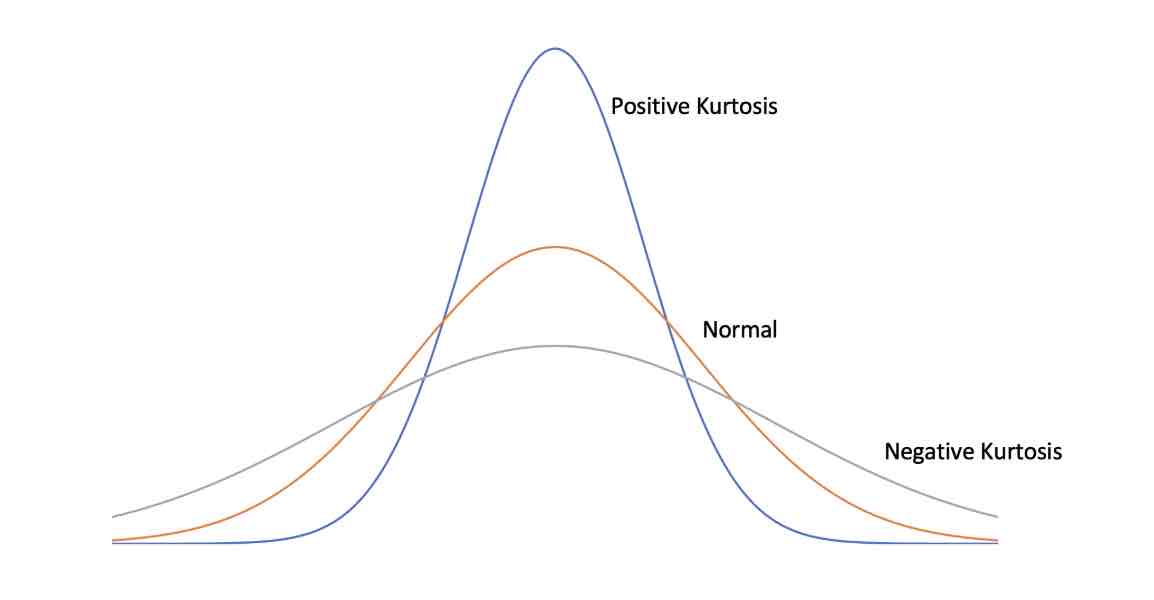
kurtosis
statistic that describes the shape of your data distribution (like skewness)
the extent to which data is clustered around your mean (or peak of the distribution), or spread out more evenly towards the high and low ends (or tails) of your distribution
same skewness but different kurtosis (image)
how to calculate kurtosis in google sheets
= kurt
interpreting kustosis
if its greater than 2 —> considered more peaked than normal (leptokurtic)
if its less than 2 —> much flatter than mormal (platykurtic)
between -2 and 2 —> considered close to normal (mesokurtic)
the normal distribution
describes a data distribution where there is no skewness (and the mean and median are the same) and kurtosis is zero
examples of normal distribution (that tend to occur naturally)
people’s heights
test scores
IQ
salary
points scored in sports
GENERAL RULE
skewness should be between -0.5 and 0.5
kurtosis should be between -2 and 2