M3L2 - Visualizing the Cell
1/18
There's no tags or description
Looks like no tags are added yet.
Name | Mastery | Learn | Test | Matching | Spaced | Call with Kai |
|---|
No analytics yet
Send a link to your students to track their progress
19 Terms
Limitations of Human Eye
Our limits are a fifth of a mm
Cannot differentiate between objects closer than that
We can see with the unaided eye:
nerve cells
single cell of some eggs
Types of Microscopes (2)
Light Microscope
Electron Microscope
Light Micrscopy
Uses light to illuminate the object
Allows visualization of most prokaryotic cells and organelles inside eukaryotic cells
Limitation: Objects less than 200nm
Electron Microscopy
Uses a beam of electrons to illuminate objects
Visualizes small bacteria, viruses, or large proteins, protein complexes, ribosomes, lipids, and small molecules
Limit of Resolution (D)
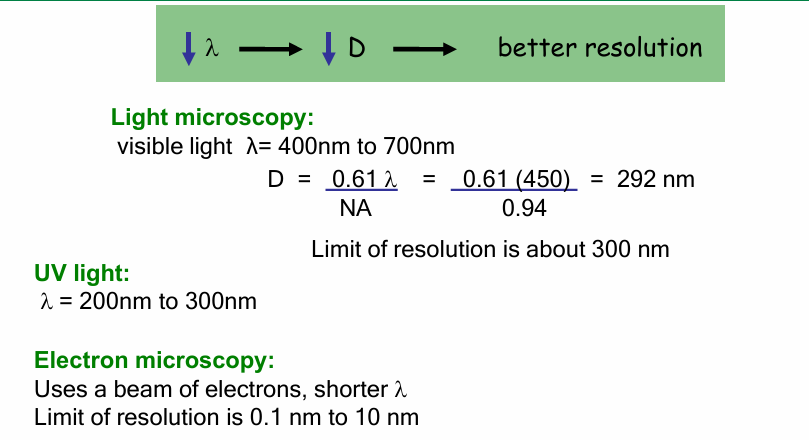
Wavelength of source of illumination limits our ability to see small objects
Small wavelength = smaller D = better resolution
Resolution: The ability to see an object/amt of detail we can observe with clarity
Microscopy resolution (D): The smallest distance between 2 objects where they still appear distinct
Small D = better resolution
Better to minimize refraction of illuminating light
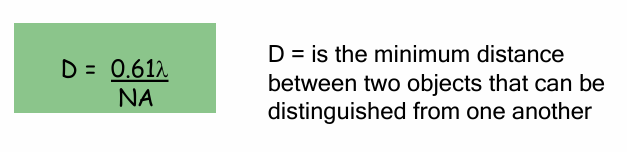
Resolution (D) Formula
Formula: D = 0.61(λ) / NA
λ = wavelength of light
Shorter wavelength = higher resolution
NA = Numerical Aperture
How much light bends as it passes from the objective lens through air to the specimen.
closer to 1 = better
Wavelength of source of illumination limits our ability to see small objects
Small wavelength = smaller D = better resolution
Better to minimize refraction of illuminating light

Improving Resolution (Decreasing D)
Light microscopy
Wavelength: 450nm
Microscope objective NA = 0.94
(closer to 1 = good)
D = 292nm
Objects closer than this distance can’t be discerned
Bright field microscopy
Resolving power of 0.2 um
Can magnify 1000x
UV light source
λ = 200 - 300nm
D will be smaller (better resolution)
Electron Microscope
D = 0.1 - 10nm
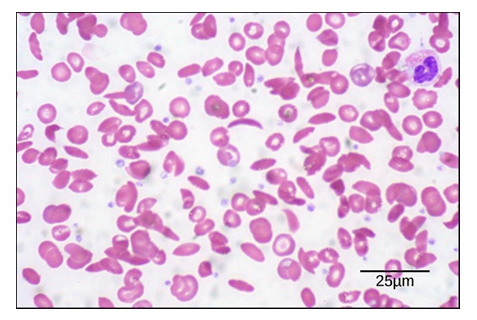
Brightfield Microscopy: Blood Smear
Samples can be live or fixed, and stained or unstained
Blood smear can be stained with whole cell dye and seen
Distinguishable between biconcave shape of typical RBC (lighter stain in middle)
You can see sickled RBC (sickle cell anemia sample)
Scale bar:
Magnification is 535x
Length of scale bar is 25μm
Diameter of RBC = about 8μm
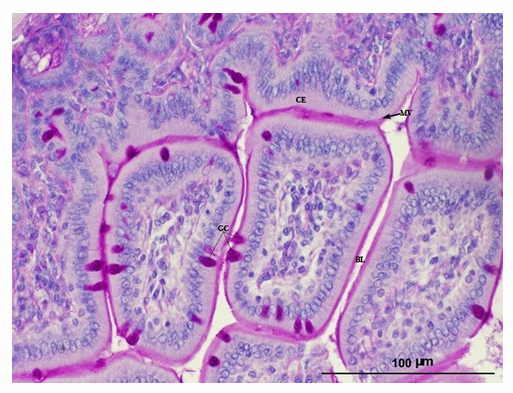
Brightfield Microscopy: Tissues
Samples embedded in paraffin to slice thin sections
This is a stained (with PAS) small intestine section of a mouse
Observations:
Surface columnar epithelial cells form a single, even row.
Nuclei or intestinal cells are stained blue
Magenta cells are specialized goblet cells (GC)
They stain strong as they’re right in polysaccharides and glycogen
Microvilli cover the main columnar epithelial cells
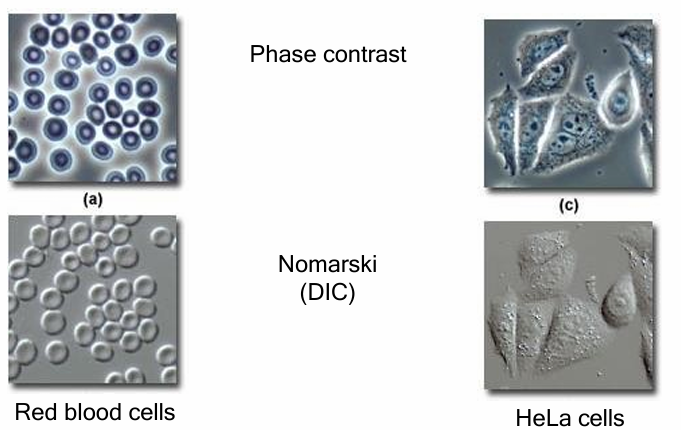
Phase Contrast AND Nomarski (DIC) microscopy
Complementary techniques C
Produces high contrast images of unstained and unfixed transparent biological specimens
Both rely on enhancing difference in density of different region of specimen
They both allow live specimens to be visualized
Allows view of the dynamics of a living system
Phase contrast microscopy VS Nomarski (DIC) microscopy
Phase: Favours clear visualization of internal cellular structures
Creates ‘halo’ around external surface
Obscures some visualization
Nomarski: Clear, sharper edges and surfaces and cell structures
Clearer view of periphery of cell
Can see better proximity between neighbouring cells (to study intracellular events)
Immunofluorescence Microscopy
Reveals the locations of specific molecules in the cell
Uses fluorescent dyes or antibodies to tag target molecules.
A primary antibody binds specifically to the molecule/antigen of interest (e.g., antigen B).
A secondary antibody, covalently attached to a fluorophore, binds the primary antibody.
The fluorophore is excited by UV light, emitting fluorescence that marks the location of the target protein.
Example: CD44 (a cell membrane protein) labeled with a green fluorophore, and DAPI (DNA-specific dye) labels nuclei blue, clearly showing cell membranes and nuclei.

How can we visualize unique molecules in a cell beyond general stains?
Some stains are specific for biomolecule classes (e.g., DNA, polysaccharides, proteins).
To detect a single specific protein, more advanced techniques are needed.
Analogy: Like city lights in a satellite image reveal where people are and what they’re doing, fluorescent tagging marks the presence and distribution of specific molecules.
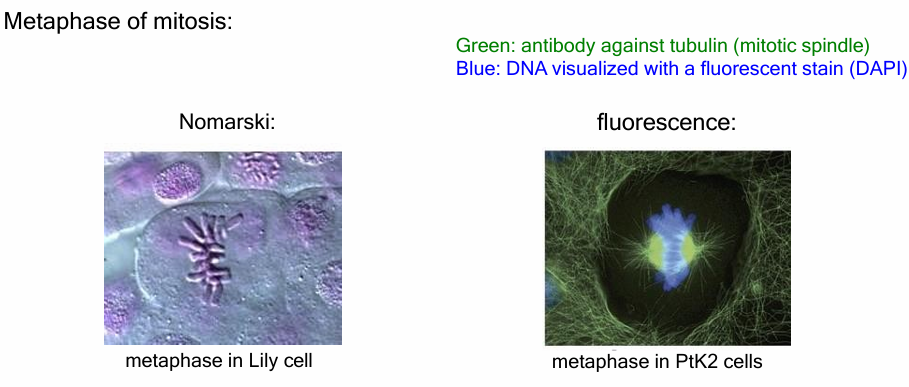
How does fluorescence microscopy compare to Nomarski in visualizing mitosis?
Nomarski microscopy shows compact chromosomes in metaphase but lacks detailed visualization of internal structures.
Fluorescence microscopy with DAPI (blue) and β-tubulin antibodies (green) reveals microtubules and the mitotic spindle, details invisible in Nomarski images.
Because antibodies must access internal structures, cells must be fixed and processed, so immunofluorescence is used on non-living cells.
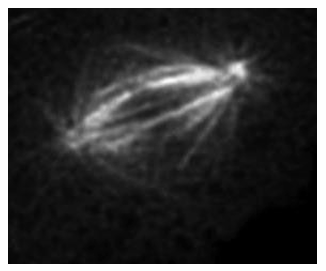
Fluorescence Microscopy: GFP Protein
Looks at the dynamics of living cells instead of just fixed
Green Fluorescent Protein (GFP) is a natural fluorescent protein from jellyfish.
Recombinant DNA technology fuses the gene for GFP with a protein’s gene, creating a protein-GFP fusion.
Once expressed in cells, the fusion protein is now fluorescent
reveals the location and behavior of the protein
Ex. Tubulin protein fused to GFP within a cell
It shows its location and how microtubules are organizes into a mitotic spinde
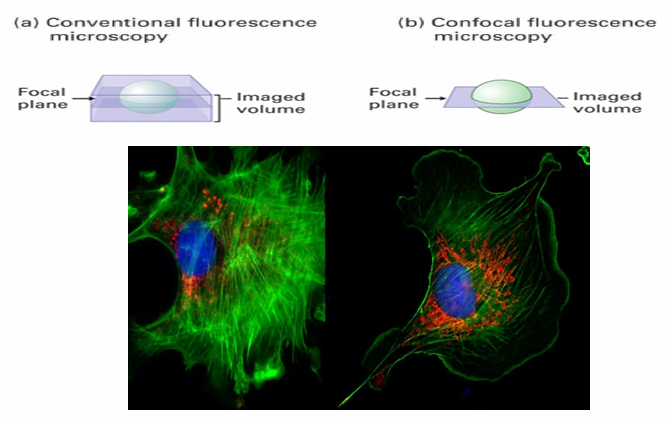
Confocal Laser Scanning Microscopy
Obtains high resolution images from fluorescently labelled samples
Creates optical sections while keeping tissues/cells intact
It excited only the fluorophores in a thin section with a specialized laser
Eliminate background fluorescence above and below region of interest
A clear and detailed image is made
Ex. 2 images of BPAE cells
DNA in nucleus stained with DAPI
Actin tagged in green
Antibody to visualize protein specific for GA is red
Both images have actin easily seen but confocal image shows inc quality and clarity of the actin fillaments
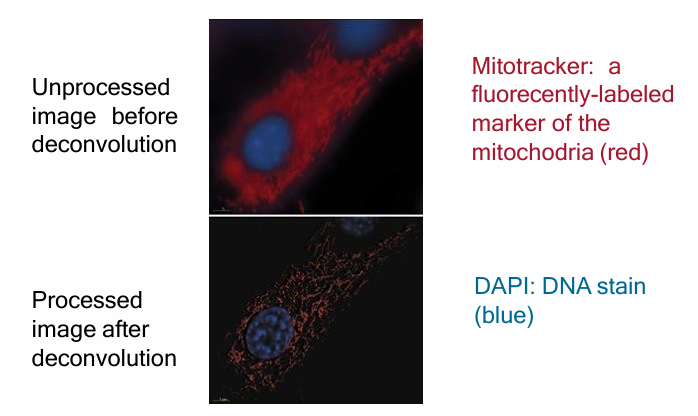
Doconvolution Microscopy
Creates a clear image similar to confocal microscopy by using traitional fluorescence microscopy
An image from a conventional fluoresence microscope is processed using computer algorithms
Subtracts the fluoresence that is out of focus above/below
Isolated digital sections of fluorescent images
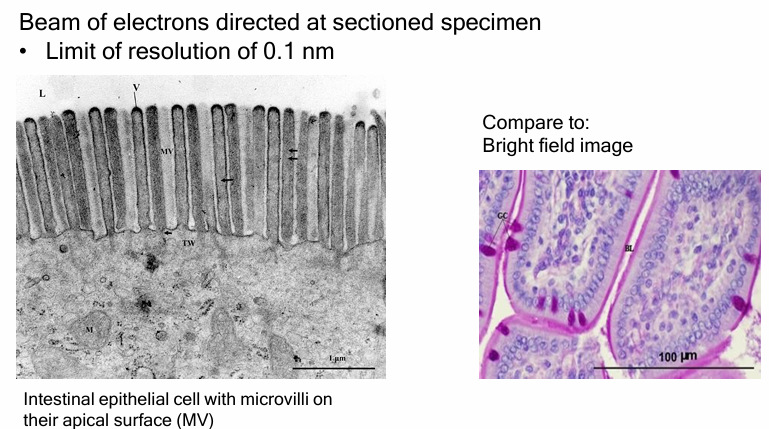
Transmission Electron Microscopy (TEM)
Regular Electron Microscope:
λ = 0.005nm
D = 0.1nm
TEM
beam is directed through thinly slices specimen to form an image
Stained/dense areas appear dark
Unstained/sparse areas appear light
52,000x magnification compared to brightfield image
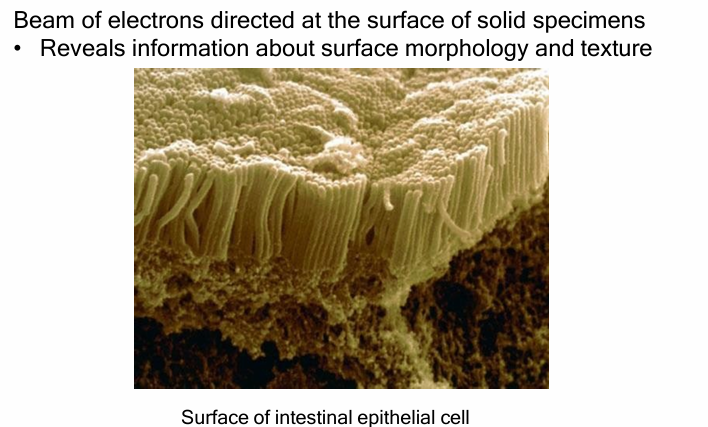
Scanning Electron Microscope (SEM)
Uses beam of electrons to illuminate sample
Beam is focused over surface of specimen coated in a thin layer of metal
Produces 3D surface morphology image