Looks like no one added any tags here yet for you.
Categorical data
refers to data that can be divided into categories or groups based on qualitative characteristics.
categorical variable
is one that represents characteristics or qualities rather than numerical values. It consists of categories or groups into which data can be classified.
center
refers to the middle or average value of a data set. It represents the typical or central value around which the data tends to cluster.
Descriptive statistics
involves organizing, summarizing, and presenting data in a meaningful way to describe its main features.
Inferential statistics
involves using sample data to make inferences or draw conclusions about a population.
Outliers
are extreme values that significantly differ from other values in a dataset. They can greatly affect statistical analyses and should be carefully examined.
Predictive modeling
involves using historical data and statistical algorithms to make predictions about future outcomes.
proportion
is a fraction or percentage that represents the relationship between a part and a whole in a population or sample.
Categorical
groups
proportions to measure
eye color, statuses
visualized via __________
bar graph, pie chart, table, mosaic plot
Quantitative
measured, counted
means to measure
height, age
visualized via _____
histogram, stem leaf, box whisker
Five number summary
left to right on box plot: ______
minimum, q1, median, q3, maximum
Quantitative data
refers to numerical information that can be measured or counted. It involves quantities and can be analyzed using mathematical methods.
SOCS to describe DISTRIBUTION
shape, outlier, center, spread
shape
symmetry skewness modality
outlier
strong variation from other values that affect stat measures; determine with 1.5IQR, 2SD rule
center
mean median mode
spread described by
range (IQR), variance, stand dev
IQR equals
q3-q1
standard deviation does
measures how far values are from mean
variance
measures variability
uniform
height approx same everywhere, no significant mode
_ is easily affected by outliers, best measure of central tendency unless skewed / outliers
__ is OUTLIER RESISTANT; better measure or central tendency when data skewed, outliersmean is easily affected by outliers, best measure of central tendency unless skewed / outlier
mean, median
z score is equal to
data point minus mean value all divided by standard deviation
categorical: ____
quantitative: _____
bar graphs, NOT _____
watch the scale!
frequency = ____
relative frequency =____
qualitative, numerical, histograms, count, percentage
describing distribution: SOCS (____________)
____ is affected by skew, ____ is not
histograms: if comparing distributions w/ diff. sample sizes, use ______
shape outlier center spread, mean, median, relative frequency
IQR = Q_-Q_
middle 50% of observations
finding Q1,Q3:
odd: exclude _____ (Q2)
even: split ____
five-number summary (1-Var Stats): ____
turn into box plot (use TRACE to find outliers)
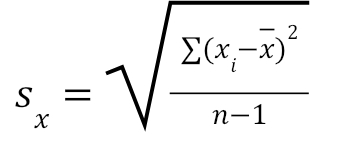
standard deviation: typical distance from ___
1,3, median, median, min, Q1, Q2, Q3, max, mean
describe how standard deviation is calculated
find the sum of initial x minus x raised to the negative second power. divide by
continuous data
numerical data that can take on any value within a given range. infinite possible values
interval level of measurement
is a type of measurement scale that not only categorizes data but also allows for meaningful comparisons between the values. It has equal intervals between the numbers, but there is no true zero point.
nominal level of measurement
is the lowest level of measurement where variables are categorized into distinct groups or categories based on their characteristics or attributes.
ordinal level of measurement
a type of measurement scale where variables are ranked or ordered based on their attributes. The order matters, but the differences between values may not be equal or meaningful.
ordinal variable
is a type of categorical variable that has a natural order or ranking. The categories can be ranked or ordered based on some characteristic or attribute.
contingency table is a type of table that is used to organize and (later on) analyze ____ data. It shows how the observations in a dataset are distributed among different _____ of two or more variables.
categorical, categories
ratio level of measurement
similar to interval level, as it allows for meaningful comparisons and equal intervals. However, ratio level also has a true zero point which represents an absence or complete lack of the measured attribute.