H3 - Data System Foundations
1/47
There's no tags or description
Looks like no tags are added yet.
Name | Mastery | Learn | Test | Matching | Spaced | Call with Kai |
|---|
No analytics yet
Send a link to your students to track their progress
48 Terms
problems of Data-Intensive Applications
Problems
Amount of data
Complexity of data
Speed at which data is changing
Typically built from standard building blocks
Store data so it can be retrieved again later (databases)
Remember the result of an expensive operation, speeding up reads (cache)
Allow users to search data by keyword or filter it in various ways (search indexes)
Send a message to another process, to be handled asynchronously (stream processing)
Crunch large amount of accumulated data (batch processing)
Need to figure out which tools and which approaches are most appropriate for task at hand
Definitions:
systems of record
derived data systems
Systems that store and process data grouped into two broad categories
Systems of record
A.k.a. source of truth, holds authoritative version of your data
When new data comes in → first written here
Each fact represented exactly once
In case of discrepancy between another system and system of record, value in system of record is correct one
Derived data systems
Result of taking existing data from another system and transforming or processing it in some way
If you lose derived data → can recreate it from original source
Technically speaking derived data is redundant, however often essential to get good performance on read queries
Three Main Concerns for Data Systems (EX)
ezelsbrug
ReScMa
Reliability
The system should continue to work correctly (correct functionality at the desired level of performance) even in the face of adversity (hardware or software faults or even human errors)Scalability
As the system grows (in data volume, traffic or complexity), there should be reasonable ways of dealing with that growthMaintainability
Over time many different people will work on the system and they should all be able to work on it productively
Concern 1: Reliability – Faults and Failures (EX)
Continuing to work correctly, even when things go wrong
Things that can go wrong = faults
Systems that anticipate faults and can cope with them = fault-tolerant or resilient systems
Note: not all faults can be tolerated: if planet Earth is swallowed by a black hole, tolerance of that fault would require web hosting in space
Faults are not failures
Fault = one component of the system deviates from its spec
Failure = system as a whole stops providing the required service to the user
Systems can be tested in terms of fault-tolerance by deliberately inducing faults
Concern 2: Scalability (EX): Describing load e.g. Twitter
Describing load e.g. Twitter (now-called X)
Post tweet (4.6k write requests/s on average, 12k write requests/s peak)
View home timeline (300k read requests/s)
Handling 12k writes/s is not that hard
Difficulty is fan-out: each user follows many people and is followed by many people
Two ways of handling this
Posting a tweet inserts the new tweet into a global collection of tweets
User requesting their home timeline: look up all the people they follow, find all tweets for each of those users and merge them (sorted by time)
Maintain a cache for each user’s home timeline
When a user posts a tweet, look up all the people who follow that user, and insert the new tweet into each of their home timeline caches
Request to read the home timeline is then cheap, because result has been computed ahead of time
First version of Twitter used approach 1
Systems struggled to keep up with load of queries
Switch to approach 2
Downside: posting a tweet requires a lot of extra work
On average: a tweet is delivered to 75 followers
4.6k tweets per second becomes 345k writes per second to home timeline caches
BUT: some users have over 30 million followers
Would result in single tweet → 30 million writes to home timelines
Thus, for Twitter distribution of followers per user (weighted by how often a user tweets) is a key load parameter for scalability
Nowadays Twitter uses a hybrid approach (approach 2 for regular users combined with approach 1 for celebrities)
Concern 2: Scalability (EX): Describing performance
mean
percentiles (en in practice)
DESCRIBING PERFORMANCE
Mean (given n values, add them up and divide by n)
Usually not a very good metric if you want to know typical response time, because it does not tell you how many users actually experienced that delay
Percentiles
Median or 50th percentile: take sorted list of response times, median is halfway
e.g. if median response time is 200ms, half of requests return in less than 200ms, and half of requests take longer than that
To know how bad outliers are: look at 95th, 99th or 99,9th percentile
950, 990 or 999 out of 1000 requests take less than given time to complete
Tail latencies are important: directly affect user experience of service
Often used in SLAs (Service Level Agreements), typically both in median and 99th percentile quantifications
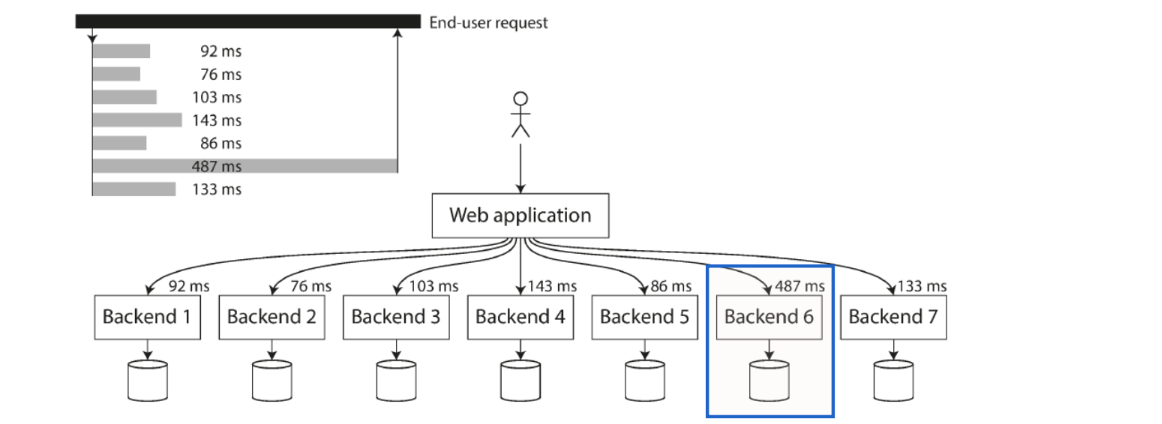
Percentiles in practice
When several backend calls are needed to serve a request, it takes a single slow backend request to slow down the entire request
Add response time percentiles to monitoring dashboards for services
Rolling window of response times of requests in the last timeframe (e.g. median, different percentiles over last 10 minutes).
Concern 2: Scalability (EX): handling load increases
horizontal vs vertical scaling
automated vs manual scaling
HANDLING LOAD INCREASES
Vertical scaling = moving to more powerful hardware
Horizontal scaling = distributing load over more machines
Automated vs manual scaling
Elastic / autoscaling systems: detect load increases or decreases and automatically add or remove resources
Drawback: complex to implement correctly
Manual scaling: human analyses capacity and decides upon adding more machines to the system
Scaling can be proactive or reactive
There is no generic magic scaling sauce
Volume of reads, volume of writes, volume of data to store, complexity of the data, response time requirements, access patterns, security, etc.
100.000 requests/second, each 1 kB <-> 3 requests/minute, each 2 GB in size
Both systems deal with 0.1GB/s data throughput but should look very different
tweede zal makkelijker te implementeren zijn
Concern 3: Maintainability
ezelsbrug
OSE
Operability
Make it easy for operations team to keep system running smoothly
Simplicity
Make it easy for new engineers to understand system, removing as much complexity as possible from the system
Evolvability
Make it easy for engineers to make changes to system in the future, adapting it for unanticipated use cases as requirements change
Impacts velocity of integrating new functionality
Data Model Layering
Most applications built layering one data model on top of another
For each layer key question: representation in terms of next-lower layer?
vb:
App developer: model real world in terms of objects and data structures and APIs that manipulate them
Structures often application-specific
SQL relational model
Data organized in relations (tables in SQL), where each relation is an unordered collection of tuples (rows in SQL).
Most application development nowadays is in object-oriented programming languages
Awkward translation layer needed between objects in application code and the DB model of tables, rows and columns
Partially solved through Object-Relational Mapping (ORM) frameworks like ActiveRecord (Ruby) or Hibernate (Java)
NoSQL (algemeen)
driving forces
2 movements
verschillende types NoSql datastores (EX)
NoSQL = Not Only SQL
Driving forces
Need for greater scalability: storing more and more data
Need for greater availability: if one or more nodes is no longer responsive the rest of the system can keep going
Also
Preference for free and open-source software over commercial costly DB products
Specialised query operations e.g. undefined number of joins not well supported by the relational model
Frustration with restrictiveness of relational schemas
Two movements
Data stores that could be distributed better and without limitations
Availability more important than overall consistency
In the foreseeable future, relational DBs will continue to be used alongside a broad variety of non-relational datastores
Different types of NoSQL datastores: document store, graph store, time series DB, triple/quad store, etc.
NoSQL: Key-Value Store (EX)
wat
voor en nadelen
gebruikt voor
vbn
One of the simplest NoSQL DBs
Datastore focused on storing, retrieving and managing data by key – value pairs
Keys are unique identifiers
Both keys and values range from simple data types to complex composed objects(unformatted text, documents, photos, music, video)
No schemas, no relationships between data
Voor en nadelen:
- Drawback: can only use the key to retrieve elements, typically unable to do things like filtering or retrieval of elements with common attributes
- Only supports simple commands like get, put, delete
+ High horizontal scalability
+ Very fast for both read and write operations
Good for
Real-time recommendations and advertising: rapid access to new recommendations as web site visitor moves through site
In-memory datastore (e.g. caching or web session details / preferences)
Examples: Redis, Memcached, TiKV
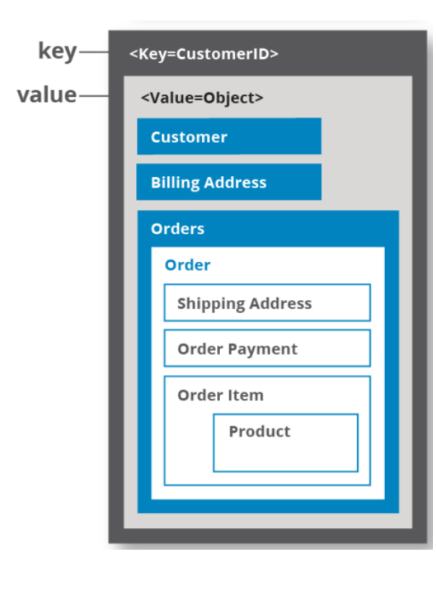
NoSQL: Document Store
Document store focusses on storing document-oriented information (XML, JSON, etc.)
Seen as extension to key-value stores, value being a structured document
No rigid schema (like relational model)
All information of an object stored together
Contrary to a key-value store, can filter / aggregate on document value
Examples: MongoDB, Couchbase
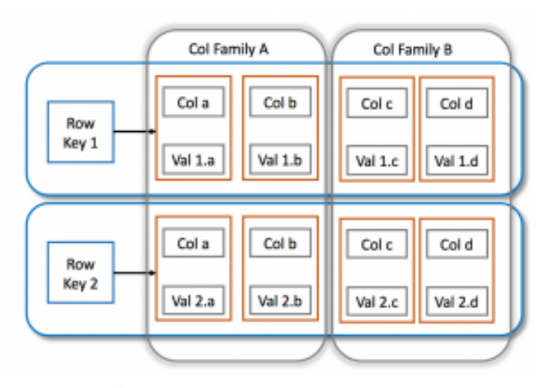
NoSQL: Wide Column store (EX)
wat
voor en nadelen
gebruikt voor
real life vbn
Seen as a 2-dimensional key-value store
Uses tables, rows(identified by key), columns(identified by column keys)
Each row does not have to contain the same columns
Values can be complex data types like unformatted text and imagery
Combines strict table structure of relational DB with flexibility of document DB
Voor en nadelen
- Not optimized for joins
+ Designed for very high horizontal scalability
Each row can be stored as individual file, addressable by its key
Up to every attribute of a single row, addressable by key and column key, could be stored separately
Such extensive splitting of data could lead to very bad query performance
Solution: Column families, describing which attributes belong together and will most likely be queried together
Downside: makes schema stricter, need to know and define columns and column families up front
+ Optimised for
High volumes of data
High write throughput with slower reads
Examples: Cassandra, Hbase, ScyllaDB
NoSql: Time Series DB (EX)
wat
voor en nadelen
gebruikt voor
real life vbn
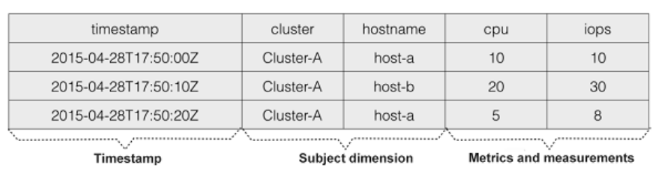
Database optimized for time-stamped or time series data
Metrics (regular time series) or events (irregular time series) that are tracked, monitored, aggregated over time
Time becomes the key index (when plotted, one of the axis is always time)
Time series DBs have difficulty with handling high cardinality data
Each table can have many indexed columns (dimensions) each containing many unique values
Data ingest rates plummet as cardinality rises exponentially
Typically support for dropping older data: retention policies
Specialized compression algorithms can operate over time series data, offering higher compression rates than more generic data
Many types of data: sensor data, performance monitoring data, server metrics, clicks, financial data, etc.
Optimized for measuring change over time: IoT, DevOps monitoring real-time analytics
Examples: InfluxDB, TimescaleDB
NoSQL: Graph DBs (EX)
wat
voor wat
real life vb
Data can be modeled as a graph
Vertices (nodes or entities) + Edges (relationships or arcs)
Important aspects
Any vertex can have an edge connecting it with any other vertex
No schema restricting which kind of things can or cannot be associated
Given any vertex, efficiently find both incoming and outgoing edges and thus traverse graph
By using different labels for different kinds of relationships, you can store several different kinds of information in a single graph, while maintaining a clean data model
Good choice for data that can evolve or which there are a lot of many-to-many relationships
Examples: Neo4J, ArangoDB
NoSQL: Search Engines (EX)
wat
gebruikt voor
real life vb
Datastore designed for finding content (typically full text) through search functionality
Data does not have to conform to a rigid schema
Typically heavily indexes content (grouping similar characteristics) in order to offer search results in a rapid manner
Indexing through tokenization (chopping up data in small pieces) and stemming (bringing words back to their root form)
Offers different methods for full-text search, complex search expressions and rankings of search results
Good choice for
Autocompletion / suggestions based on customer input
Searching through logs for analysis
Examples: ElasticSearch
Relational vs document model
many to one relationships
many to many relationships
relation vs document model
choice?
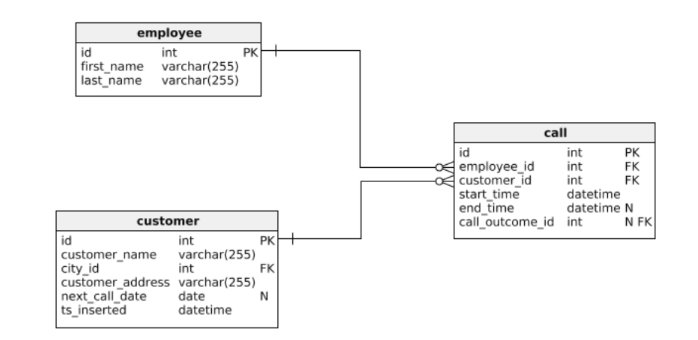
MANY-TO-ONE RELATIONSHIPS
Relational DBs: normal to refer to rows in other tables by ID, because joins are easy
Document DBs: support for many-to-one relations is weak
Joins are not needed for one-to-many table structures and support for joins is weak
Work of creating join is typically moved to application instead of DB (e.g. in-memory list of regions or industries)
MANY-TO-MANY RELATIONSHIPS
Well-supported by SQL datastores and NoSQL graph stores, not so well by NoSQL document datastores
RELATIONAL VS DOCUMENT DATA MODEL
Document data model
Schema flexibility
Most document DBs do not enforce a schema on data in the documents
Better performance due to locality (see JSON example)
For some applications closer to the data structures used by the application
Concept of foreign key: document reference
Resolved at read time by join or follow-up queries
Relational data model
Better support for joins
Good support for many-to-one and many-to-many relationships
CHOICE FOR RELATIONAL OR DOCUMENT MODEL
If data in application has document-like structure (tree of one-to-many relationships, where typically entire tree is loaded)
Good idea to use document model
Splitting a document-like structure into multiple tables can lead to cumbersome schemas and complicated app code
Limitations
Cannot refer directly to a nested item within a document but need to say something like “second item in list of positions for user X251”
If documents are not too deeply nested usually not an issue
If data in application has many-to-many relationships
Document model less appealing
Possible to reduce need for joins by denormalizing, but then app code needs to keep denormalized data consistent
Normalization: process of organizing a DB to reduce redundancy and improve data integrity by dividing tables into smaller, related tables and defining relationships between them
Denormalization: process of combining related tables into a single table to improve read performance at the expense of data redundancy and update / write performance
Duplicates data that would otherwise require joins
Joins can be emulated by making multiple requests to DB, but complicates application code and usually slower than join made inside DB
Highly interconnected data: graph model may be most appropriate (see later)
Document DBs
schema flexibility (2)
Data locality for queries
SCHEMA FLEXIBILITY
Document DBs and JSON support in relational DBs usually do not enforce any schema on data in documents
Schema-on-read
Structure of the data is implicit and only interpreted when the data is read
Similar to dynamic (runtime) type checking
Schema-on-write
Approach of relational DBs with explicit schema
DB ensures all written data conforms to explicit schema
Similar to static (compile-time) type checking
Difference between approaches noticeable when application wants to change format of its data
Schema-on-read approach is advantageous if items in collection do not all have same structure
DATA LOCALITY FOR QUERIES
Document usually stored as a single continuous string (JSON, XML or binary variant)
If application often needs to access entire document → performance advantage to storage locality
Locality advantage only applies if you need large parts of document at once
DB needs to load entire document
On updates entire document usually needs to be rewritten
Recommended to keep documents small and avoid writes increasing size
These limitations reduce the set of situations in which document DBs are useful
Grouping related data for locality is not limited to document model
Graph like data models
wanneer
Property graph
voordelen graph data models (EX)
querying data
What if many-to-many relations are very common in your data?
-> More natural to model data as a graph
Vertices (nodes or entities)
Edges (relationships or arcs)
PROPERTY GRAPHS
Each vertex
Unique identifier, Set of outgoing edges, Set of incoming edges, Collection of properties (key-value pairs)
Each edge
Unique identifier, Vertex at which edge starts (tail vertex), Vertex at which edge ends (head vertex), Label to describe type of relationship between two vertices, Collection of properties (key-value pairs)
Graph store can be thought of as consisting of two relational tables (vertices and edges)
Important Properties
Any vertex can have an edge connecting it with any other vertex
No schema restricting which kind of things can or cannot be associated
Given any vertex, efficiently find both incoming and outgoing edges and thus traverse graph
Indexes on both tail_vertex and head_vertex
By using different labels for different kinds of relationships, able to store several different kinds of information in a single graph, while maintaining a clean data model
Voordelen van Graph Data Models
Noteworthy difficulties for relational models
Different kinds of regional structures in different countries
Quirks of history: country within a country
Varying granularity of data
Graphs good for evolvability
As features get added: easily extend the graph to accommodate changes in application’s data structures
Querying data
Cypher query language:
Declarative query language for property graphs
As graph data can be put in relational tables can it be queried using SQL?
Yes, but
In relational DB usually known in advance which joins are needed in query
In graph DB query may need to traverse a variable number of edges before finding vertex you are looking for
Number of joins is not fixed in advance
Variable-length traversal in SQL = recursive common table expressions (WITH RECURSIVE)
OLTP vs OLAP (EX)
In early days writes to DB typically corresponded to commercial transactions (e.g. making a sale, placing an order, paying a salary)
DBs started being used for many different kinds of data
E.g. comments on posts, actions in a game, contacts in an address book
Basic access pattern remained similar to processing business transactions
App looks up small number of records by some key, using an index
Records are inserted or updated based on user input
Because these apps are interactive, access pattern became known as Online Transaction Processing (OLTP)
DBs also started being used for data analytics with very different access patterns
Analytic query scans over huge number of records, reading few columns per record and calculating aggregate statistics E.g. what was total revenue of each of the stores in January?
E.g. how many more products than usual were sold during our last promotion?
Analytic queries often written by business analysts
Query results feed reports to help management make informed decisions → business intelligence
Access pattern became known as Online Analytic Processing (OLAP)
At first same DBs were used for OLTP and OLAP queries
Early 1990s however OLAP queries started being run on a separate DB called the data warehouse
data warehouse (EX)
waarom
wat
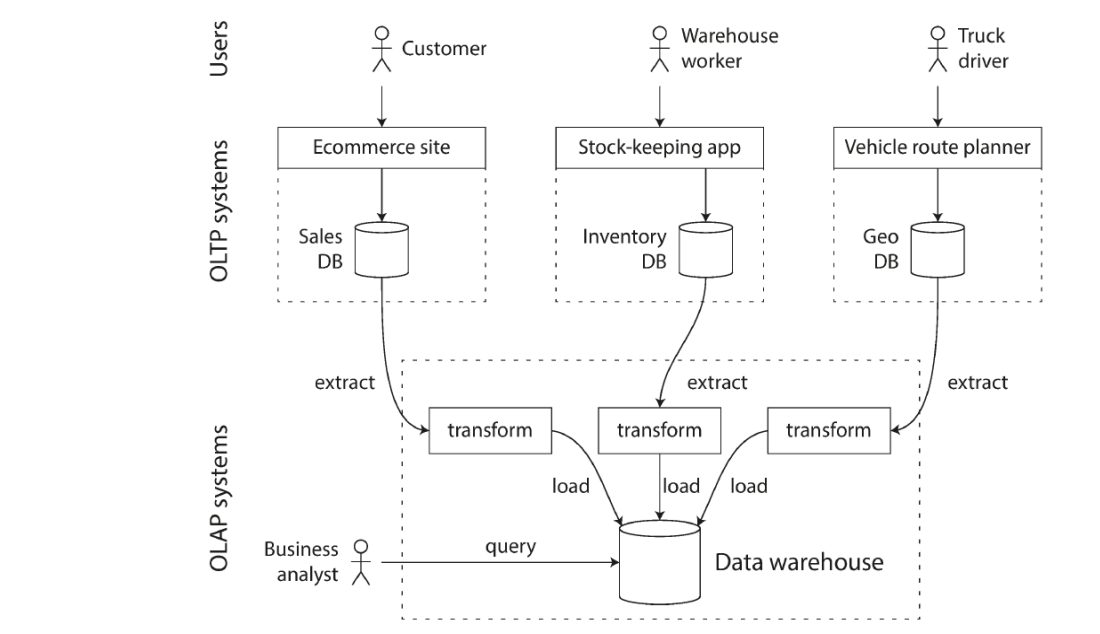
ETL principe → figuur!
OLTP systems usually expected to be highly available and to process transactions with low latency as they are critical to business
Reluctance to let business analysts run ad hoc analytic queries on OLTP databases (queries usually expensive, harming performance)
Introduction of data warehouse, allowing queries without affecting OLTP operations
Contains read-only copy of data in various OLTP systems
Extracted from OLTP systems by periodic data dump or stream of updates
Transformed into analysis friendly schema
Cleaned up
Loaded into data warehouse
Process of getting data into warehouse is known as Extract-Transform-Load (ETL)
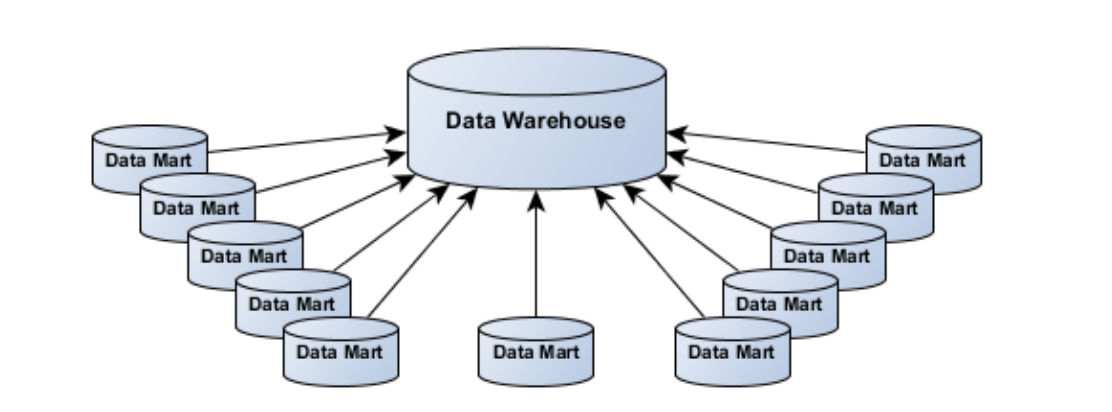
Data warehouse vs Data mart
Data warehouse
Centralised location for data
Holds multiple subject areas / very detailed information
Works to integrate all data sources
Source of data for reporting, analytics and offline operational processes
Typically employs expensive DB technology
Data mart
DBs used to provide fast, independent access to a subset of warehouse data
Often created for departments, projects, users
Compared to data warehouse
Similar technology, subset of data, relieves pressure on enterprise data warehouse, provides sandbox for analysis
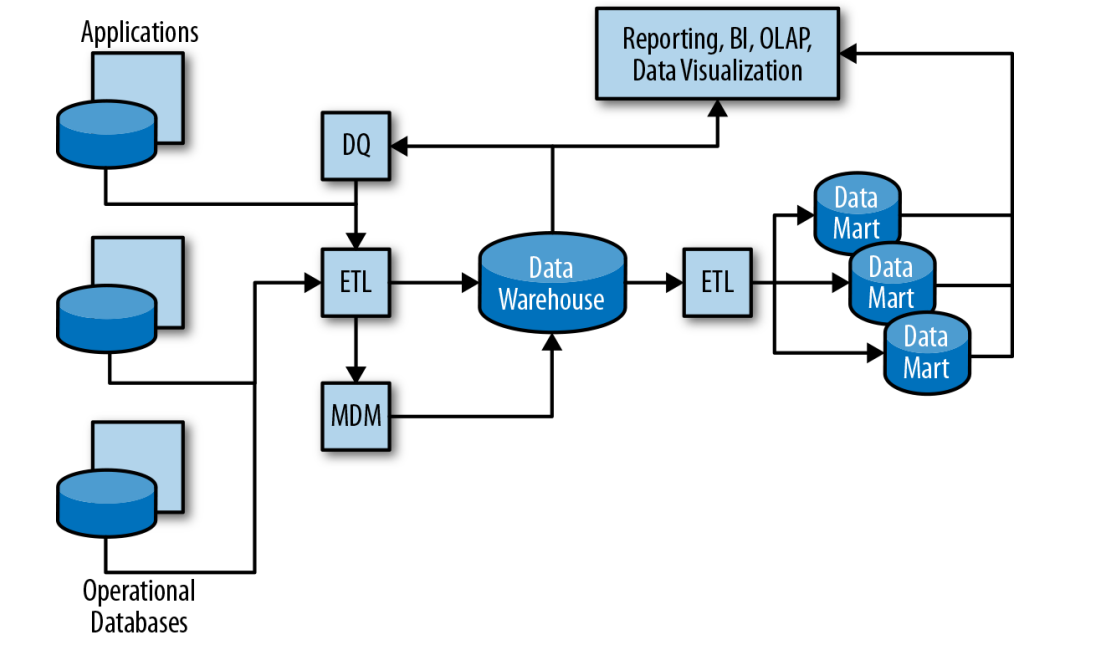
Data flow in the datawarehouse (5) (EX)
→ figuur!
DQ: Data Quality Tools
Defining quality rules, applying those rules to data to detect violations/exceptions and fixing those exceptions
Data profiling automatically gathers statistics about data to ascertain its quality e.g. how many values are empty, minimum and maximum values, most frequent values, etc.
ETL: Extract Transform Load (zie eerder)
MDM: Master Data Management systems
Creation of master lists of various entities: customers, products, suppliers, etc. and detecting multiple records that apply to the same entity and fixing ambiguities
OLAP: Online Analytical Processing Tools (technology behind BI)
BI: Business Intelligence
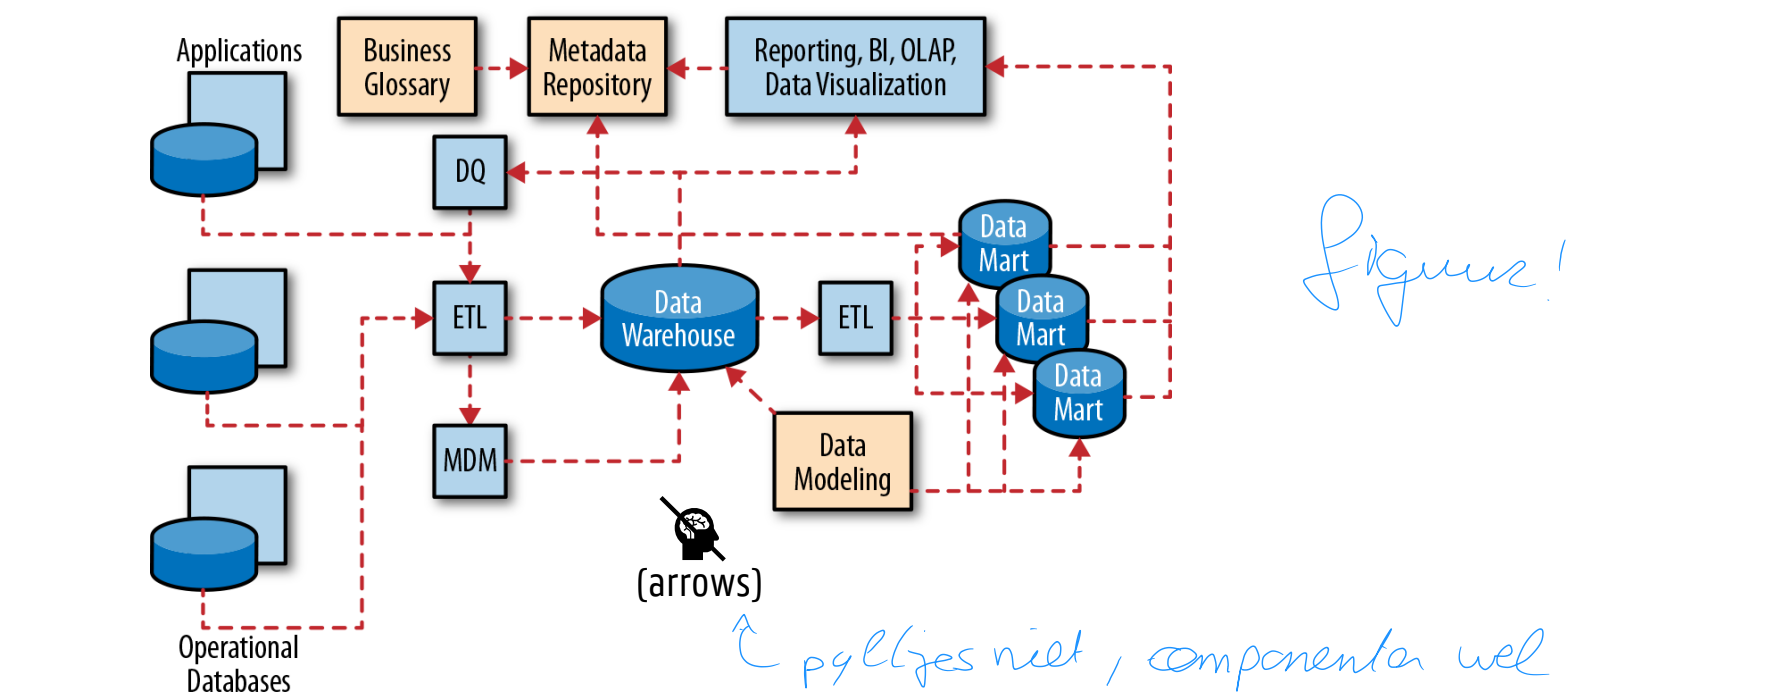
Metadata flow in datawarehouse
→ figuur!
Metadata repositories
Contain technical metadata across the data assets
Three main use cases
Finding data assets
Tracking lineage (provenance): where data came from and how it was generated/transformed a.k.a. data trail auditing
Impact analysis: allows developers to see all data assets that rely on a particular field or integration job before making a change
Data warehouse data model
algemeen (verschil OLTP OLAP)
star schema
slowly changing dimensions
DB at the heart of a data warehouse
Usually relational DB optimized for analytics-type processing
DB usually heavily indexed and tuned to ensure optimal performance for most common queries
When relational DBs are used to support operational systems and applications (OLTP) data is usually stored in highly normalized data models
Create tables with minimum redundancy and smallest possible number of fields
Makes updates (writes) very fast
Data warehouses however favour denormalized data models (for OLAP)
Each table contains as many related attributes as possible
Typically contains data from many sources and applications each with their own schema
Data from those sources has to be converted to a single schema
Typically uses a star schema (dimensions / fact tables)
Many DBs include specialized query optimizations for handling star schema-like joins
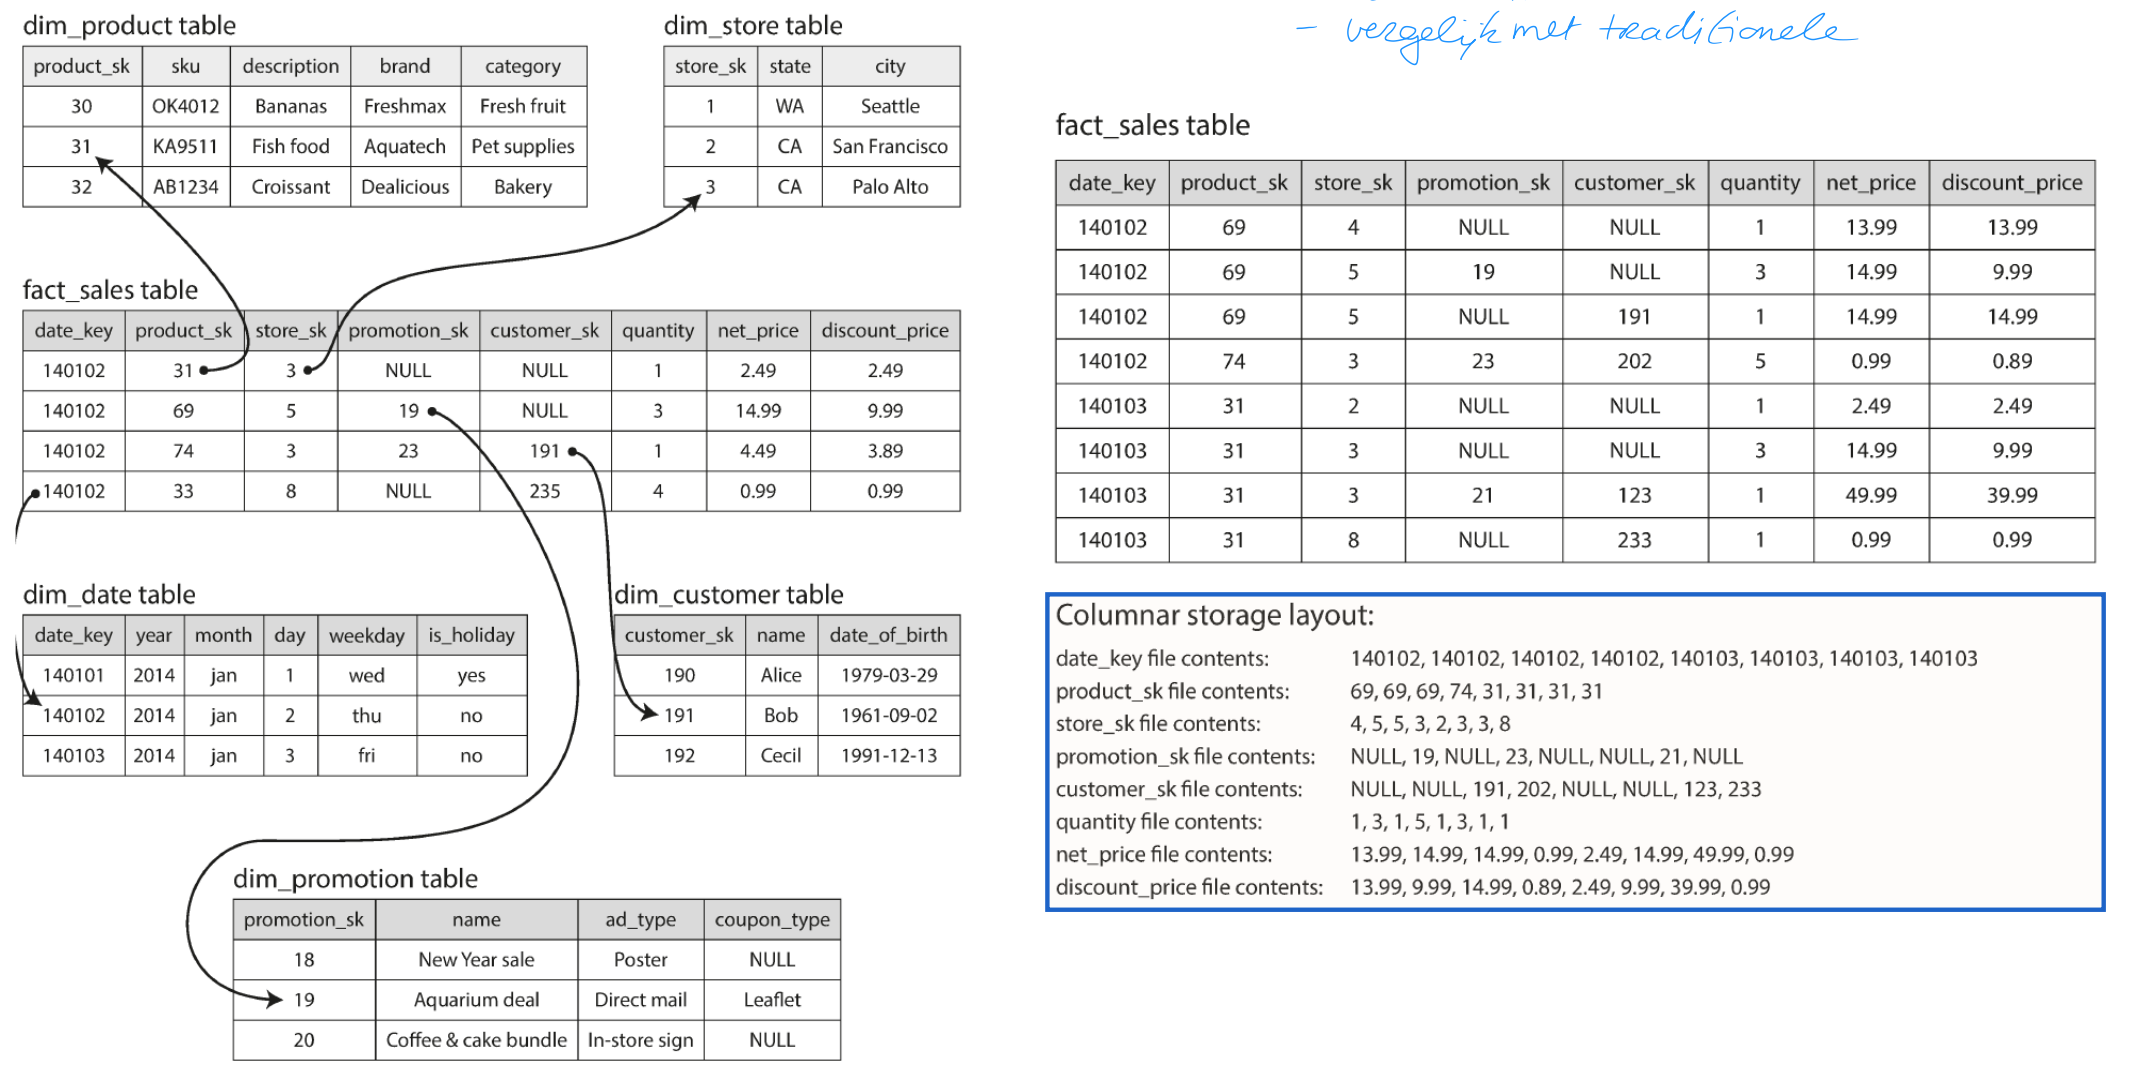
STAR SCHEMA
Data warehouses use star schemas a.k.a. dimensional modelling
Centre of schema is fact table
Each row represents an event occurring at a particular time
Fact tables can get very large
Some columns are attributes
Other columns foreign key references to other tables: dimension tables
Why is it called star schema?
When table relationships are visualized, fact table is in middle surrounded by dimension tables
Typical data warehouses often have fact tables that have over 100 columns, up to several 100s
SLOWLY CHANGING DIMENSIONS
To allow accurate data analysis sometimes needed to keep track of e.g. a person’s state over time
Ensures each transaction corresponds to person’s state at time of transaction
Most common type of slowly changing dimension tracks historical data by creating multiple records
Example
Keep track of customer purchases along with customer demographics (single, married, parent, divorced, etc.)
Without slowly changing dimensions we would have one single record for a customer reflecting only current demographic state
Difficult to analyse how many people with children spend money on specific items
Add complexity to ETL jobs and analytic queries
Data warehouse: Column Oriented storage (EX)
vergelijk met traditioneel
eigen voorbeeld
Typical data warehouse query only accesses 4 or 5 columns at one time
In most OLTP DBs storage is laid out in row-oriented fashion
All values from one row of a table are stored next to each other
Document DBs are similar: entire document is stored as one continuous sequence of bytes
Performance issues when loading all these rows from disk into memory, parsing them and filtering out those that don’t meet required conditions
Column-oriented storage: do not store all values from one row together, but store all values from each column together instead
If each column is stored in a separate file, a query needs only read and parse those columns used in the query
Example
Customers table with 300 columns, average of 5 bytes per attribute stored
1.5KB for each user
1 million customers
Relational
1.5TB storage for DB
Columnar
If age takes 2 bytes and a record identifier 6 bytes, DB needs 8 bytes per field, or 8GB for 1 mil customers
Queries like: “how many customers are under 30?” can be answered very fast
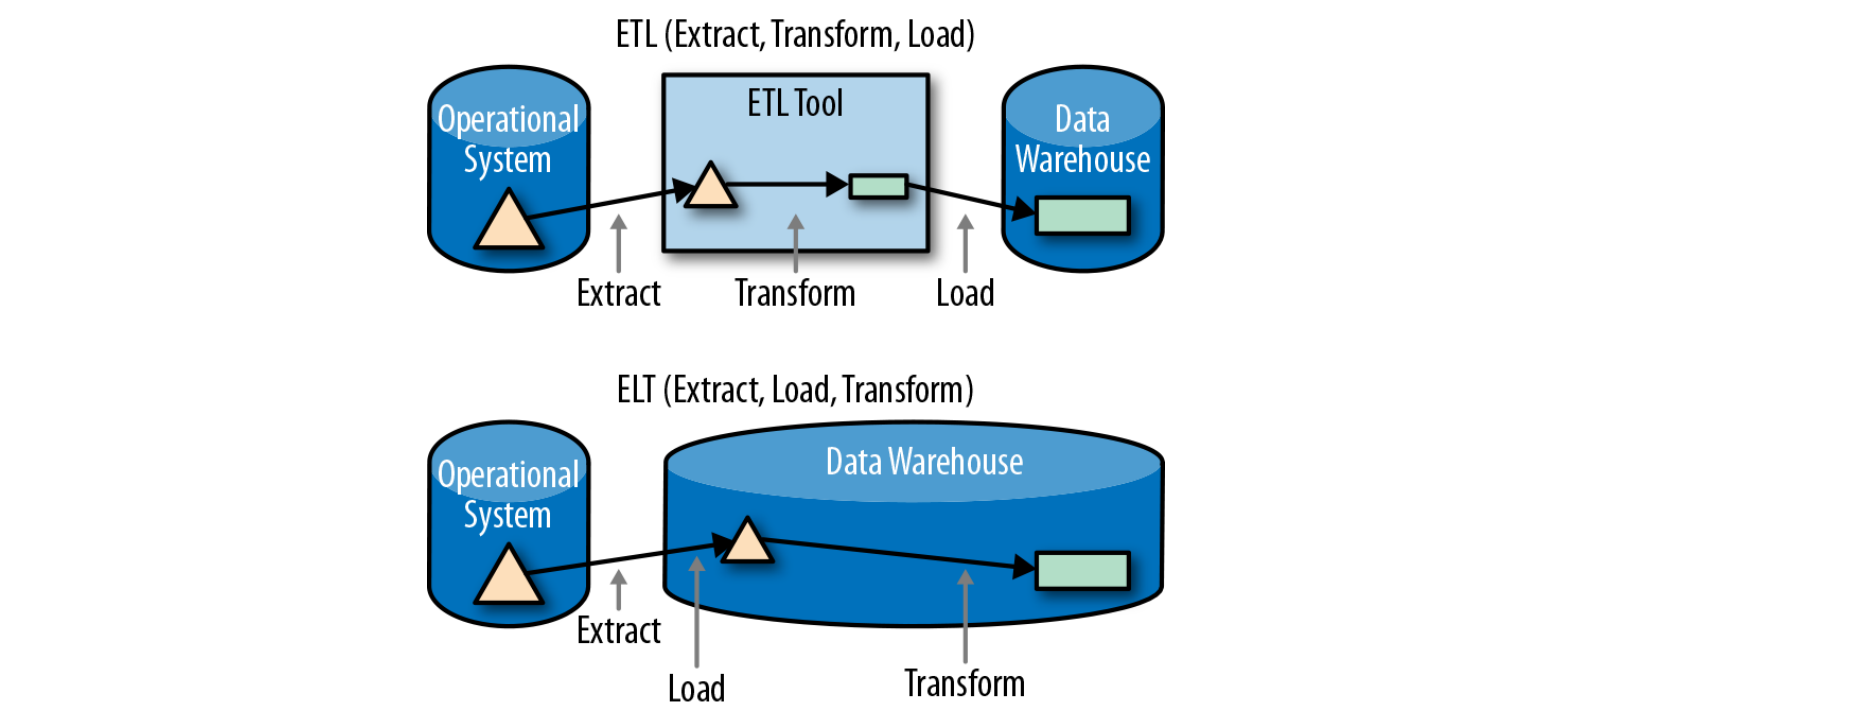
ETL vs ELT
→ figuur!
Extract Transform Load (ETL)
Data is extracted, transformed and loaded into data warehouse
Sometimes data from different systems used to create or update a single record = conforming dimension
Extract Load Transform (ELT)
Data is extracted, loaded into data warehouse and transformed
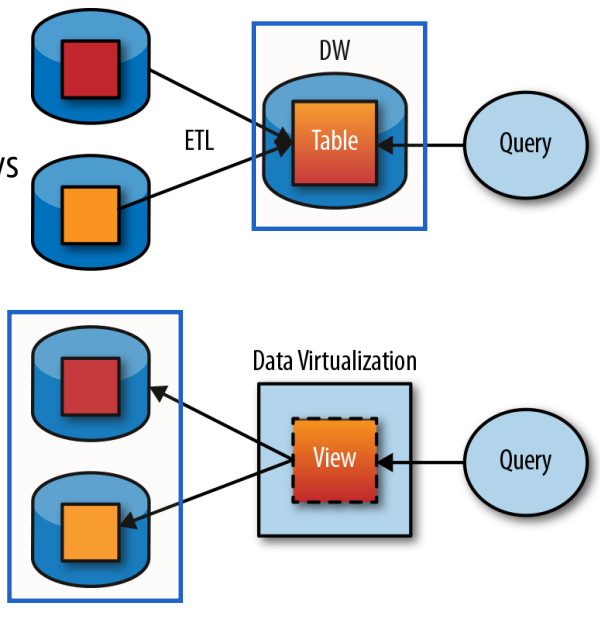
Virtualised data warehouse
wat
wnr
nadelen
figuur!
Data warehouse approach is to bring all data together in one place, integrate it into a single conforming schema and use it for analytics queries
Alternative
Create logical or virtual schema across multiple systems and issue queries against that schema
A.k.a. Federation, Enterprise Information Integration (EII) and data virtualisation
Approach is more appropriate than using a data warehouse when
Data must be kept fresh in the face of changes: execute queries against original sources, results always up to date
Data access is infrequent: building very expensive data warehouses for data infrequently used is not cost-effective
Compliance and data residency clauses constrain data from being copied to a data warehouse
Drawbacks
Labor-intensive manual process: virtual tables must be manually defined across disparate systems
Schema and logic changes: schema change can break queries and make all data unavailable until queries are fixed
Performance: queries that span multiple systems (federated queries) have significant performance challenges
Frequency: if there are a lot of queries against virtual schema, it becomes more advantageous to extract data once, store it in a data warehouse and query it there: lowers load on source systems
wat is een Data lake
Self-service is taking over from carefully crafted and labor-intensive approaches of the past
IT professionals created well-governed data warehouses and data marts but took months to make changes
Data lake focusses on self-service
Take-aways: data in original form and format and used by various users
Allow analysts to analyse data without having to get help from IT
Data preparation tools that help analysts shape data for analytics
Catalog tools that help analysts find the data they need
Data science tools that help perform advanced analytics
Challenge with self-service is governance and data security
How to make data available to analysts without violating internal and external data compliance regulations?
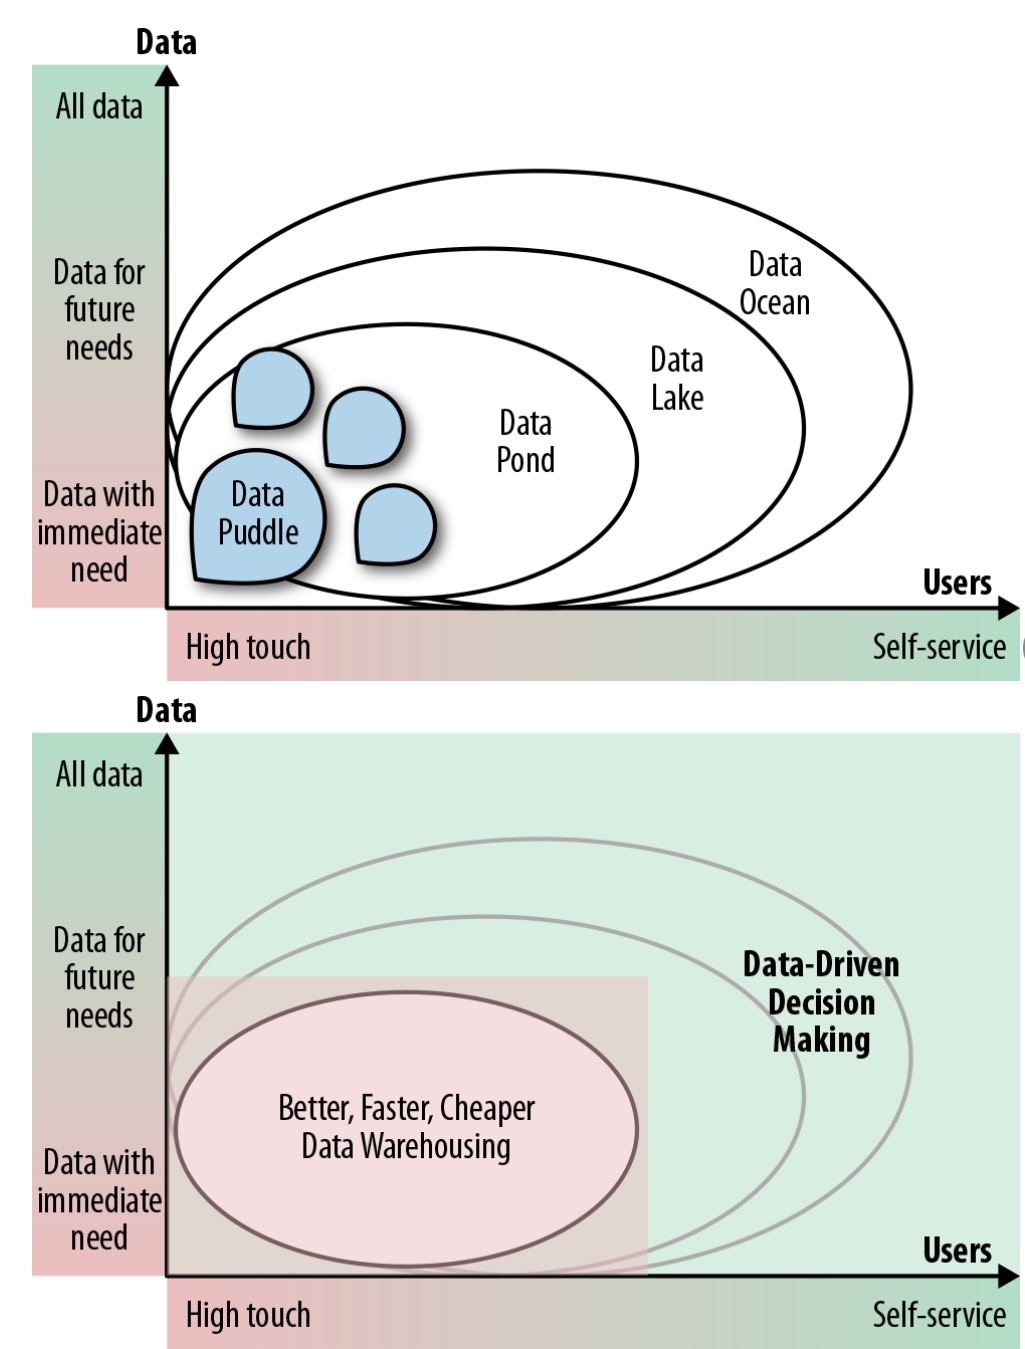
Data lake maturity (4)
(denk aan figuur)
Data puddle
Single purpose or single project data mart built using big data / cost-efficient technology
Data pond
Collection of data puddles
Focus on scalable / cost-efficient technology compared to data warehouse / mart
Data lake
Supports self-service: business users able to find and use data sets that they want to use without having to rely on help from IT department
Aims to contain data that business users may possibly want even if there is no project requiring it at the time
Data ocean
Expands self-service data and data-driven decision making to all enterprise data, wherever it may be
Data lake succes factors: Platform
4 zaken
ezelsbrug
VCV FP
Big data technologies like Hadoop, cloud solutions like AWS, Azure and Google Cloud Platform
Volume: designed to scale out
Cost: ability to store and process huge volumes of data inexpensively
Usually at one-tenth to one-hundredth the cost of a commercial relational DB
Variety: filesystems or object stores that allow to store all sorts of files e.g. Hadoop HDFS, MAPR FS, AWS S3
Unlike relational DB requiring schema on write, a filesystem or object store does not care what you write (schema on read)
Future-proofing
If data is stored in a relational DB it can only be accessed by that relational DB
Hadoop and big data platforms very modular: Hive can provide a SQL interface to Hadoop files, to Pig scripts, to Spark, to MapReduce, etc. (seen in later slidedecks)
Data lake succes factors: Data
Most data collected by enterprises today is thrown away
Small percentage of data aggregated and kept in data warehouse for a few years
Issue with data silos: different departments hoard their data, making it difficult to use data cross-groups
Data lake: store as much data as possible for future use
Typically, no known reason for storing the data, but do so in case data is needed one day
Makes no sense to convert or treat data prematurely → save data in its native format
Consumes raw data and prevents data silos
Data lake succes factors: Interface
To gain wide adoption and reap benefits of helping business users make data driven decisions, solutions companies provide must be self-service
Users must be able to find, understand and use data without help from IT department
IT unable to scale support to such a large user community and such a large variety of data
Interface at the right level of expertise
Analysts
Often do not possess skills to use raw data: too much detail, too granular, too many quality issues
Data has to be harmonized: put in same schema with same field names and units of measure
They want “cooked” data, not raw data
Data scientists
Want access to raw data, not the cooked data
Possible by setting up multiple zones / areas that meet particular needs
Setting up data lake
4 stappen
Set up the infrastructure
E.g. get the Hadoop cluster up and running
Organize the data lake
Create zones for use by various user communities and ingest data
Set the data lake up for self-service
Create catalogue of data assets, set up permissions and provide tools for analysts to use
Open data lake up to users
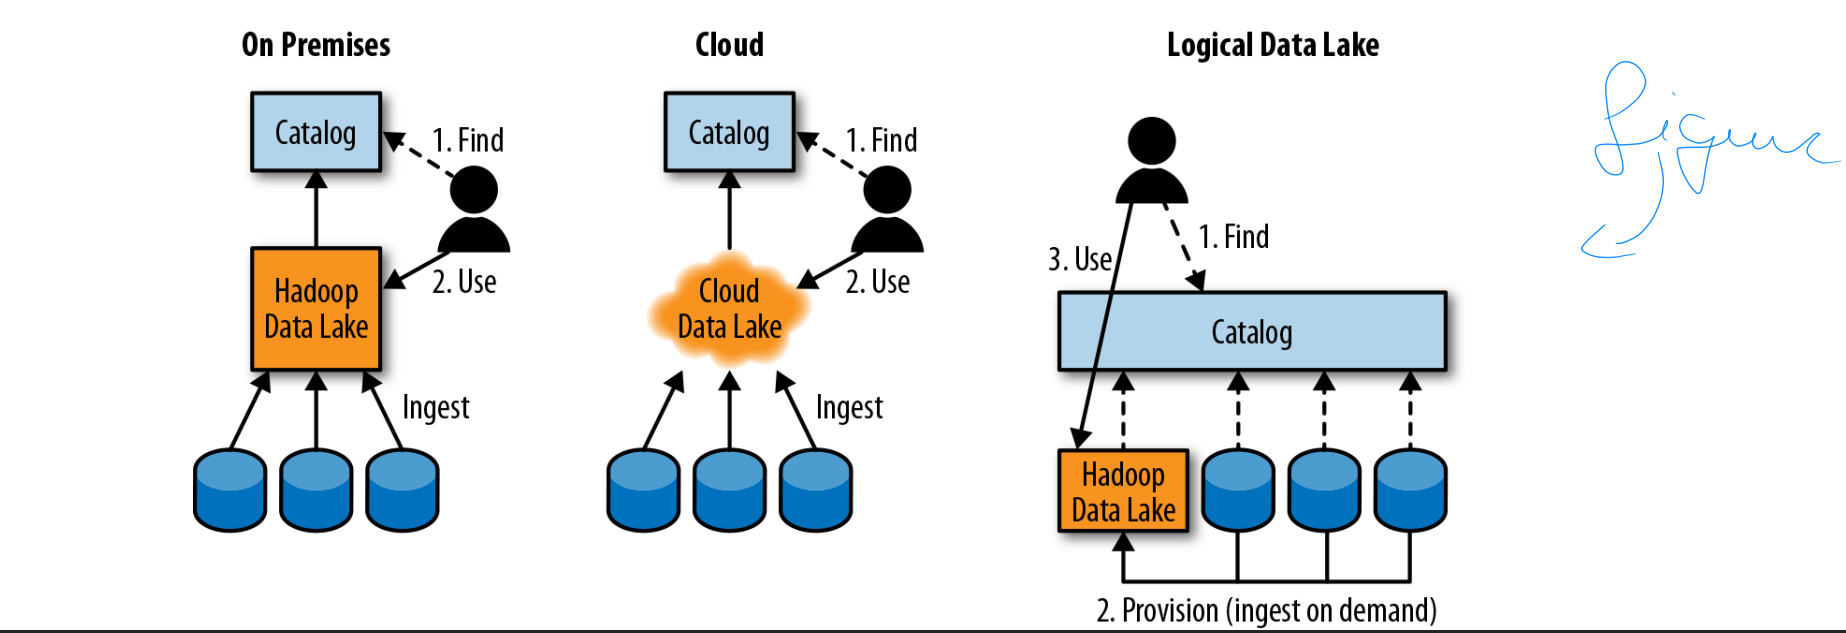
Setting up data lake: 1 Set up the infrastructure (EX)
3 mogelijkheden
figuur!
Initially data lakes were built mostly on-premise using open-source or commercial Hadoop distributions
Later cloud-based data lakes or hybrid cloud/on-prem data lakes started being used
Latest evolution: logical data lake: a virtual data lake layer across multiple heterogeneous systems
Hadoop, relational, NoSQL DBs, on-premise and in the cloud
All use a catalogue to find data assets
Setting up data lake: 2 Zones: organizing the data lake
zones → figuur!
governance
Raw or landing zone where data is ingested and kept as close as possible to the original state
Gold or production zone where clean, processed data is kept
Dev or work zone where more technical users (data scientists / engineers) work
Can be organised by user, by project, by subject, etc.
Once analytics performed in work zone get productized → moved into gold zone
Sensitive zone that contains sensitive data
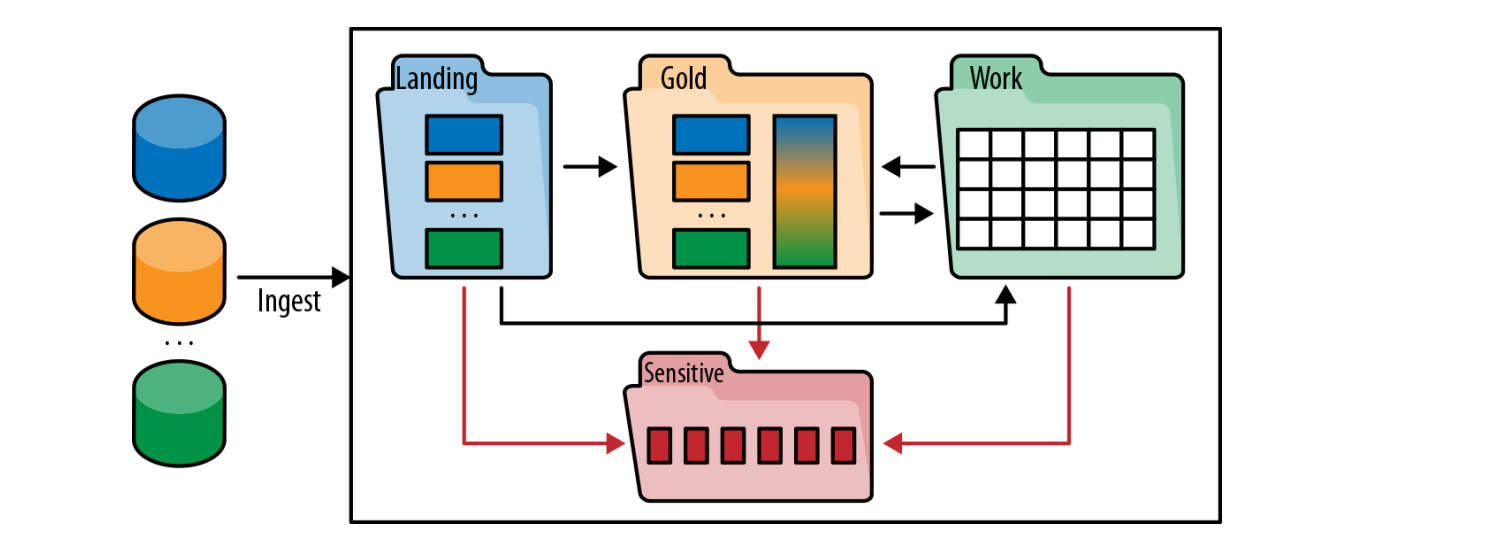
Governance should reflect data usage and user community requirements
Different zones have different levels of governance and SLAs
Data in the gold zone is strongly governed, well curated, well documented, carries quality and freshness SLAs
Data in the work area has minimal governance (mostly making sure there is no sensitive data) and SLAs that vary from project to project
Setting up data lake: 3 setting up for self service
4 stappen
Analysts typically go through four steps to do their job
Find and understand
Provision (get access to the data)
Prepare (clean and convert)
Analyse (answer questions, create visualisations and report)
First three steps typically take 80% of an analyst’s time
60% is in the first step of finding and understanding data
setting up for self service: 1 finding and understanding data
Variety and complexity of available data far exceeds human ability to remember it
Typical companies have 1000s of DBs, with typically many 100s of tables with each table having many 100s of fields
Typical project
Ask around to see whether anyone has ever used a particular type of data
Stumble onto data set that someone has already used
Once decided to use that data set spend a lot of time deciphering what the data it contains means
Knowledge about what data means is usually spread throughout the company
Analyst crowdsourcing tools collect this information to document data sets using simple descriptions composed of business terms and builds a search index to help them find what they are looking for
setting up for self service: 2 Accessing and provisioning the data
Once right data sets identified → analysts need to be able to use them
Publish information about all data sets in a metadata catalogue so analysts can find useful data sets and request access as needed
Requests include justification for access, project that requires the data and duration of access required
Incoming request may trigger work to deidentify sensitive data
Provisioning or physical access can be granted in a number of ways
Users can be granted read access to the entire data set
If only partial access should be granted, a copy of the file containing just the data appropriate to the user can be created (and kept up to date) or a table or view can be created that contains only the fields and rows that the analyst should see
If needed, a de-identified version of the data set can be generated that replaces sensitive information with randomly generated equivalent information, so all applications still work, but no sensitive data is leaked
setting up for self service: 3 Preparing the data
Most of the time data needs work to render it appropriate for analysts. This generally involves the following operations
Shaping
Selecting a subset of fields and rows to work on, combining multiple files and tables into one (joining), transforming and aggregating, converting variables to features (e.g. converting age into a feature that has a value of 0 if a person is over 65 and 1 if not)
Cleaning
Filling in missing values, correcting bad values, resolving conflicting data, normalizing units of measure and codes to common units
Blending
Harmonizing different data sets to the same schema, same units of measure, same codes, etc.
Data lake architectures
Initially thought one huge on-premise data lake would contain all their data
Not ideal, multiple data lakes typically proven to be a better solution
Different data sovereignty regulations
Organizational pressures
Frustration at finding experienced administrators for setting up and maintaining complex Hadoop (and other big data technologies) cluster
High interest in Cloud-based data lakes where most hardware and platform components are managed by experts that work for Amazon, Microsoft, Google and others
DATA LAKES IN THE PUBLIC CLOUD
Access to big data technology expertise
Short deployment times
Low cost of storage and elastic nature of cloud computing make it an attractive option for implementing a data lake
A lot of data is being stored for future use, so makes sense to store it as inexpensively as possible
Cost optimization possible through various storage tiers offered by public cloud vendors: from high- speed to glacial, with slower-access media being significantly cheaper
Elasticity of cloud computing allows a very large cluster to be spun up on demand when needed
Compared to on-premise: as nodes fill up with data, new nodes need to be added just for storage
If analytic loads are CPU-heavy and need more compute power, you need to add even more nodes, even though you may only use them for a short time
In the cloud you pay for the storage and processing that you need
Data lake virtualization: logical data lakes
→ figuur
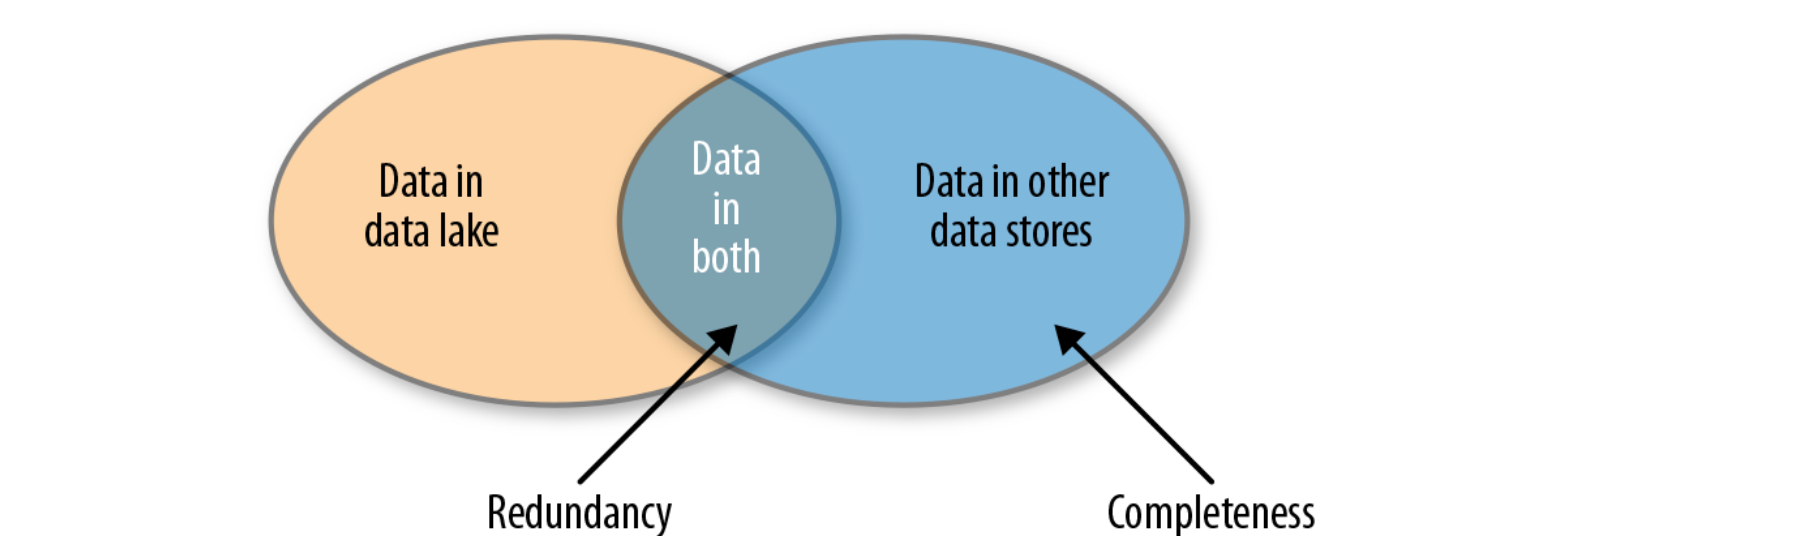
nstead of loading all data into the data lake in case someone may actually need it, it is made available to analysts through a central catalogue or through data virtualization software
Address the issues of completeness and redundancy
Completeness
If analysts can find only data that is already in the data lake other data that has not been ingested into the data lake won’t be found
Redundancy
If we ingest all data into the data lake, we will have redundancy between the sources of data and the data lake
With multiple data lakes, to achieve completeness we would need to ingest the same data into each data lake
Already a lot of redundancy in the enterprise
Data lake virtualization: managing data in the logical data lake
→ figuur
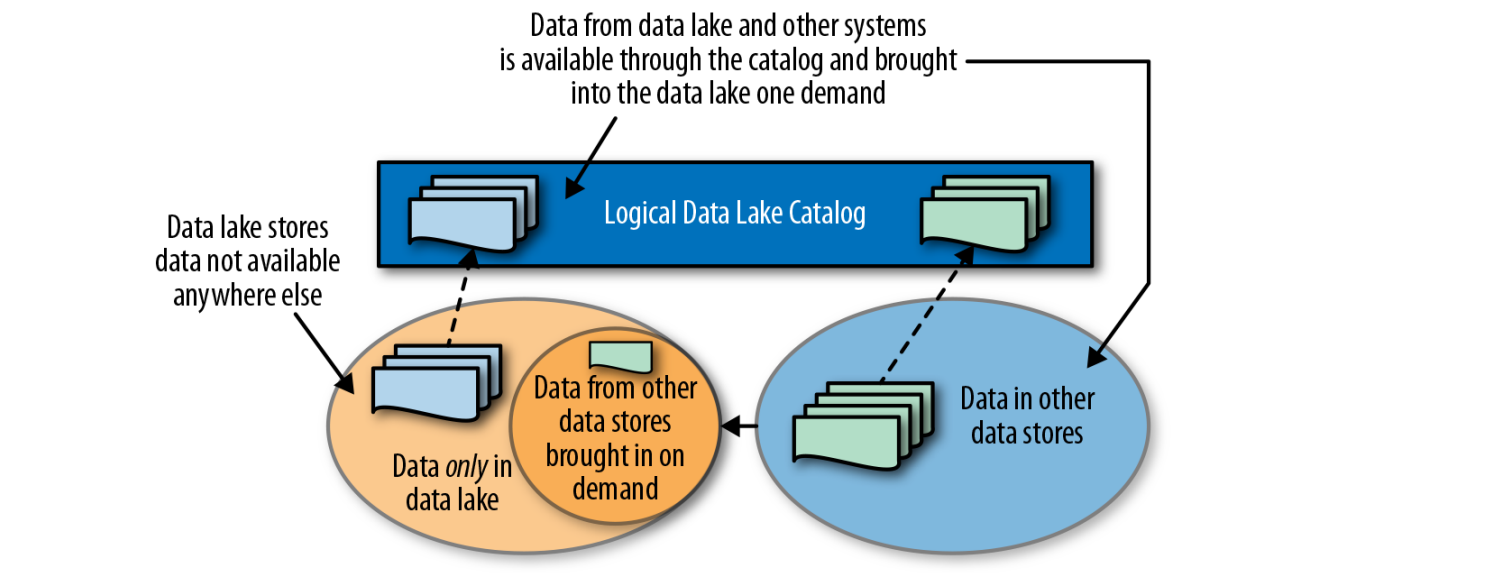
Handling completeness
Create a catalog of all the data assets so the analysts can find and request any data set that is available in the enterprise
Handling redundancy
Store data that is not stored anywhere else in the data lake
Bring data that is stored in other systems into the data lake if and when it is needed, and keep it in sync while it is needed
Bring each data set in only once for all users
Data lake virtualization: Virtualisation vs catalog based data lake
→ figuur
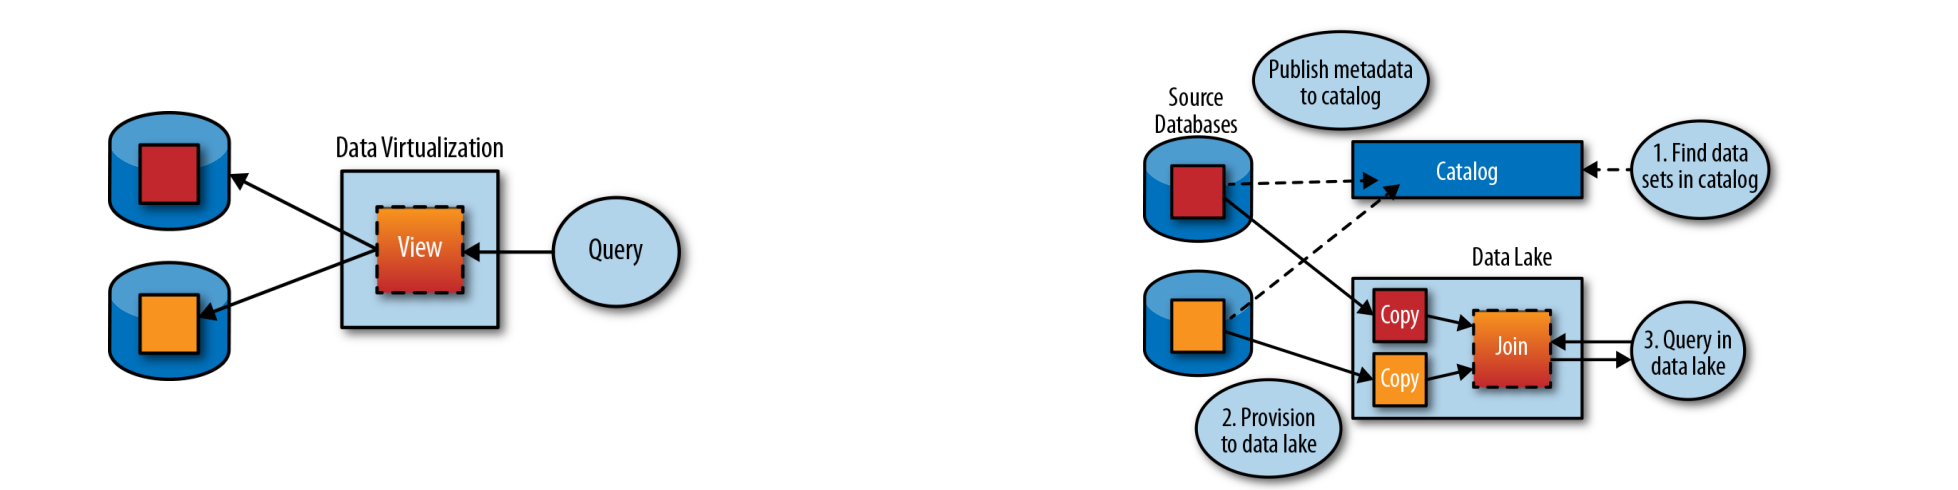
Virtualization a.k.a. federation or EII (Enterprise Information Integration)
Technology developed in 1980s improved into the 2010s
Creates virtual view or table that hides location and implementation of the physical tables
E.g. view created by joining two tables from different DBs
For logical data lake: would require every data set to be published as a virtual table and kept up to date as underlying table schemas change
Views present significant problems
Creating a virtual view does not make data any easier to find
Joining data from multiple heterogeneous systems is complex and compute-intensive, causing massive loads on the systems and long execution cycles
By contrast: in catalog-driven approach only metadata about each data set is published in order to make it findable
Datasets then provisioned to the same system (e.g. Hadoop cluster) to be processed locally
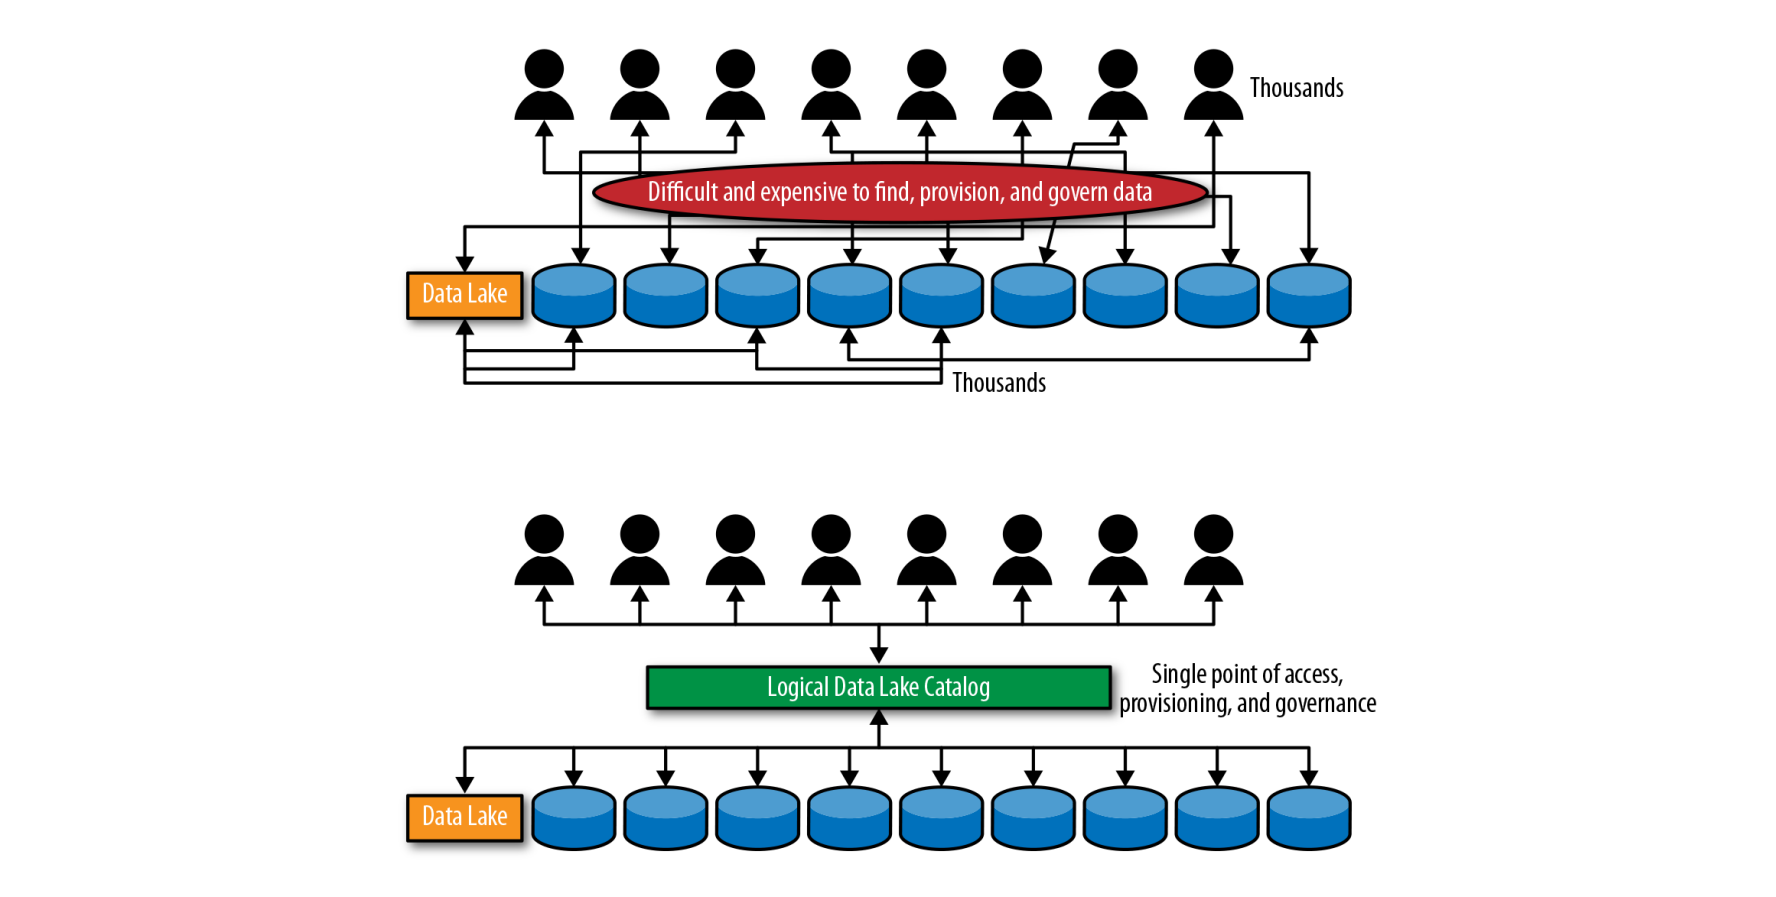
Data lake virtualization: catalog based logical data lake
Makes all data findable and accessible to analysts
Can serve as a single point of access, governance and auditing
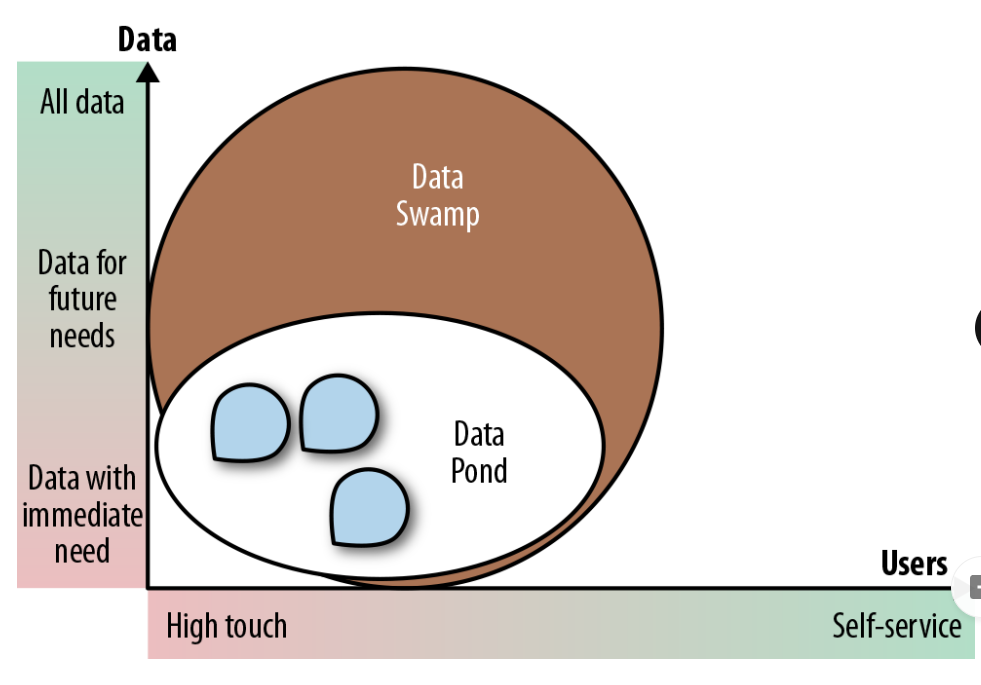
Data swamp
Data pond that has grown to size of a data lake but failed to attract a wide analyst community
Usually due to lack of self-service and governance facilities
Figure
Various teams use small areas of lake for projects (white data pond area)
Majority of data is dark, undocumented / unusable
Historically a lot of companies rushed to buy Hadoop clusters and filled them with raw data
Millions of files containing petabytes of data and no way to make sense of that data
No one could tell where the sensitive data was, so users could not be given access and data remained largely unusable and unused
Example: company built a data lake, encrypted all data in lake to protect it, required data scientists to prove that data they wanted was not sensitive before it would unencrypt it and let them use it
Because everything was encrypted, data scientists could not find anything, much less prove it was not sensitive
Noone used the data lake / swamp
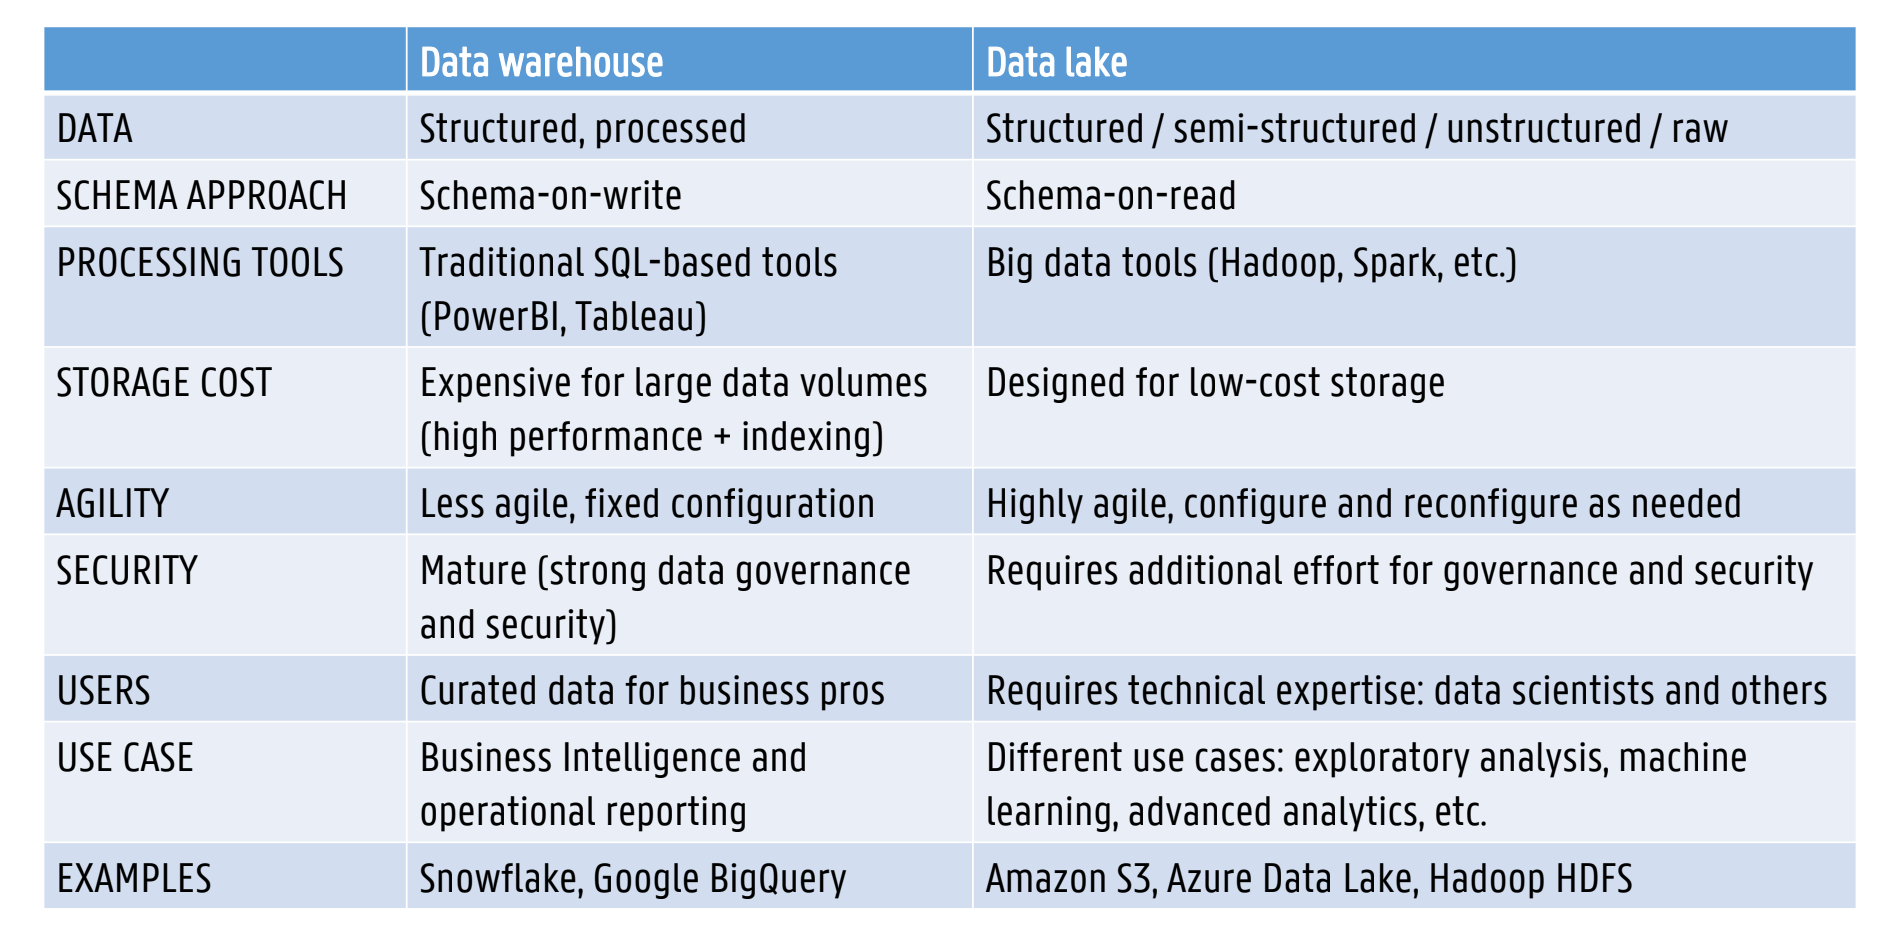
Data Warehouse vs Data Lake (EX)