Macro Unit 2: Economic Indicators and the Business Cycle
1/68
There's no tags or description
Looks like no tags are added yet.
Name | Mastery | Learn | Test | Matching | Spaced | Call with Kai |
|---|
No analytics yet
Send a link to your students to track their progress
69 Terms
GDP
C + I + G + (X-M)
GDP Deflator
(nominal GDP/real GDP) x 100
GDP per capita
GDP/population
Labor force participation rate
(Labor force/population age 16 and older) x 100
Unemployment rate
Number of unemployed workers/ Labor force ) x 100
Actual Unemployment
Natural Unemployment + Cyclical Unemployment
Natural Unemployment
Frictional Unemployment + Cyclical Unemployment
Inflation rate
(Price level Year 2 - Price Level Year 1)/Price level year 1) X 100
Price Index in Year Y
(Cost of Market Basket in Year Y )/Cost of Market Basket in Base Year) x 100
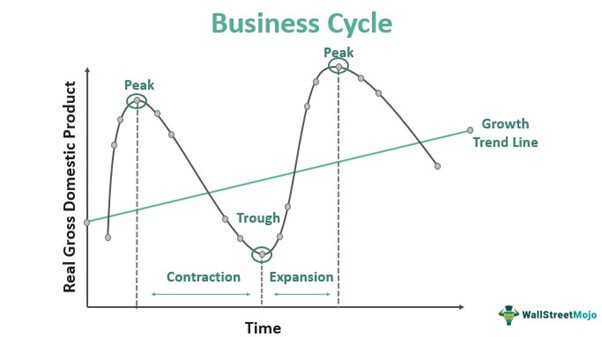
Business Cycle Graph
National income and product accounts
keeps track of the flows of money among different sectors of the economy
Product Markets
Where goods and sercices are bought and sold
Consumer Spending
household spending on goods and services
Factor markets
where (capital and labor) are bought and sold
Government Spending
total expenditures on goods and services by federal state and local governments
Taxes
required payments to the government
Tax revenue
total amount of funds the government receives from taxes
Disposable Income
equal to income + government transfers - taxes
Government Transfers
payments that the government makes to individuals without expecting a good or service in return
Private Savings
equal to disposable income minus consumer spending, is a houeholds disposable income that is not spend on consumption
Financial Markets
channel private savings into investment spending and government borrowing
Government Borrowing
amount of funds borrowed by the government in the financial markets
Investment Spending
spending by firms on new productive physical capital, like machinery and structures or changes in inventories
Inventories
stocks of goods and raw materials
Exports
goods and services sold to other countries
Imports
Goods and services purchased from other countries
Gross domestic product
total value of all final goods and sercices produced in the economy during a given year
Expenditure approach
the sum of consumer spending, investment spending, government purchases of goods and services, and exports, minus imports
Income approach
adds up the total factor income earned by households from firms in the economy, including rent, wages, interest, and profit
Value Added approach
surveys firms and adds their indivual contributions to the value of each good and service
Final goods and services
Goods, and services sold to the final or end user
Intermediate goods and services
bought from one firm by another firm to be used as inputs into the production of final goods and services
Net exports
the difference between the value of exports and the value of imports OR (X-M)
Employed
Currently holding a job in the economy - full or part time
Unemployed
Actively looking for work but arent currently employed
Discouraged Workers
Nonworking people who are capable of working but have given up looking for a job due to the state of the job market
Underemployed
workers who would like to work more hours or are overqualified for their jobs
Frictional Unemployment
Unemployment due to the time it takes to get a new job
Structural Unemployment
unemployment because workers lack the skills required for the available jobs OR more people seeking jobs in a labor market than there are jobs available at the current wage rate
Natural rate of unemployment
unemployment rate as a result of frictional plus structural unemployment
Cyclical Unemployment
deviation of the actual rate of unemployment from the natural rate
Inflation
rise in overall level of prices
Deflation
Fall in the overall level of prices
Price Stability
overall price is unchanging, or changing slowly
Real Wage
wage divided by price level to adjust for the effects of inflation or deflation
Real Income
income divided by the price level to adjust for the effects of inflation or deflation
Inflation Rate
percentage increase in the overall level of prices each year
Aggregate price level
Measure of the overall level of prices in the economy
Market Basket
Hypothetical set of consumer purchases of goods and services
Base Year
year arbitratily chosen for the comparison when calculating a price index
Price index
measures the cost of purchasing a given market basket in a given year — the index value is always equal to 100 in the base year
Consumer Price Index
measures the cost of the market basket for average family
Substitution Bias
occurs in cpi because items with prices that have risen the most will skew the cpi despite consumers substituting them
Producer Price Index
measures the prices of goods and services purchased by producers
Nominal interest rate
stated interest rate
real interest rate
nominal interest rate - rate of inflation
Disinflation
process of bringing inflation rate down
Aggregate output
total quantity of final goods and services produced within an economy
Real GDP
total value of all final goods and sercies produced in a given year, calculated using the prices of a selected base year to remove the effects of price changes
Nominal GDP
total value of all final goods and services produced in the economy during a given year, calculated with current prices
Business Cycle
alteration between economic recessions and expansions
Trough
lowest point of a recession before the economy starts expanding
Expansions
periods of economic upturns when output and employment are rising
peak
highest point of the buisness cycle before recession
depression
deep and prolonged downturn
Economic Growth
increase in the maximum amount of goods and services an economy can produce
Full employment levels of output
level of real GDP the economy can produce when all resources are fully employed
potential output
what an economy can produce when operating at maximum sustainable employment (Natural rate of unemployment)
output gap
difference between actual output and potential output