Normal distributions, z scores
1/13
There's no tags or description
Looks like no tags are added yet.
Name | Mastery | Learn | Test | Matching | Spaced | Call with Kai |
|---|
No analytics yet
Send a link to your students to track their progress
14 Terms
Standard deviance
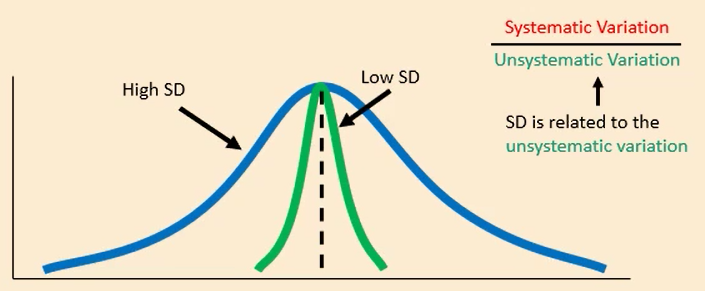
A number to tell us how spread out a set of observations are from their mean - related to unsystematic variation
Statistics
These are used to find out if the difference between certain groups is real (an actual effect occurring) (since there will always be some difference between groups)
Unsystematic variation
Variation that is not due to the effect we are interested in - this could be due to natural individual differences
Systematic variation
Variation due to a genuine effect or experimental manipulation
Test statistic
This is systematic variation divided by unsystematic variation. The larger this is, the more likely that the difference is real
Normal distribution
Where the data is spread symmetrically when visualised in graphs - the data has similar mean, median and mode.
These are common in nature and human behaviour
This can allow us to calculate how much of the population lies above/below a certain point
68%
In normal distributions, approximately this percentage of the scores fall within ±1 standard deviation
95%
In normal distributions, approximately this percentage of the scores fall within ±1.96 standard deviation
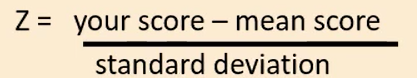
Z score
This is a way of talking about data in terms of number of standard deviations above/below the mean. It allows us to assess where an individual falls relative to the population as a whole.
AKA, it indicates the number of standard deviations a score is from the mean
Calculation is in picture
Calculations
(For z score)
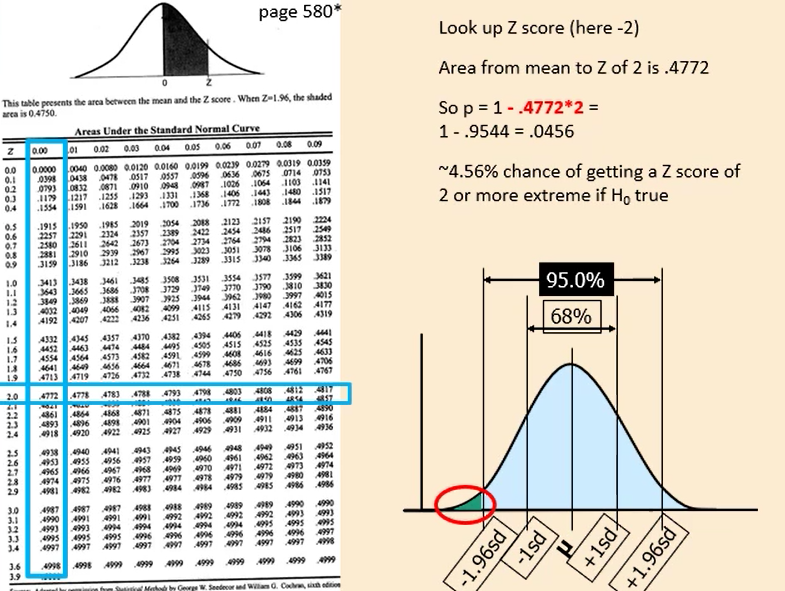
Z score of 0 is the mean of your distribution - the 0 column (in the crit value table) is used to find out the probability of scores from your z-score to the mean.
If you wanted to see the probability of scores between your z-score (say, 2) and 1 standard deviation, you would first find the probability between 2 and 0, then 1 and 0, then subtract the latter from the former.
Chances of a particular Z score occurring:
Z score of 2.5 = 0.4938 (against 0.00) (Area from mean to Z of 2.5)
P = 1 - .4938*2 (times 2)
= 0.0124
(1.24%)
Sampling distribution
A distribution of frequencies for a sample statistic (such as means)
If we want to see how the sample means vary, we can plot the distribution of sample means
This isn’t a distribution of actual scores but of mean values across many different samples
This (of the mean) is variation measured in Standard error; has a smaller SD than population mean, converges on the true mean and looks different as N changes (higher N smaller SD)
Population distribution
Variation measured in standard deviation
Standard error
The standard deviation of a sampling distribution is this
What happens
…when we use stats?
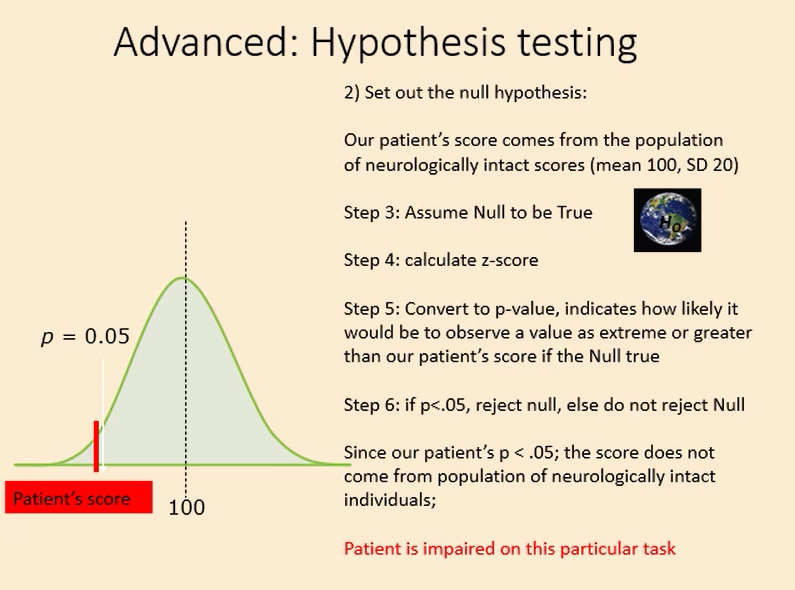
When we analyse data we assume the null hypothesis is true
p Value tells us the probability that the observed or more extreme result could have occured if the null hypothesis is true
If the result falls within either of the 2.5% extremes (outside of ± 1.96sd) then p < .05 and we say it is unlikely that we would have found this extreme if the null hypothesis was true (so the NH is rejected)