Linear Regression - Practice Questions (1&2 EMF)
1/30
There's no tags or description
Looks like no tags are added yet.
Name | Mastery | Learn | Test | Matching | Spaced | Call with Kai |
|---|
No analytics yet
Send a link to your students to track their progress
31 Terms
What does β₁ mean in
y = β₀ + β₁x + u
Change in y for a 1-unit change in x, ceteris paribus
What does β₁ mean in
wage = β₀ + β₁mast + u?
(mast is a dummy variable, where 1= have master, 0=no master)
Average wage difference between those with and without master’s degree
If wage = 1500 + 500mast, what is wage with master? Any issue?
Predicted wage = 2000
Issue: may omit factors correlated with mast → bias risk
What is a dummy variable in regression?
Variable coded 0 or 1 to indicate membership in a category
Example: mast = 1 if a person has a master’s degree, 0 otherwise
Does unbiasedness require high R²?
No. Unbiasedness relies on assumptions, not on fit
R² measures fit (Proportion of variation in y explained by the model)
How to read coefficients when the dependent variable is ln(y)?
Continuous x: +1 in x → ≈ 100·β% change in y
Dummy D (0/1): D=1 vs 0 → ≈ 100·δ% difference in y
Quick feel: β = 0.05 ⇒ ≈ 5% (exact 5.13%)
What is the base group in a regression with dummies?
The group where all dummy variables = 0
Example: wage = β₀ + β₁IQ + β₂south + β₃(IQ×south), the base group is non-southerners (south=0)
What does a p-value measure in regression output?
Probability of seeing an estimate as extreme as β^ if the true β = 0
Small p (<0.05): strong evidence against H₀ → effect significant
Large p: no strong evidence → cannot reject H₀ → not significant
p-value does not measure size or importance of effect, only evidence against H₀
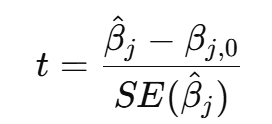
What is the formula for the t-test on a regression coefficient?
Usually test H₀: βⱼ = 0, so denominator is the standard error of βⱼ
How do you test whether a group of regressors has no effect?
Use the F-test
Null hypothesis: all coefficients in the group = 0
If F is large and p-value is small, reject the null
Why does multivariate regression provide a better ceteris paribus interpretation than univariate regression?
In univariate models, β₁ may capture both x’s effect and effects of omitted correlated variables
In multivariate models, including controls separates effects, so β₁ reflects only the effect of x
What is the population regression model in simple linear regression?
y = β₀ + β₁x + u
β₀ = intercept, β₁ = slope, u = error term
Interpret β₁ in:
wage = β₀ + β₁Female + u
while: β₁ = –5 and female is dummy (1=female, 0=male)
β₁ = –5 → women earn 5 less on average than men, cetris paribus
What happens if you rescale dependent variable (income € → thousands €)?
Coefficients and SE shrink by factor 1000
t-statistics unchanged
Two algebraic properties of OLS residuals
Residuals sum to 0: Σû=0
Residuals uncorrelated with regressors: Σx·û=0
Population Regression Function (PRFs) for
y = β₀ + β₁D + u
D=0: E[y|D=0]=β₀
D=1: E[y|D=1]=β₀+β₁
Interpret R²=0.25 in exam scores vs hours studied
25% of variation in scores explained by hours studied
Interpret β₁ in y = β₀ + β₁ln(x) + u
β₁/100 = change in y for 1% ↑ in x
Example: β₁=2 → 1% ↑ in x raises y by 0.02
State variance decomposition
TSS = ESS + RSS (total = explained + residual variation)
fe = β₀ + β₁Tech + u
β̂₁=0.025
se=0.010
=> Interpret & test
Tech firms’ forecast error 2.5% higher
t=2.5 → significant at 5%
R²=0.02. Interpret & relevance
Only 2% of y variation explained
Still fine for causal inference if regressors exogenous
Why log(y) can reduce heteroskedasticity?
Compresses scale of y
Stabilizes variance of errors
Compare log vs level wage regressions
log(wage)=β₀+β₁Education+u → β₁ ≈ % effect of education
wage=β₀+β₁Education+u → β₁ = absolute wage change per education year
Reading regression output
Variable significant if p<α (1%,5%,10%)
Significant coefficient → effect different from 0
Non-significant → cannot reject H₀
Why high R² may be useless
Spurious regression: x and y both trend but no causality
What is an exogenous variable?
A regressor uncorrelated with the error term (E[u|x]=0)
Ensures OLS is unbiased and consistent
Example: randomized treatment in an experiment
What is an endogenous variable?
A regressor correlated with the error term (E[u|x]≠0)
Causes OVB and biased OLS estimates
Sources: omitted variables, simultaneity, measurement error
Why can a high R² be useless?
R² only measures % of y’s variation explained by x
It does not prove unbiasedness or causality
Example: time-series data where GDP and global temperature both trend upward → regression shows high R² but relationship is spurious (driven by common trend, not causal link)
Give two endogeneity threats.
Omitted variable (e.g. ability with education)
Simultaneity (e.g. price & demand)
What are omitted variables?
Relevant factors affecting y but excluded from regression
If correlated with regressors → E[u|x]≠0 → OLS biased
Example: Ability omitted in wage–education regression biases education effect
What is the Population Regression Function (PRF)?