Supply and Demand in Oil Economics
1/132
There's no tags or description
Looks like no tags are added yet.
Name | Mastery | Learn | Test | Matching | Spaced |
|---|
No study sessions yet.
133 Terms
Supply
The amount of a material or immaterial thing available for sale.
Demand
The quantity that buyers are willing and able to buy at a particular price.
Equilibrium
The state where supply and demand balance each other, resulting in stable prices.
Demand Curve
A function that shows the quantity demanded at different prices.
Quantity Demanded
The quantity that buyers are willing and able to buy at a particular price.
Economic of Scale
Lowering costs when producing more goods.
Shifts in the Demand Curve
Left decreases and right increases demand.
Shifts in the Supply Curve
Left and up decreases in supply; right and down is an increase in supply.
Consumer Surplus
The difference between what consumers are willing to pay and what they actually pay.
Producer Surplus
The difference between what producers are willing to sell for and the actual price they receive.
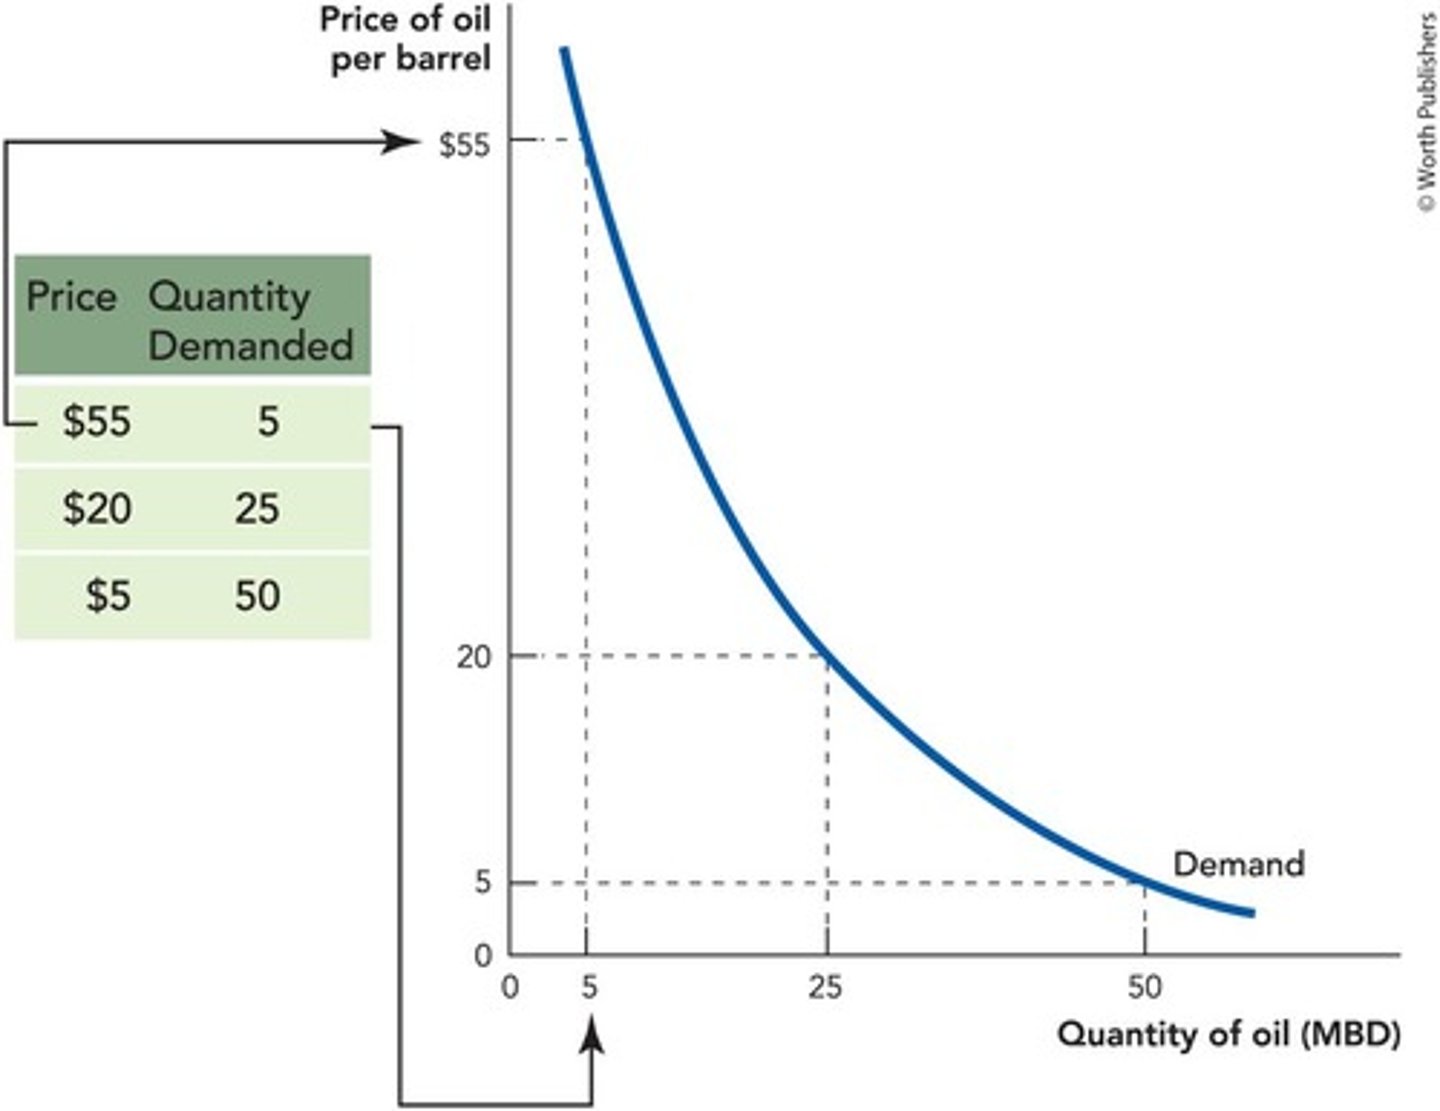
Quantity of Oil Demanded at Different Prices
If the price of oil was $55 per barrel, the quantity demanded would be 5 million barrels of oil per day.
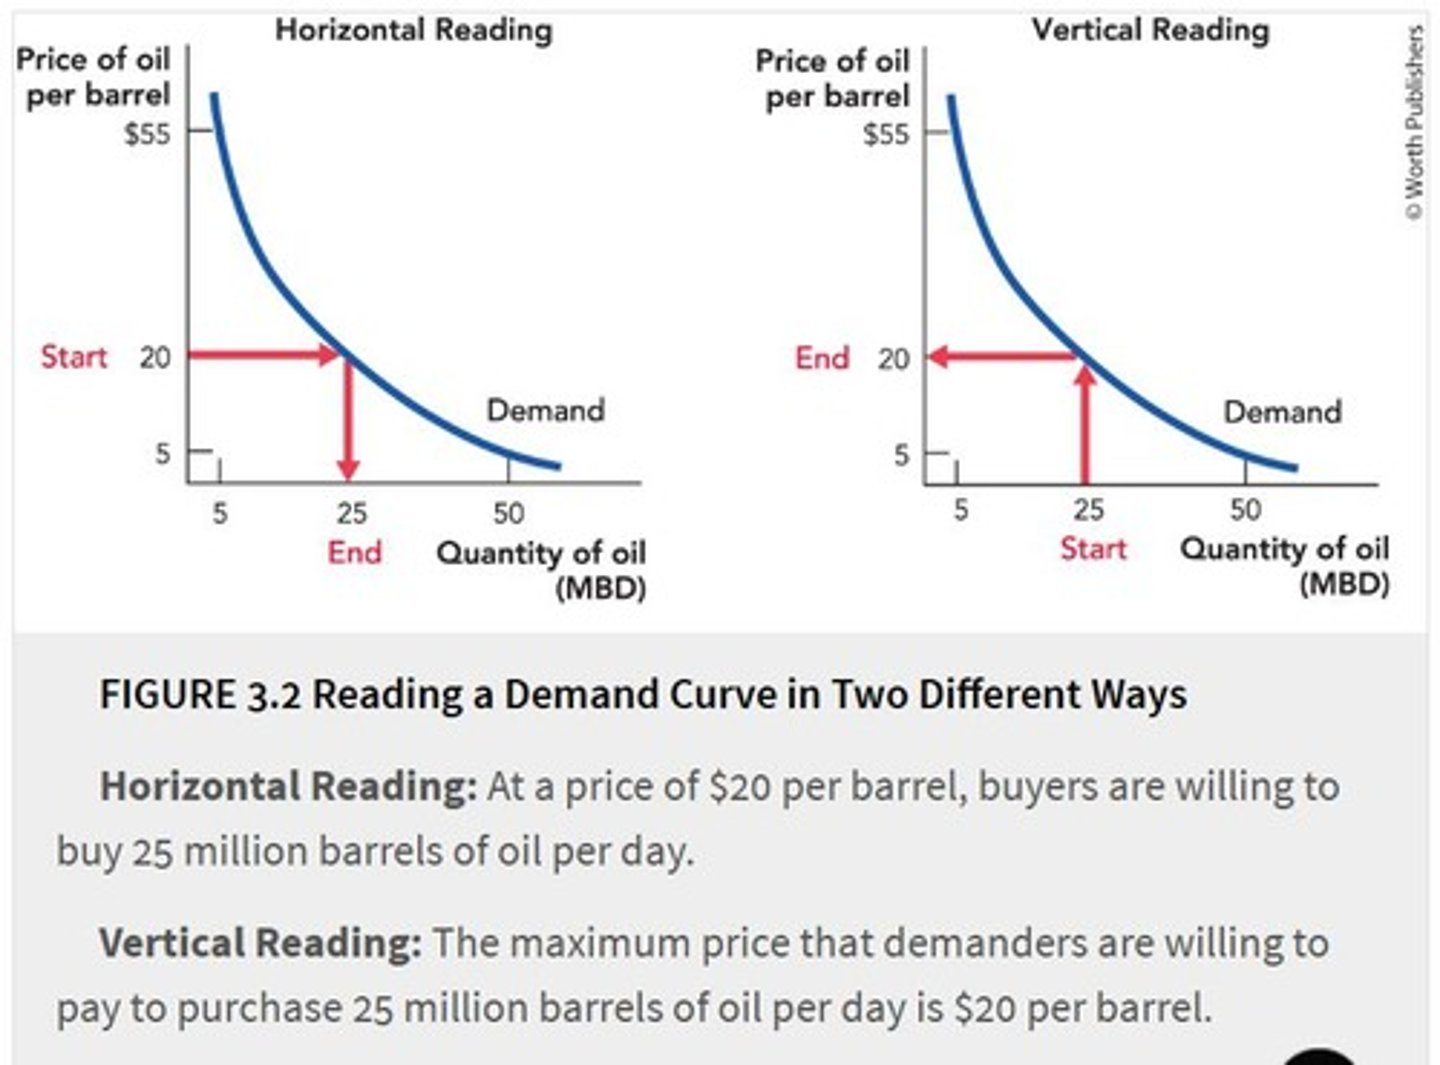
Horizontal Reading of Demand Curves
At a price of $20 per barrel, demanders are willing and able to buy 25 million barrels of oil per day.
Vertical Reading of Demand Curves
The maximum price that demanders are willing to pay for 25 million barrels of oil a day is $20 per barrel.
Negative Slope of Demand Curve
A greater quantity of oil is demanded when the price is low.
Barrel of Oil
Contains 42 gallons, with 19.5 gallons used for gasoline and 4 gallons for jet fuel.
Uses of Oil
Includes gasoline, jet fuel, heating, energy generation, lubricants, kerosene, asphalt, plastics, tires, and rubber products.
Substitutes for Oil
Natural gas, coal, and electricity are substitutes for oil in heating and energy generation.
Value of Oil
Oil is more valuable for producing gasoline and jet fuel than for heating or making rubber products.
High Value Uses of Oil
Raising the temperature in a house from 40 degrees to 65 degrees is more valuable than from 65 degrees to 70 degrees.
Vinyl Value
Vinyl has high value as wire wrapping because it is fire-retardant.
Demand Curve
A function that shows the quantity that demanders are willing and able to buy at different prices.
Law of Demand
The principle that the lower the price, the greater the quantity demanded.
Consumer Surplus
The difference between what a consumer is willing to pay and what they must pay (the price).
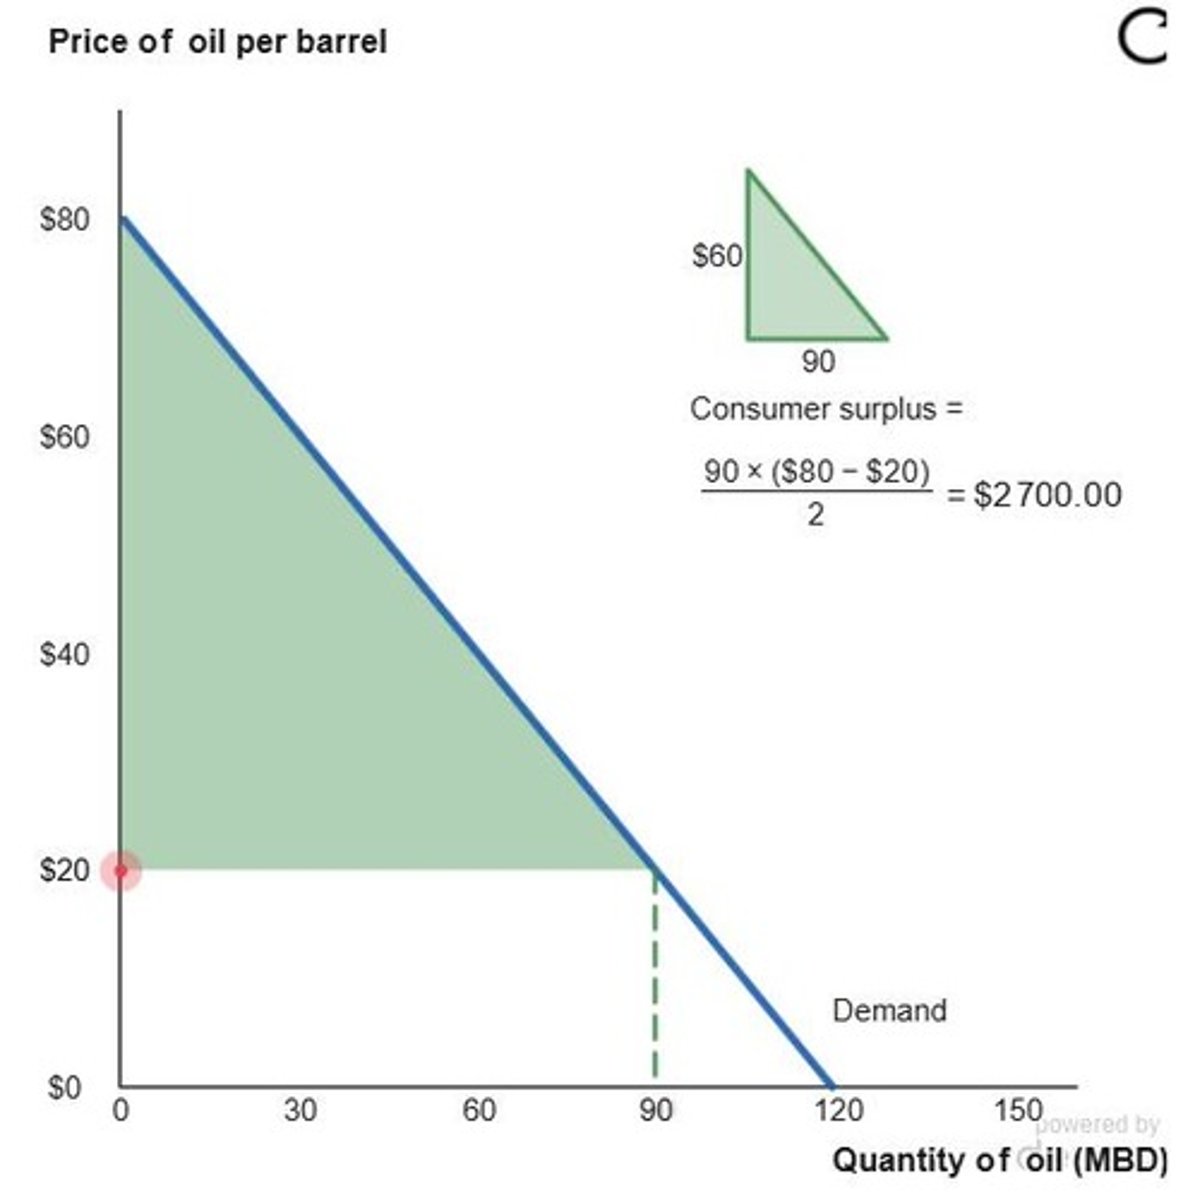
Total Consumer Surplus
The sum of consumer surplus for each consumer and for each unit, represented as the shaded area beneath the demand curve and above the price.
Consumer Surplus Calculation
For example, if a consumer is willing to pay $80 per barrel but the price is $20, the consumer surplus is $60 per barrel.
Consumer Surplus Triangle
The area of the triangle representing consumer surplus can be calculated using the formula for the area of a triangle.
Area of a triangle
is calculated by doing (Base x Height) divided by 2
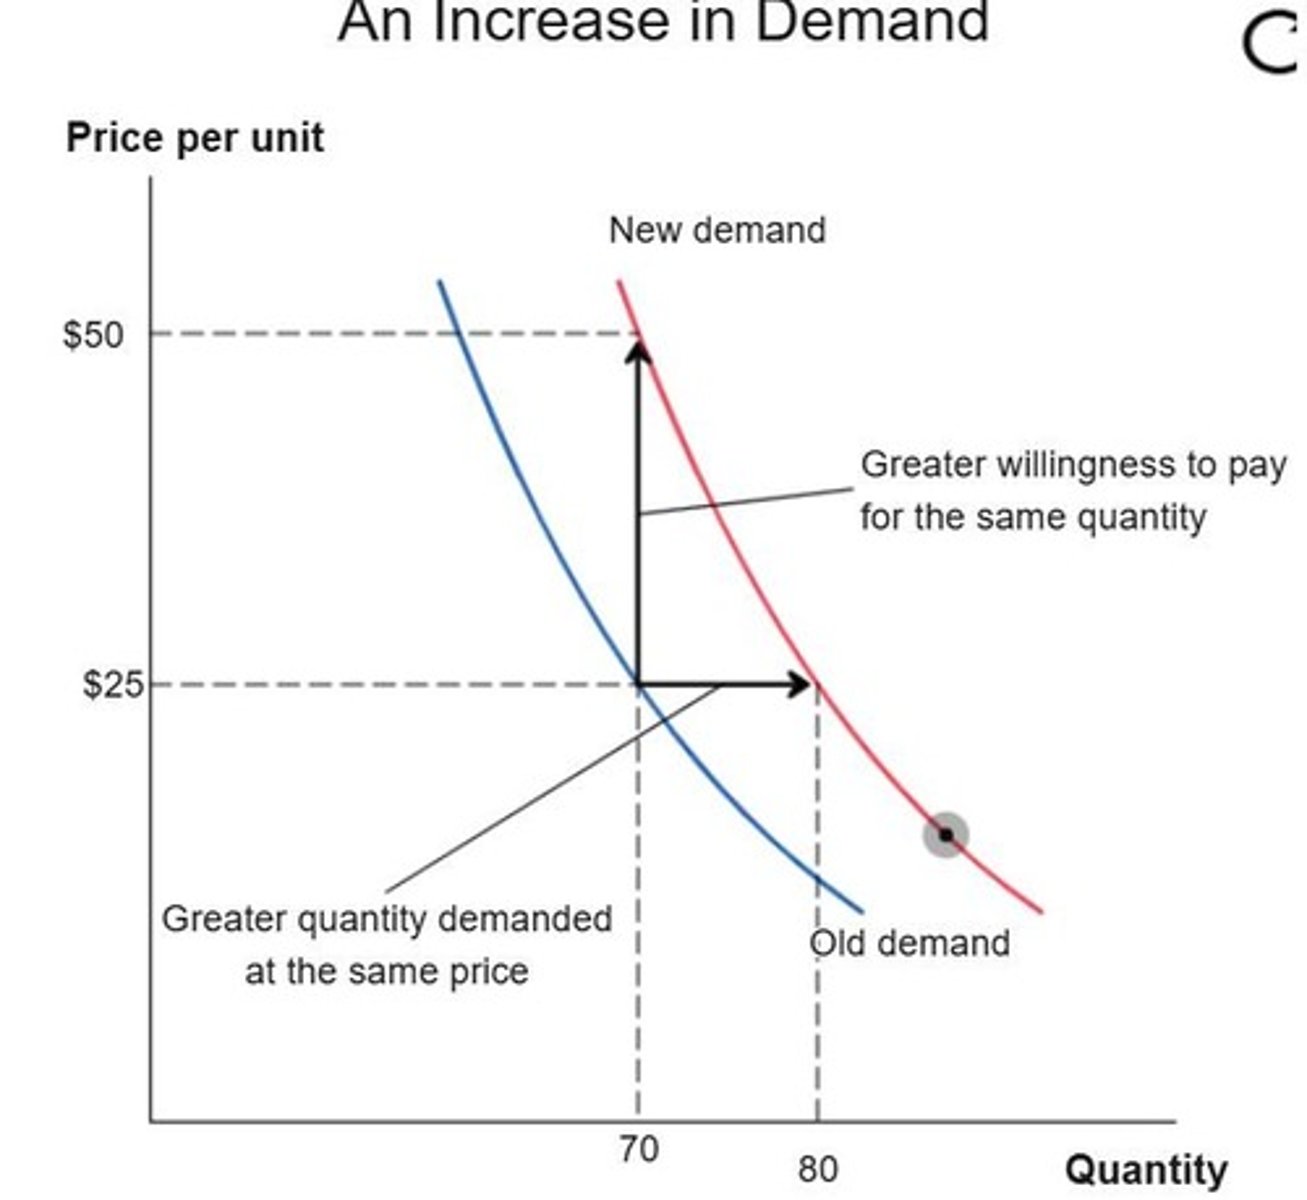
Demand Curve Shift
An increase in demand shifts the demand curve outward, up, and to the right, while a decrease shifts it inward, down, and to the left.
Normal Good
A good for which an increase in income increases the demand.
Inferior Good
A good for which an increase in income decreases the demand.
Demand Shifters
Factors that can shift the demand curve, including income, population, price of substitutes, price of complements, expectations, and tastes.
Oil Usage at High Prices
When the price of oil is high, consumers will choose to use oil only in its most valuable uses.
Oil Usage at Low Prices
As the price of oil falls, consumers will choose to also use oil in its less valued uses.
Example of Consumer Surplus
If Joanne is willing to pay $25 and the price of oil is $20 per barrel, then Joanne earns a consumer surplus of $5 per barrel.
Demand for Oil at $25
At a price of $25 per barrel, the world demand for oil is 70 million barrels per day.
Increased Demand Example
An increase in demand at a price of $25 can mean the quantity demanded increases to 80 million barrels per day.
Income Effect on Demand
When people get richer, they buy more stuff, increasing the demand for goods like oil.
Effect of Income on Car Purchases
In the United States, people buy bigger cars when their income increases, which increases the demand for oil.
Consumer Surplus Area Calculation
For a triangle with a base of 90 million barrels and a height of $60, consumer surplus equals $2,700 million.
Ramen Noodles as an Inferior Good
because an increase in income decreases the demand for them.
Elderly Population
The 65-year-old-and-older crowd makes up about 17% of the population in the United States today, projected to be 19.4% by 2030.
Substitutes
Two goods for which a decrease in the price of one leads to a decrease in demand for the other.
Natural Gas and Oil
Natural gas is a substitute for oil in some uses such as heating.
Effect of Substitute Price Decrease
When the price of natural gas goes down, the demand for oil decreases.
Price of Pepsi and Coca-Cola
A decrease in the price of Pepsi will decrease the demand for Coca-Cola.
Complements
Two goods for which a decrease in the price of one leads to an increase in the demand for the other.
Ground Beef and Hamburger Buns
Ground beef and hamburger buns are complements; if the price of beef goes down, the demand for hamburger buns increases.
Demand Curve Shift for Hamburger Buns
If the price of beef goes down, the demand curve for hamburger buns shifts up and to the right.
Supermarket Sales
A supermarket having a sale on ground beef will also want to stock up on hamburger buns.
Expectations
Expectations about future supply can influence current demand.
Emergency Stockpiles
Fear of future disruptions in oil supply encouraged businesses and governments to increase emergency stockpiles.
Weather Forecasts
When a big storm is predicted, many people rush to stores to stock up on storm supplies.
Demand Increase from Expectations
The expectation of a reduction in future oil supply increased the demand for oil today.
Market Anticipation
Entrepreneurs want to know how demographic changes will affect demand to anticipate new and expanded markets.
Price of Complements
Demand for a good increases when the price of a complementary good decreases.
Apple's App Strategy
Apple wants cheap apps to promote a competitive marketplace in iPhone apps.
Demand for Goods
More people lead to more demand for various goods.
Market Dynamics
Things get more interesting when some subpopulations increase more than others.
Oil Demand and Supply
The expectation of future oil supply disruptions can lead to increased current demand.
Hurricane Sandy
A hurricane that caused a spike in sales of flashlights and batteries in New Jersey.
inferior good
A good will decrease in demand because there is an increase in income
normal good
A good that experiences an increase in demand as consumer income rises.
Important demand shifters
income, population, price of substitute and complements, expectations, and tastes
income demand shift
When people get more income, they tend to buy more goods and services, increasing demand for certain products such as oil.
population demand shift
An increase in population leads to higher overall demand for goods and services, including oil, as more consumers enter the market.
Substitute
Two goods for which a decrease in the price of one leads to a decrease in demand for the other
complements
Two goods for which an increase in the price of one leads to an increase in demand for the other.
Expectations
Powerful factors that can affect demand and supply as much as actual events.
Tastes
Preferences that are always changing and can influence market demand.
ImpossibleTM Burger
A plant-based meat substitute that gained popularity due to changing tastes.
Environmental movement
A movement that raised awareness about global climate change and influenced demand for hybrid cars.
Supply curve for oil
A function showing the quantity of oil that suppliers would be willing and able to sell at different prices.
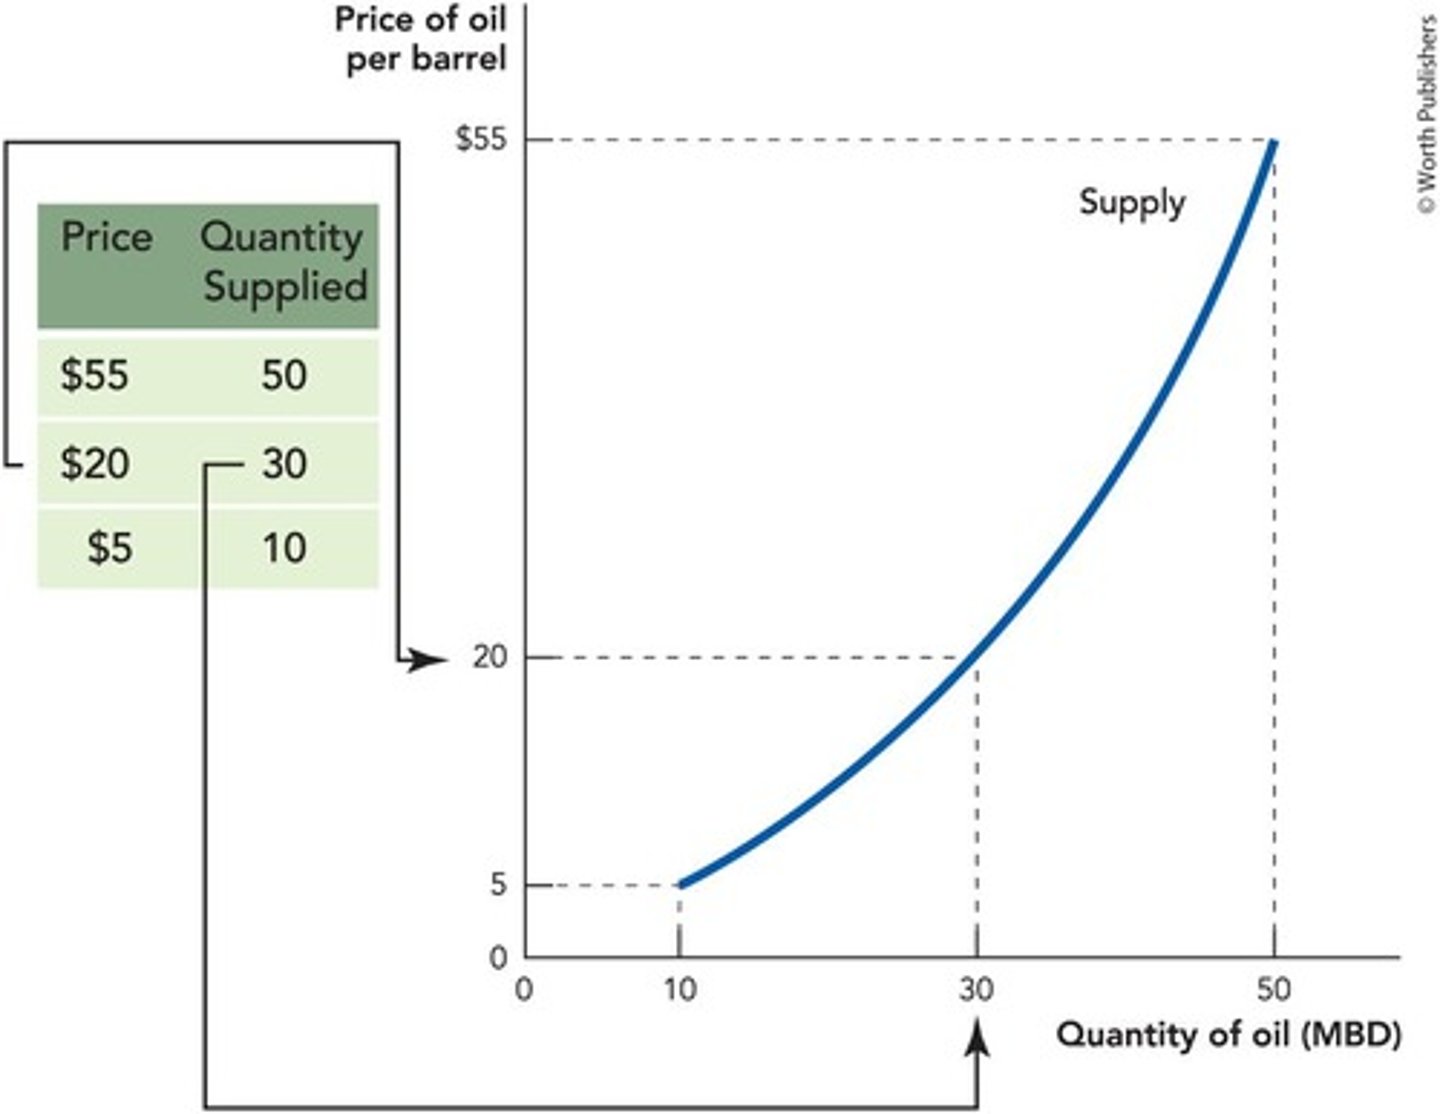
Quantity supplied
A function that shows the quantity supplied at different prices.
Price of oil
At $20 per barrel, the quantity supplied is 30 million barrels of oil per day.
Reading supply curves
Supply curves can be read horizontally to show quantity supplied or vertically to show minimum price for quantity.
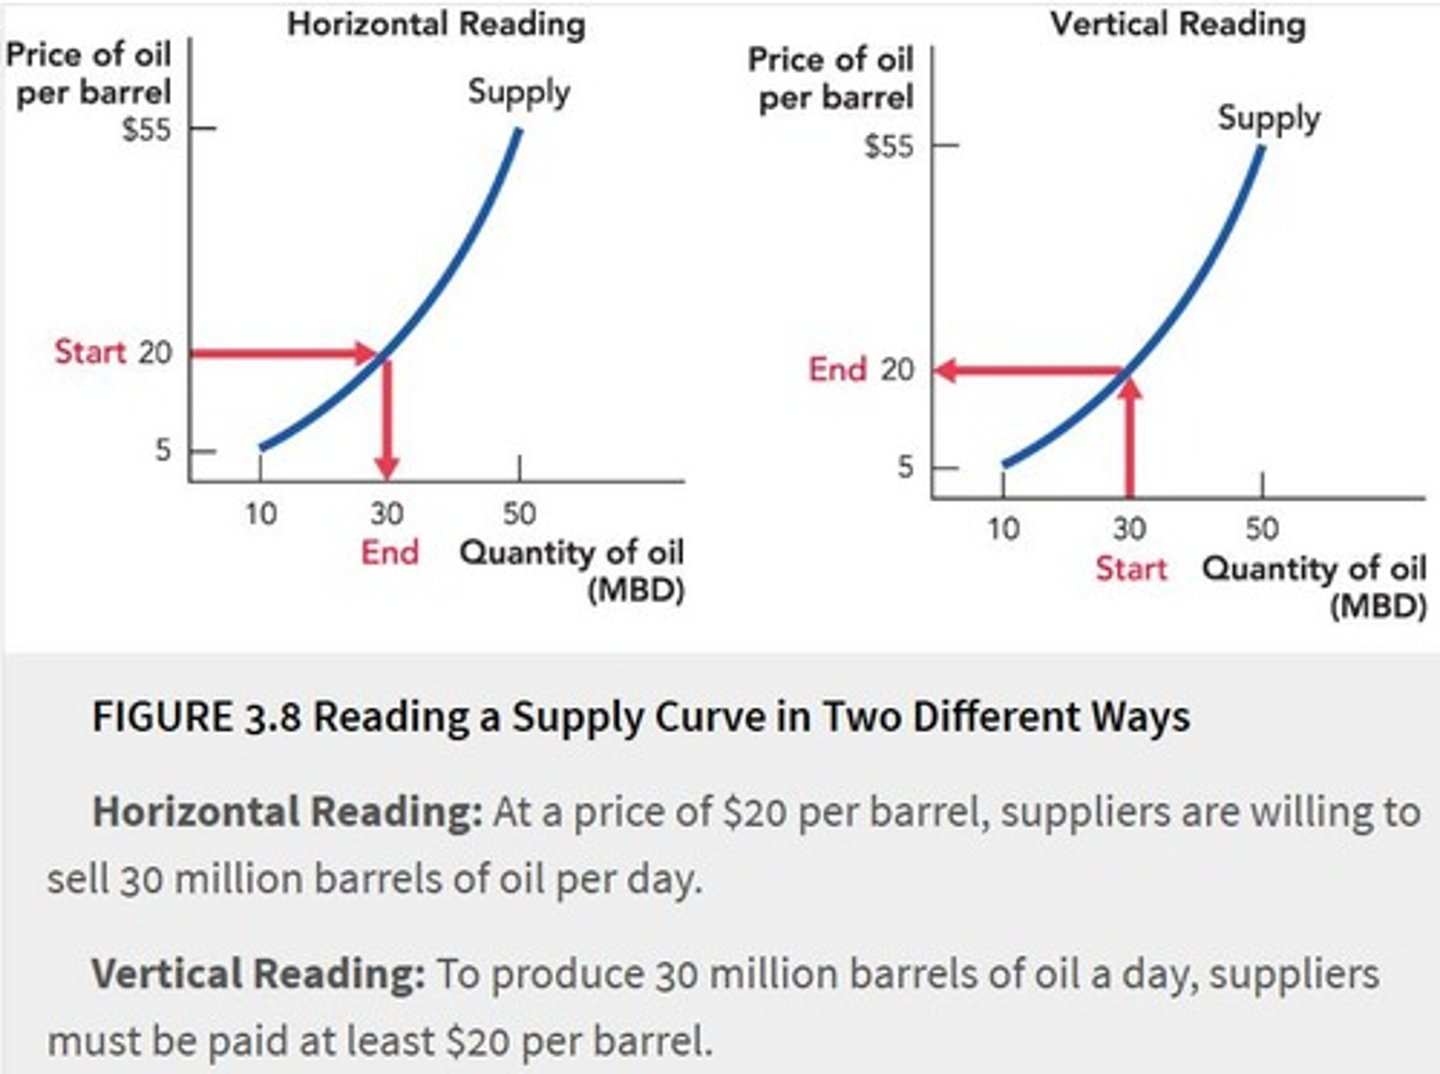
Horizontal reading for supply curve
at a price of $20 per barrel suppliers are willing to sell 30 million barrels of oil per day.
Vertical reading for demand curve
produce 30 million barrels of oil a day, suppliers must be paid at least $20 per barrel.
Spindletop
The site of a historic oil gusher in Texas that dramatically changed oil production in the U.S.
Oil price drop
The price of oil fell from $2 per barrel to just 3 cents per barrel after the Spindletop gusher.
Oil well
A structure used for extracting oil, exemplified by the Spindletop incident.
Oil spill
An incident during the Spindletop drilling where a million barrels of oil were spilled.
More profitable
to extract oil using more exotic technologies or deeper wells in more inhospitable parts of the world
Economic meaning of supply curve
Shows the maximum quantity that suppliers will supply at different prices or the minimum price at which suppliers will sell different quantities.
Supply curve
A function that shows the quantity that suppliers would be willing and able to sell at different prices.
Law of supply
The higher the price, the greater the quantity supplied. (more methods can be used to make profit)
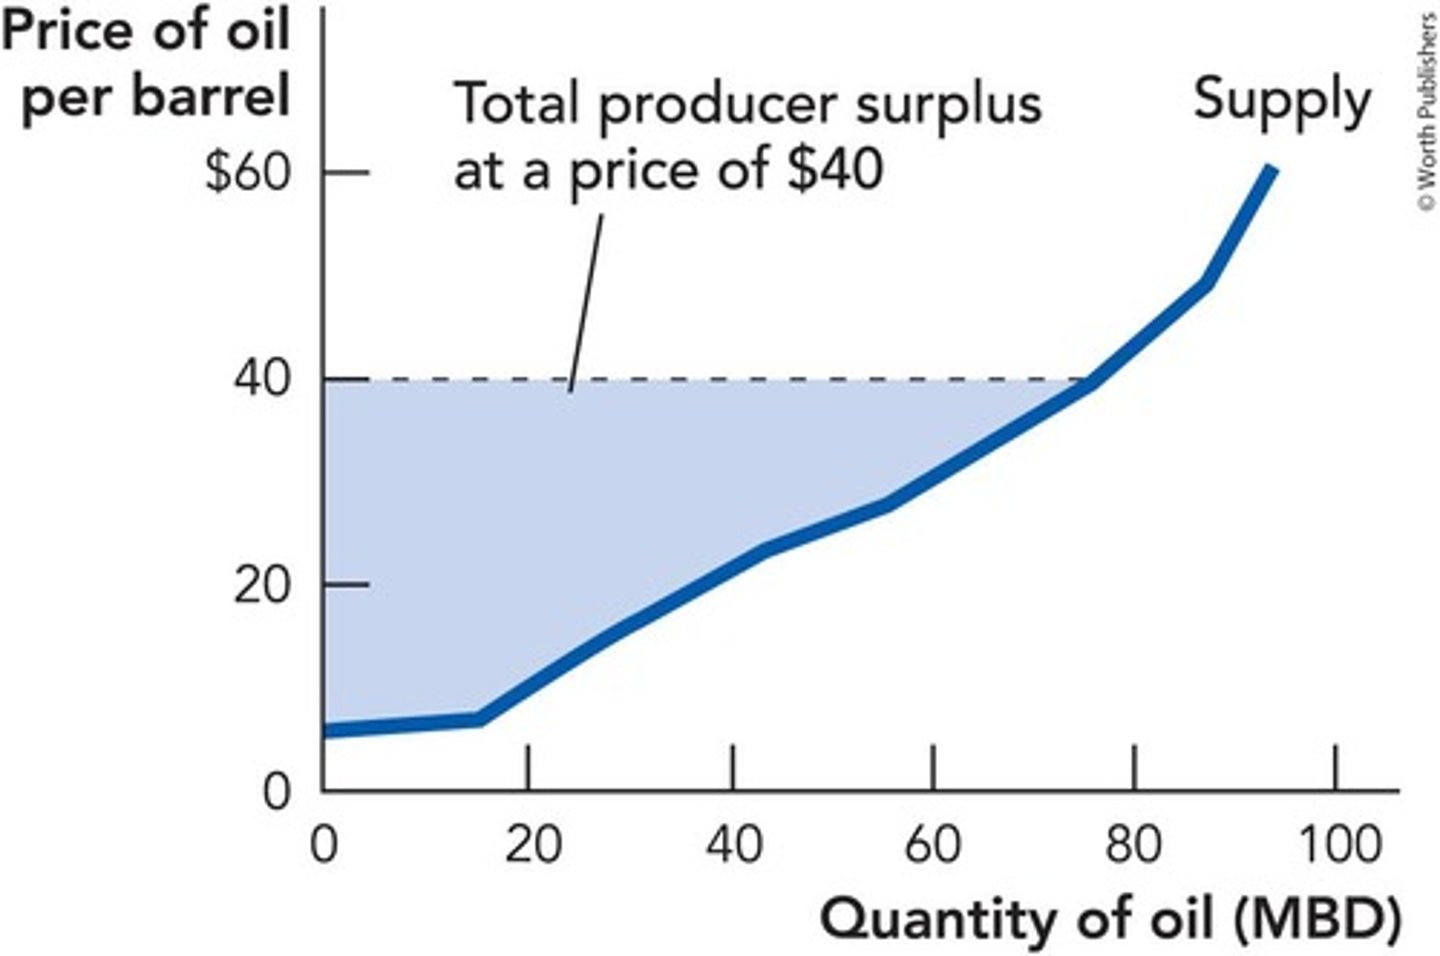
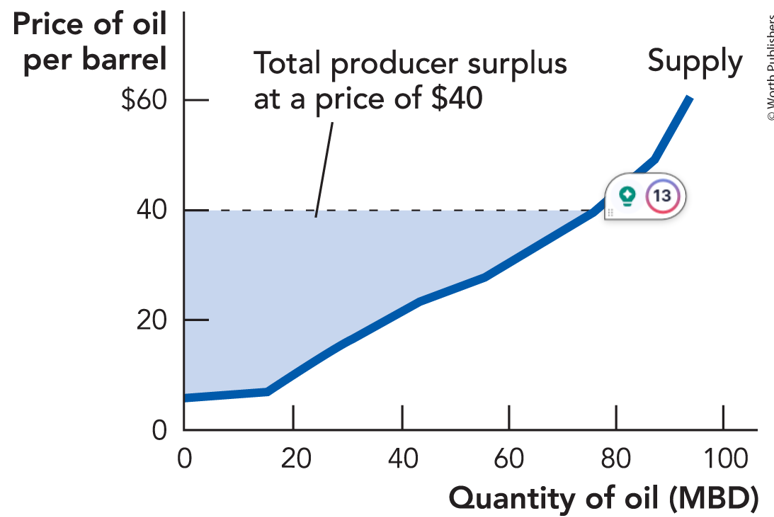
Producer surplus
The producer's gain from exchange, or the difference between the market price and the minimum price at which a producer would be willing to sell a particular quantity.
Producer surplus example in Saudi Arabia
If the price of oil is $40 per barrel and Saudi Arabia can produce oil at $2 per barrel, then Saudi Arabia earns a producer surplus of $38 per barrel.
Total producer surplus
An amount measured by the area above the supply curve and below the price up to the quantity traded.
Consumer surplus
Measures the consumer's benefit from trade.
Total gains from trade
The sum of consumer surplus and producer surplus.
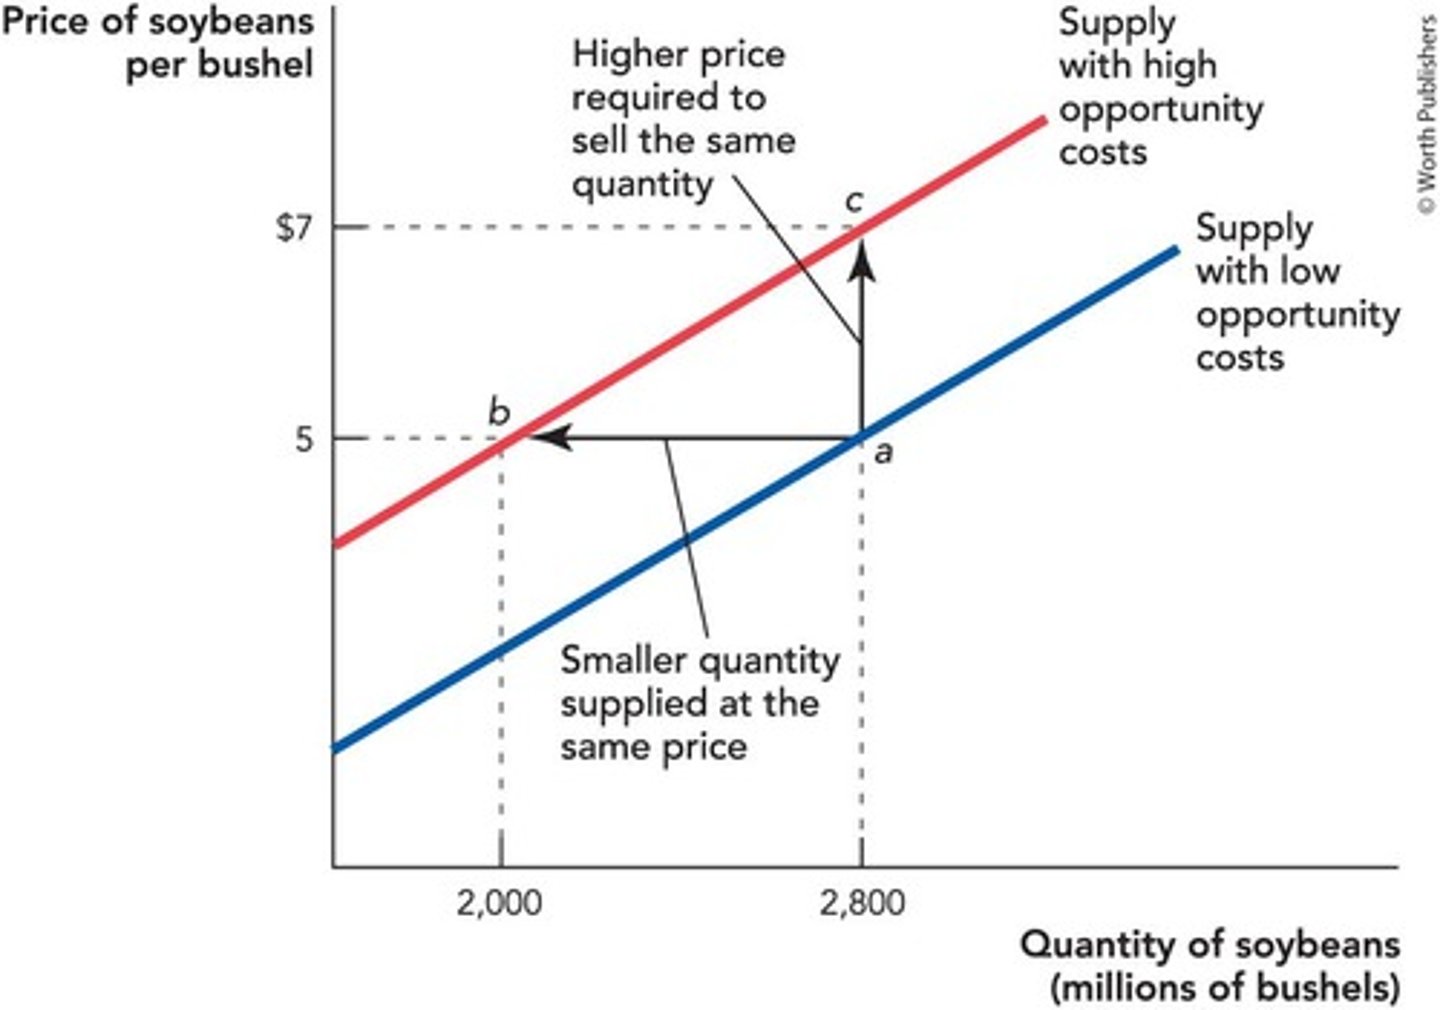
Opportunity Cost
When the opportunity cost of something increases, it is more likely to become the second option when making a decision.
Supply Curve
The supply curve tells us how much suppliers are willing to sell at a particular price.
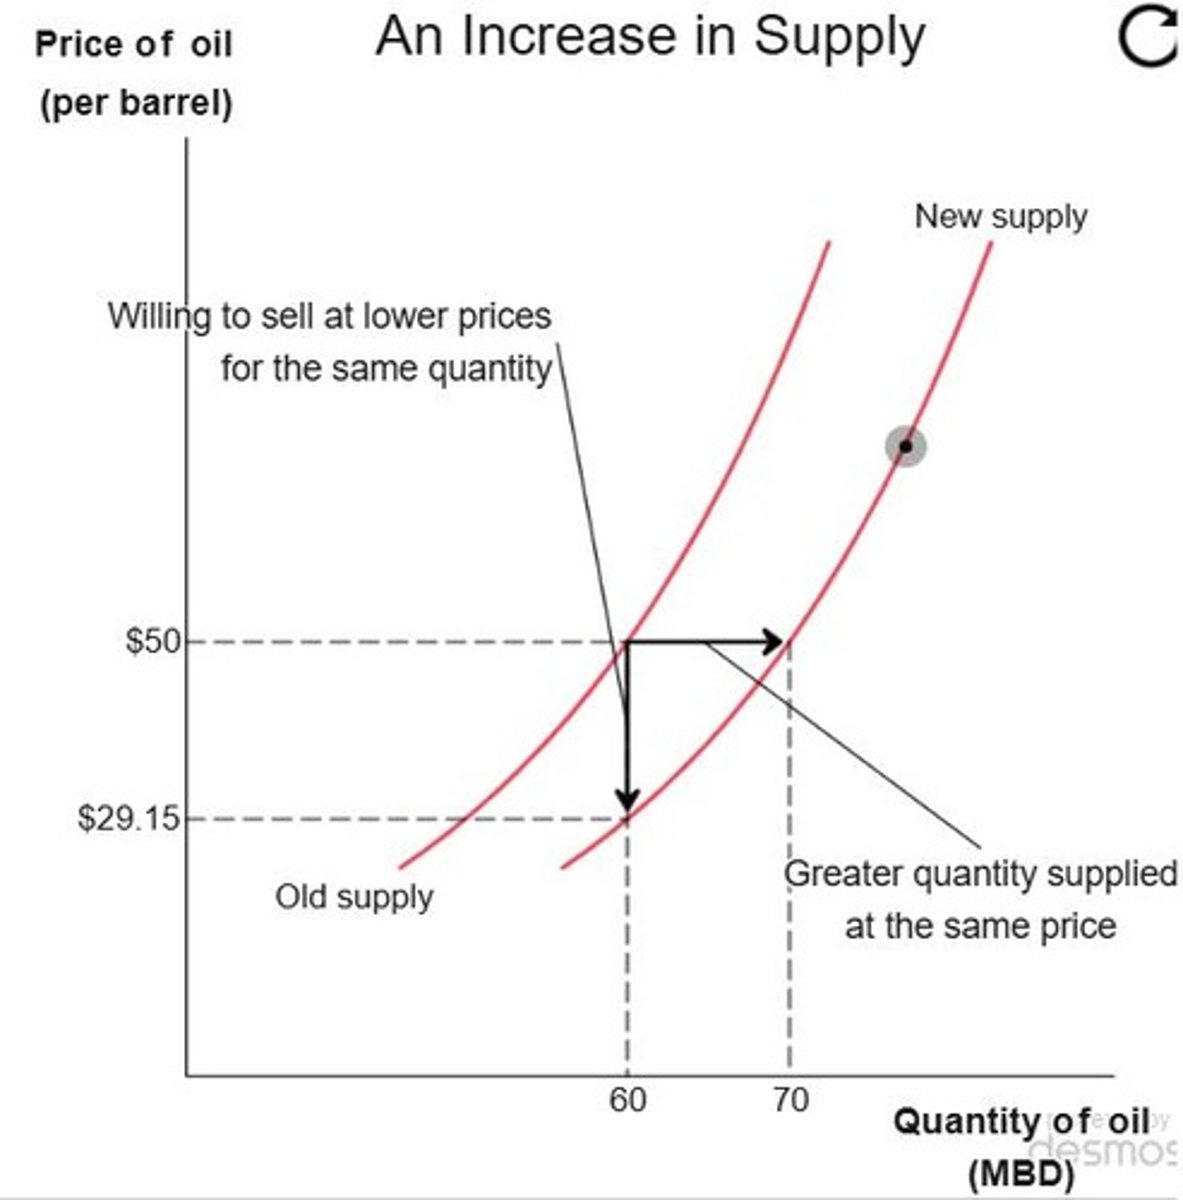
Decrease in Costs
A decrease in costs increases supply, shifting the supply curve down and to the right.
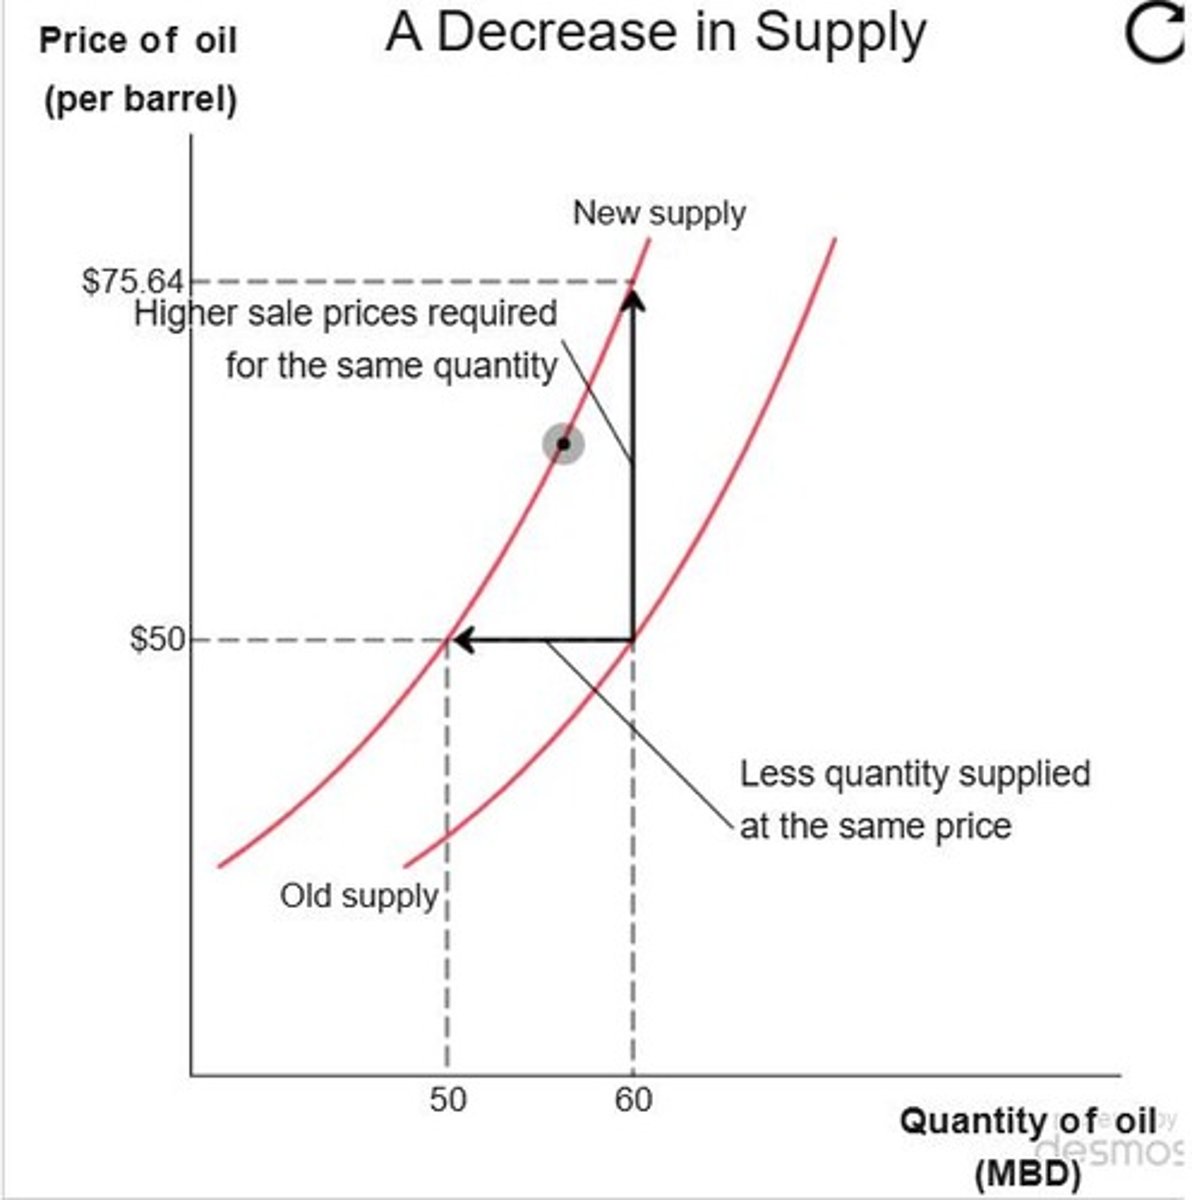
Increase in Costs
An increase in costs decreases supply, shifting the supply curve up and to the left.
Important supply shifters
Technological innovations and changes in the price of inputs, taxes and subsidies, expectations, entry or exit of producers, changes in opportunity costs
Technological Innovations
Improvements in technology can reduce costs, thus increasing supply.
Price of Inputs
A reduction in input prices reduces costs and thus has a similar effect on supply.
Taxes and Subsidies
A tax on output is the same as an increase in costs for firms.
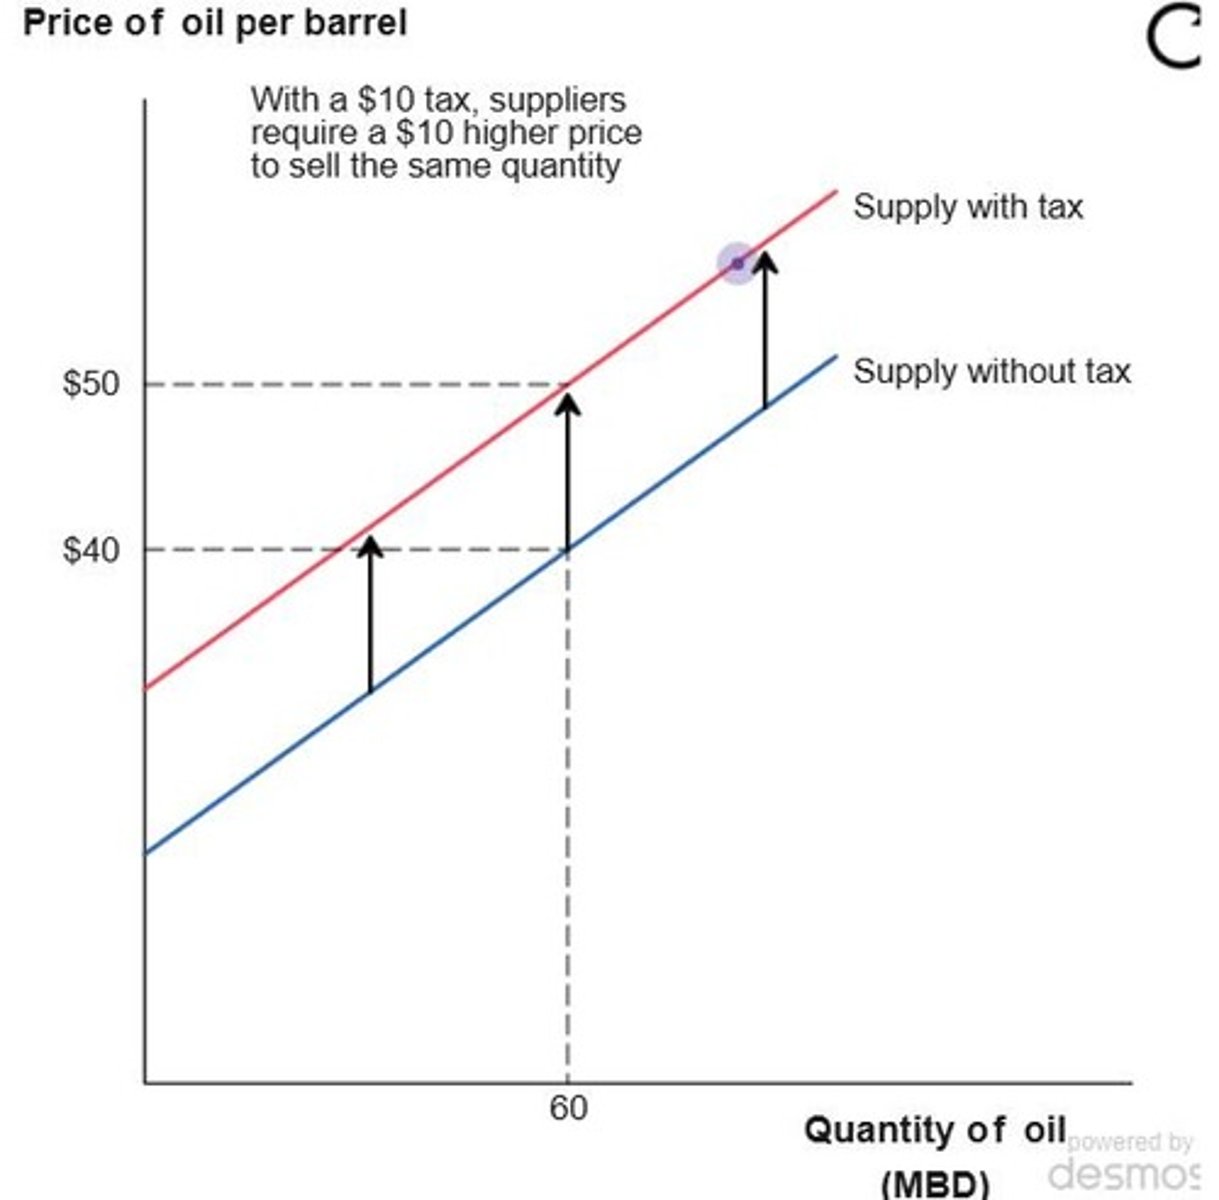
$10 Oil Tax
If the government taxes oil producers $10 per barrel, it is the same to producers as an increase in their costs of production of $10 per barrel.
Wages of Oil Rig Workers
A fall in the wages of oil rig workers will reduce the cost of producing oil, shifting the supply curve down and to the right.