Analytical Chemistry
0.0(0)
Card Sorting
1/100
Earn XP
Description and Tags
Last updated 5:49 AM on 3/24/23
Name | Mastery | Learn | Test | Matching | Spaced | Call with Kai |
|---|
No analytics yet
Send a link to your students to track their progress
101 Terms
1
New cards
Problem definition (formulate the question)
determine an appropriate question that can be addressed by chemical analysis and setting appropriate specifications (agreed on features of an acceptable answer, including tolerances).
2
New cards
Selection of analytical method
selection of a suitable wet chemical or instrumental \n technique that could be applied to an obtainable sample to meet the specifications, given the analytical requirements (what the analysis must do).
3
New cards
Sampling and sample handling
\n involving the execution of a sampling plan to obtain an \n uncontaminated representative sample of appropriate size for analysis followed by good sample handling practices and the preparation of the sample for analysis (ample preparation)
4
New cards
Method Validation
making sure the method returns results that meet the specifications and otherwise can be trusted.
5
New cards
Data collection and interpretation
carrying out the validated method to obtain data (signal) \n which you convert into results (composition) which you interpret in a way that addresses the problem.
6
New cards
Reporting
report your results, being sure to draw warranted conclusions), which includes communicating what you learned accurately and fairly, without going beyond the mandate of your data, and in a way that is clear to your target audience.
7
New cards
Destructive analyses/techniques
are chemical analyses which consume the sample so that it \n cannot be recovered unchanged. Examples from general chemistry are acid-base titrations and combustion analyses, both of which chemically transform the sample.
8
New cards
Nondestructive techniques
are chemical analyses that do not consume the sample. A simple example of a nondestructive analysis is NMR spectroscopy. An NMR sample can typically be recovered by evaporation of the NMR solvent (for solid or nonvolatile liquid samples) or distillation of the sample (for liquid samples)
9
New cards
Trace analyte
an analyte present in very small amounts in a sample
10
New cards
Sensitivity
how responsive a method is to the analyte – and consequently able to be used to detect and quantify small levels of analyte
11
New cards
Detection threshold (limit of detection)
the lowest analyte level that can be detected by an analytical method
12
New cards
Quantitation threshold (limit of quantitation)
the lowest analyte level that is large enough to be \n quantified, not just detected – i.e. where there is enough analyte present to measure it accurately enough to tell how much is there.
13
New cards
Dynamic range
the range of concentrations over which an analytical method can be used. Outside the dynamic range the method either can’t be used to quantify analyte, either because there is no enough analyte present of because there is so much that the method no longer responds to analyte
14
New cards
Interferent
a substance present in a sample that interferes with analysis of the analyte (for example, since proteins bind small molecules they often interfere with their analysis.
15
New cards
Selectivity
the ability of an analysis to distinguish an analyte in the presence of other substances.
16
New cards
Robustness
the ability of an analysis to work well with a wide range of samples, as opposed to analyses that only work well for particular sample conditions (pH, temperature, etc., although it can also refer to the susceptibility of an analysis to interferents).
17
New cards
Sampling plan
a plan for collecting a (typically representative) sample and which will enable you to meet the analytical requirements.
18
New cards
Random sampling
divide the sample up into equal parts using a 2D or \n 3D grid and take samples from different regions randomly. This method is best used with samples that are expected to be spatially homogenous.
19
New cards
Systematic sampling
sampling according to a fixed system or plan.
20
New cards
Judgmental sampling (which may also be systematic or random)
Sampling according to a plan that is informed by the nature of the sample.
21
New cards
Stratified sampling
a form of judgmental sampling in which samples are divided into populations, each of which is sampled separately.
22
New cards
Grab sampling
taking a sample from the lot for analysis; this is by far the most common type, so much so that when you hear the word sampling without qualification you may assume it is grab sampling
23
New cards
In-situ sampling (in-situ monitoring)
using a sensor to monitor a sample without actually taking any.
24
New cards
formula of sampling
σanalysis2 = σsample2 + σmethod2 \n
25
New cards
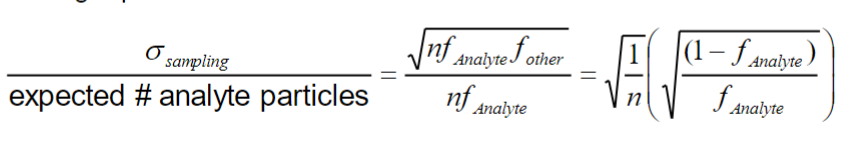
σsampling
the standard deviation associated with sampling, a measure of the size of the \n random error associated with sampling
26
New cards
n (sampling)
the number of particles sampled
27
New cards
f analyte
the fraction of analyte particles in the sample
28
New cards
f other
the faction of other types of particles = 1 - f analyte
29
New cards
Relative sampling error (RSE)
\
30
New cards
K (sub) s
sampling constant = (sample mass)(%RSE)^2
31
New cards
Sample handling
how a sample is treated, including during its collection and analysis.
32
New cards
Sample contamination
the contamination of samples with impurities \n o During collection (by the containers and reagents used) \n o Improper storage (by containers, moisture, the atmosphere) \n o Due to degradation
33
New cards
Sample degradation
the degradation of samples, over time and/or due to exposure to \n excessive heat, moisture, air or other factors. Degradation can reduce the amount of \n analyte present or producing interferents.
34
New cards
Sample storage
the storage of samples under conditions of time, temperature, moisture, \n etc. to ensure they do not degrade or become contaminated
35
New cards
Lot
this term is sometimes used to describe the \n material to be sampled.
36
New cards
Bulk sample
the combination of all the samples \n that (ideally) adequately represent the material
37
New cards
Homogenized
rendered more uniform at a \n smaller size scale level, often by grinding or \n dissolution.
38
New cards
Lab sample
the homogenized sample from \n which all the samples tested are taken
39
New cards
Aliquot
a portion of the bulk or lab sample \n taken for analysis. The analyses of these samples \n are called replicates.
40
New cards
Sample pretreatment
things done to a sample to render it susceptible to analysis by an \n analytical method.
41
New cards
Preconcentration
increasing the concentration of \n an analyte to make it easier to \n detect or quantify
42
New cards
Extraction
Separating the analyte from \n potential interferents by \n partitioning it into a separate \n phase, commonly using liquid- \n liquid or solid phase extraction.
43
New cards
Derivatization
chemically reacting the analyte \n to make a new compound that is \n easier to analyze.
44
New cards
Standard operating procedures
a set of written and validated procedures that analysts can \n follow to carry out that method reliably.
45
New cards
Signal
the output of an analytical method, although the term signal is typically only used for \n instrument signals. Nevertheless, the signal is whatever the analytical method returns as an output \n – electrical current, voltage, mass, volume, etc.
46
New cards
Standards (sometimes called reference materials or, less commonly, controls)
a set of materials containing the analyte that can be used to determine how a method responds to analyte \n and/or demonstrate that it works.
47
New cards
Calibration
the process of testing a method to determine how the signal-generated depends on \n the property you want to measure (such the analyte’s concentration or mass)
48
New cards
Calibration curve (signal-response curve, calibration relationship
the relationship between \n analytical signal and analyte levels that is determined using standards. When the relationship is \n linear it is defined by a trendline. \n
49
New cards
Validated
validation is the process of showing that a method meets the analytical requirements – \n i.e. works. This is done by testing the method to demonstrate that it can be used reliably for its \n intended purpose.
50
New cards
Blanks
samples prepared like normal samples and standards but lacking the analyte. The signal \n they produce is called a blank signal and should be subtracted from the observed signals to \n give a corrected signal. The corrected signal is used in the analysis.
51
New cards
Replicates
measurements carried out on the same or different aliquots in order to determine the reliability (precision) of an analysis.
52
New cards
Quality assurance
procedures used to help assure that a method is reliably meeting the analytical requirements. It can involve things like
53
New cards
Direct \n calibration
Determine the calibration (signal-response) curve \n and then using it to determine the amount of analyte \n present in the sample.
54
New cards
Internal \n Standards
An internal standard that behaves chemically similar \n or identical to the analyte is added and the analytical \n method. The amount of analyte is determined from \n the relative size of its signal relative to that of the \n known-concentration standard.
55
New cards
Standard \n Addition
Standards are added to the sample and the signal is \n measured as the amount of standard increases. The \n resulting relationship (usually linear) is extrapolated \n backwards to see how much analyte must be \n “removed” from the original sample to give zero \n signal.
56
New cards
Matrix effects
occur when \n the sample matrix in which the \n analyte is \n embedded \n affects the \n signal- \n response \n curve
57
New cards
detection sample
3s(sample)/m
58
New cards
quantitation limit
10s(sample)/m
59
New cards
accuracy
how close a measurement is to the true or accepted value
60
New cards
precision
how close measurements of the same item are to each other
61
New cards
TC
to contain
62
New cards
TD
to deliver
63
New cards
Volumetric or transfer pipette
can only deliver one fixed \n volume. It has one fixed mark and will deliver the specified \n volume when filled to the mark and emptied.
64
New cards
Graduated or Mohr pipette
can deliver variable volumes by \n filling the pipette to one mark and emptying it to another.
65
New cards
Significant figures
digits that are known and thus can be specified with confidence.
66
New cards
Real rule
quantities should be written out to the same number of decimal places as the \n magnitude of the uncertainty
67
New cards
For addition and subtraction (sig fig rule)
the result has the same number of decimal places as the \n quantity with the fewest.
68
New cards
For Multiplication & division (sig fig rule)
the result has the same # as the factor with the fewest
69
New cards
For logarithms and powers of ten (sig fig rule)
For logarithms, the significant \n figures are in the mantissa while the characteristic just specifies the \n power of 10.
70
New cards
Corollary (sig fig rule)
The number of significant figures in an antilogarithm is \n the same number as the number of digits in the logarithm’s \n mantissa.
71
New cards
Propagation of error
the process of calculating the error in a calculated quantity from the \n error in the numbers used
72
New cards
Absolute error/absolute uncertainty, e
the absolute value of the uncertainty.
73
New cards
Relative error/relative uncertainty
the calculated uncertainty divided by the \n value of the quantity
74
New cards
propagation of error in addition or subtraction
e=\[e(1)^2+e(2)^2+e(3)^2+...\]^(1/2)
75
New cards
propagation of error in multiplication or division
%e=\[%e(1)^2+%e(2)^2+%e(3)^2+...\]^(1/2)
76
New cards
Sample mean or estimated mean
𝑥̅ , the mean calculated from a finite number of data points
77
New cards
Mean, population mean, or true mean
μ, the mean that would be obtained from the entire \n population or lot under study – or an infinite number of data points were used.
78
New cards
Estimated standard deviation (esd) or sample standard deviation
sx, the standard \n deviation calculated from a finite number of data points.
79
New cards
Standard deviation or population standard deviation
σ, the standard deviation that would \n be obtained if an infinite number of data points were used.
80
New cards
Confidence interval
a range of values in which we expect the true mean will fall to a specified \n degree of confidence (percentage chance)
81
New cards
Student’s t
the number of standard deviations about the mean of \n that encompasses a given percentage of the Student’s t distribution.
82
New cards
Level of confidence (% level of confidence)
the confidence one wants to have that the \n mean actually falls within Student’s t estimated standard deviations of the sample mean.
83
New cards
Alpha-value, α-value
the chance one is willing to accept that the mean falls outside \n Student’s t standard deviations of the sample mean.
84
New cards
Confidence \n intervals
Hypothesis: Does your data agree with a known value?
How: Calculate the confidence interval for the desired degree of confidence and see if the known value falls within it. If so, you the data is consistent with the known mean.
requires: A data set and a known value.
How: Calculate the confidence interval for the desired degree of confidence and see if the known value falls within it. If so, you the data is consistent with the known mean.
requires: A data set and a known value.
85
New cards
t-test for comparison of means
Hypothesis: Do two data sets (methods, etc.) give the same \\n mean?
How: Calculate a t-value (called tcalc or tstat) using the t-test for comparison of means equations and compare it to the appropriate value of Student’s t (one-tailed or two-tailed). If tcalc > tcrit for the calculated DoF the difference is significant
requires: Any two data sets
How: Calculate a t-value (called tcalc or tstat) using the t-test for comparison of means equations and compare it to the appropriate value of Student’s t (one-tailed or two-tailed). If tcalc > tcrit for the calculated DoF the difference is significant
requires: Any two data sets
86
New cards
paired t-test
hypothesis: Do different methods give the same results for the same set of samples?
How: Calculate a critical t-value (tcalc a.k.a. or tstat) using the paired t-test equations and compare it to the appropriate value of Student’s t (one-tailed or two-tailed). \n If tcalc > tcrit for n - 1 DoF the difference is significant
Requires: Paired data (data from the two methods on the exact same set of samples).
87
New cards
F tests
compare two methods’ precisions to see whether they are significantly different at the \n indicated confidence level
88
New cards
Q-test and G-test
may be used to discard one and only one outlier from a set of data
89
New cards
Instrumental analysis
the use of optical, mechanical, electrical, and other signal-generating tools \n to learn information about an analyte. Instrumental methods are distinguished from classical wet \n chemical methods like gravimetric analysis (weighing) and volumetric analysis (titrations)
90
New cards
instrumental analysis examples
UV-vis \n spectroscopy/spectrophotometry \n IR spectroscopy \n NMR spectroscopy \n Mass spectrometry \n Gas chromatography
91
New cards
Mass spectrometry
use electric (and sometimes magnetic) fields to measure the masses \n of ions. Examples are classified by \n o ion source (electron impact, chemical ionization, electrospray, etc.) \n o type of mass analyzer (i.e. ion separator, electrostatic sector, magnetic sector, \n quadrupole, time of flight, ion trap)
92
New cards
Analytical separations
separate mixtures and analyze the individual mixture components \n using spectroscopic, mass spectrometric, and other methods. Examples include gas and \n liquid chromatography, electrophoresis, and field flow fractionation.
93
New cards
Electrochemical methods (later in the course)
use an electric current and/or potential. \n Examples include potentiometry, coulometry, electrogravimetric analysis, \n amperometry, and voltammetry.
94
New cards
Scattering-based methods
use the scattering of light. Examples include turbidemetry \n (quantifying an analyte by measuring light attenuation by scattering), nephelometry \n (quantifying analyte by the intensity of the light it scatters), and particle size analysis methods \n based on X-ray and visible light scattering
95
New cards
Microscopy
spatially-image materials using light absorption, scattering, or emission \n (conventional light and fluorescence microscopy), tendency towards ionization (electron \n microscopy), surface conductivity (STM), or surface roughness (AFM)
96
New cards
Hyphenated methods
employ more than one type of method; the most common involve \n analytical separations (GC or LC) and mass spectrometry (MS), Gas chromatography- \n mass spectrometry (GC-MS) and liquid chromatography-mass spectrometry (LC-MS).
97
New cards
transmission
proton passes through
98
New cards
reflection
the photon appears to reflect or bounce off, for example, due to electron excitation at a metal surface (for mirrors) or the laws of optics (all surfaces)
99
New cards
Absorption
the photon is taken up or absorbed by atoms/molecules in the substances
100
New cards
absorption followed by emission (luminescence)
the photon is absorbed, causing another proton to be emitted at a lower energy