4.2.2.E - Circular Flow of Income & Multiplier
1/24
There's no tags or description
Looks like no tags are added yet.
Name | Mastery | Learn | Test | Matching | Spaced |
|---|
No study sessions yet.
25 Terms
National Income/Output/Product
The flow of new output produced by the economy in a given time period
Measures of National Income
Income, Expenditure, Output
National Wealth
The stock of all goods that exist at a point in time that have value in the economy
National Capital Stock
The stock of capital goods (e.g. machinery) that has accumulated over time and is measured at a point in time
Nominal Income
Total amount of money received in a given time period
Nominal National Income =
Real National Income x Average Price Level
Real Income
Total amount of money received in a given time period, AND ADJUSTED FOR INFLATION
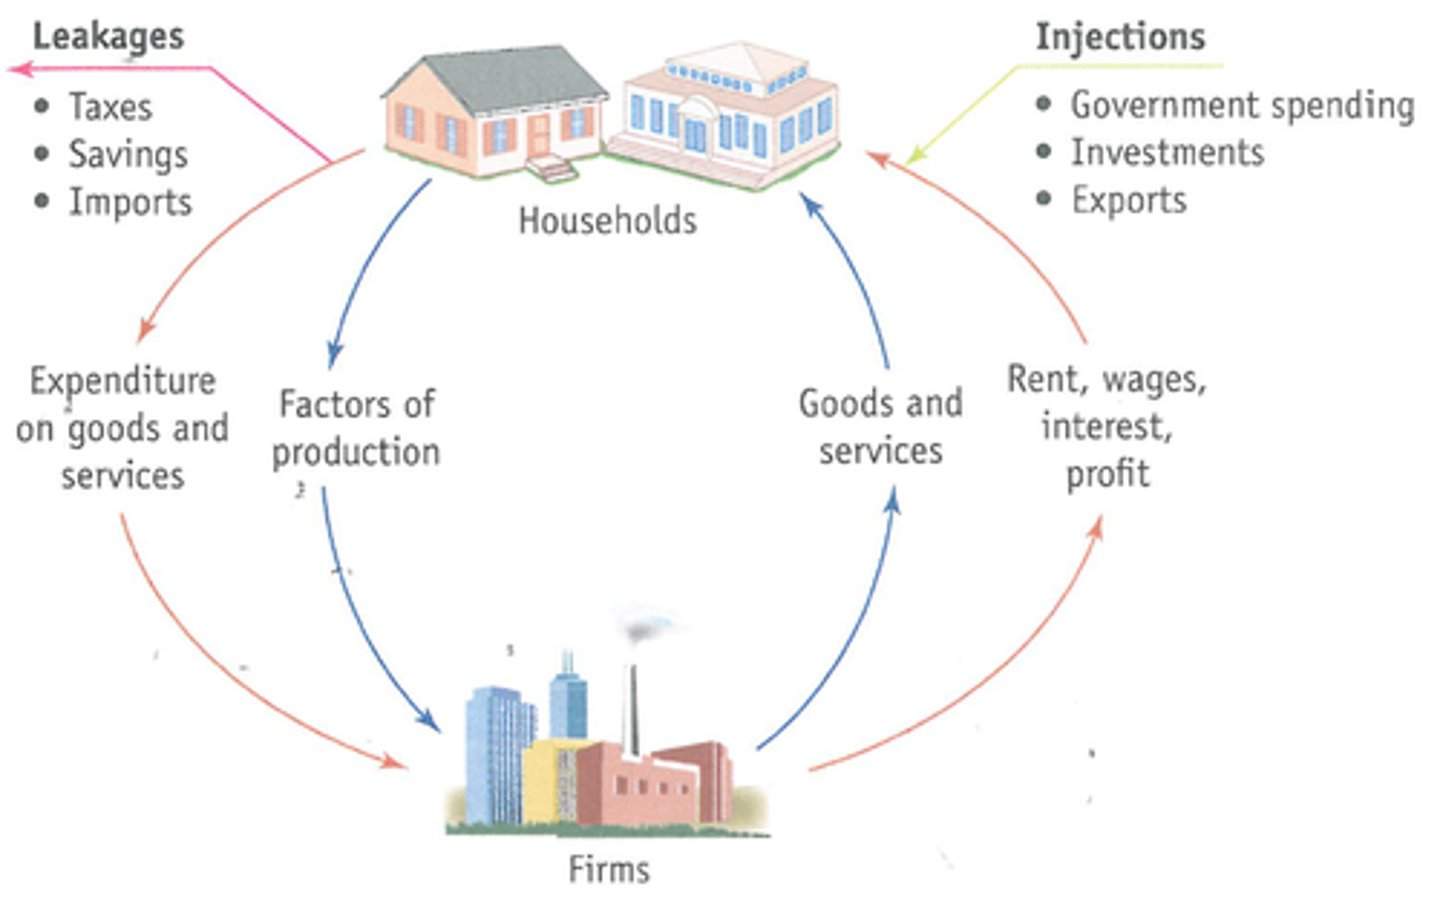
Circular Flow of Income
The movement of spending and income and output throughout the economy

CFOI Diagram
Households ---> Firms:
- Factor Services
- Expenditure
Firms ---> Households:
- Factor income
- Goods & services
Injections into Firms: GIX
Leakages out of Households: SIT
Closed Economy
An economy with no international trade
Open Economy
An economy open to international trade
Macroeconomic Equilibrium
The level of real output at which aggregate demand equals aggregate supply and Real GDP is not changing.
OR
The level of income at which leakages from the CFOI equals injections (S+I+T = G+I+X)
Injections (+sources)
When funds are added to an economy from a source other than households & firms.
Sources (GIX):
- Government Spending
- Investment
- eXports
Withdrawals/Leakages (+where to)
A leakage of spending power out of the CFOI into SIT:
- Savings
- Imports
- Taxation
Savings
Income which is not spent
Investment
Total planned spending by firms on capital goods produced within the economy
Taxes
Charges levied by the government on various economic activies (e.g. income tax, corporation tax)
Where Macroeconomic Disequilibrium occurs in CFOI
- SIT (leakages) > GIX (injections) and National Incomes decrease
- GIX > SIT and National Incomes increase
Multiplier
The relationship between a change in aggregate demand and the resulting (usually larger) change in national income (real gdp)
How does the multiplier work
- An injection into the CFOI leads to higher income
- A proportion of that income is spent
- Thus the injection generates income and successively multipler further increases in income
- Adding up the successive stages of income generation (total increase in income) is a multiplier of the initial spending increase
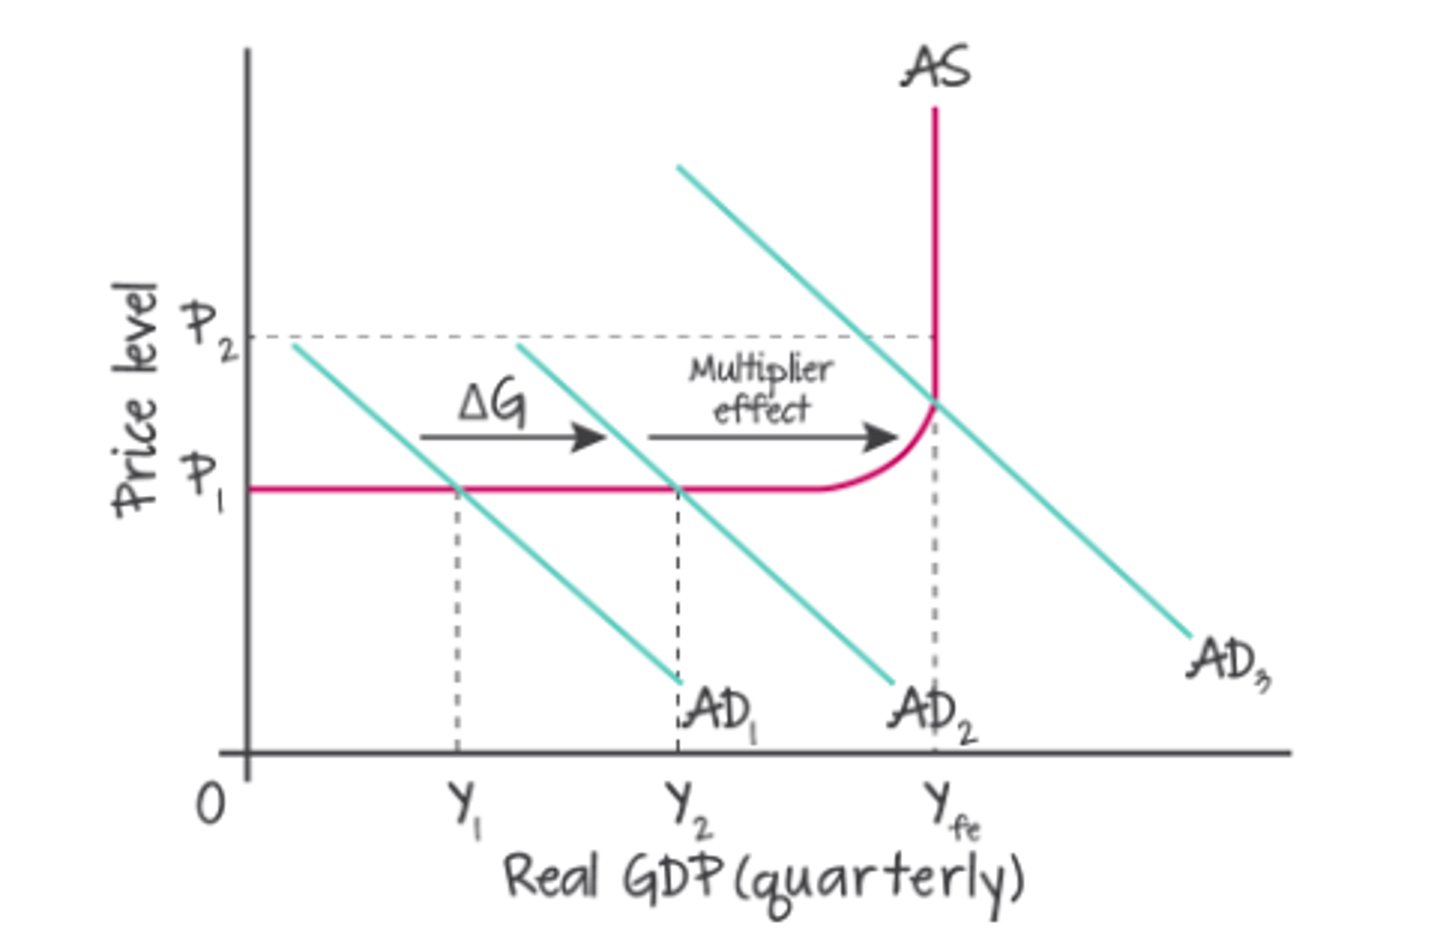
Multiplier Diagram
Successively smaller shifts of AD to the right
Multiplier (k) formula 1 =
Change in National Income / Initial change in Government Spending
Multiplier (k) formula 2 =
1 / (1 - MPC)
OR
1 / MPW
which is same as
1 / MPS + MPI + MPT
because Marginal Propensity to Withdraw = MP to Save + MP to Import + MP to Tax
MPC (Marginal Propensity to Conume) =
The proportion of an increase in income that people spend on domestically produced consumer goods
MPC = Amount spent / Extra income
9 marker CFOI & Multiplier Analysis
- In the circular flow model, when an injection is made into the economy (in the form of an autonomous change in AD), then that spending flows from firms to households
- Some is 'leaked' away in the form of savings, imports and taxation.
- But the remainder is re-spent and thus increases AD further.
- This cycle continues with multiple but successively smaller rounds of spending, with AD and real GDP increasing each time
- The initial injection can be shown by AD1 to AD2
- The further rounds of spending is 'induced consumption' shown by AD2 to AD2+K
- Correspondingly, the real GDP also increases and some may be deflected into a rise in the price-level.