APES Unit 3: Carrying capacity
1/3
There's no tags or description
Looks like no tags are added yet.
Name | Mastery | Learn | Test | Matching | Spaced | Call with Kai |
|---|
No study sessions yet.
4 Terms
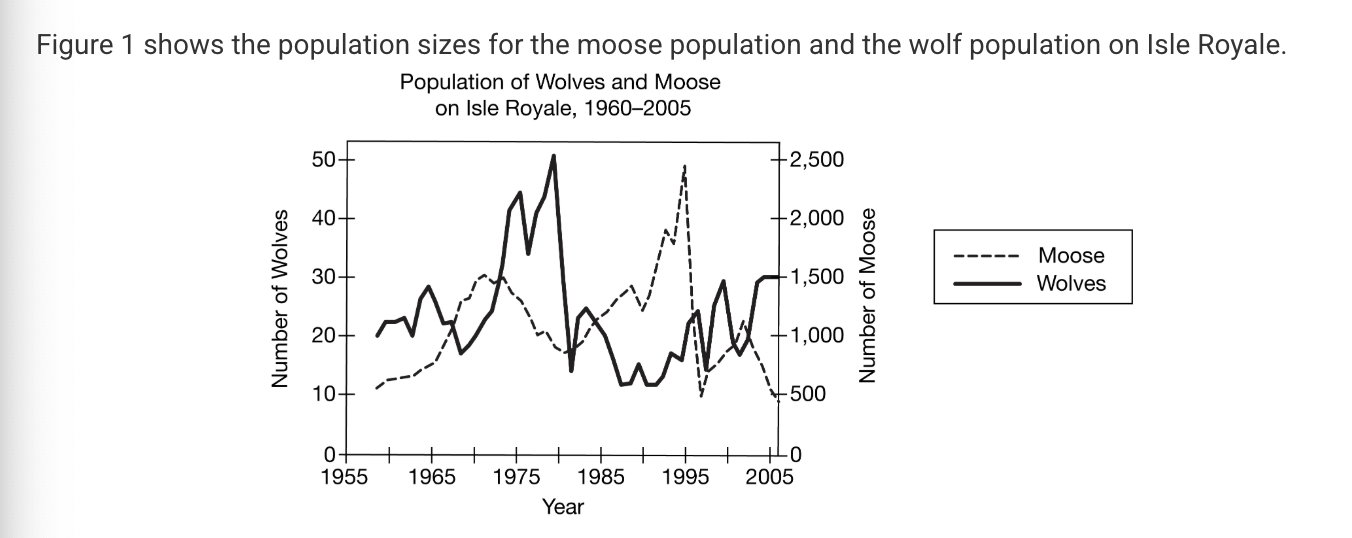
Which of the following claims is best supported by the data in the graph for the population of wolves between 1975 and 1985?
A) The population declined following depletion of food resources after a population overshoot.
B) The population reached its carrying capacity in 1980 because there was abundant prey.
C) The population increased exponentially when a new predator species was introduced to the island.
D) The population declined slightly and then returned to its carrying capacity following the outbreak of a disease.
A) The population declined following depletion of food resources after a population overshoot.
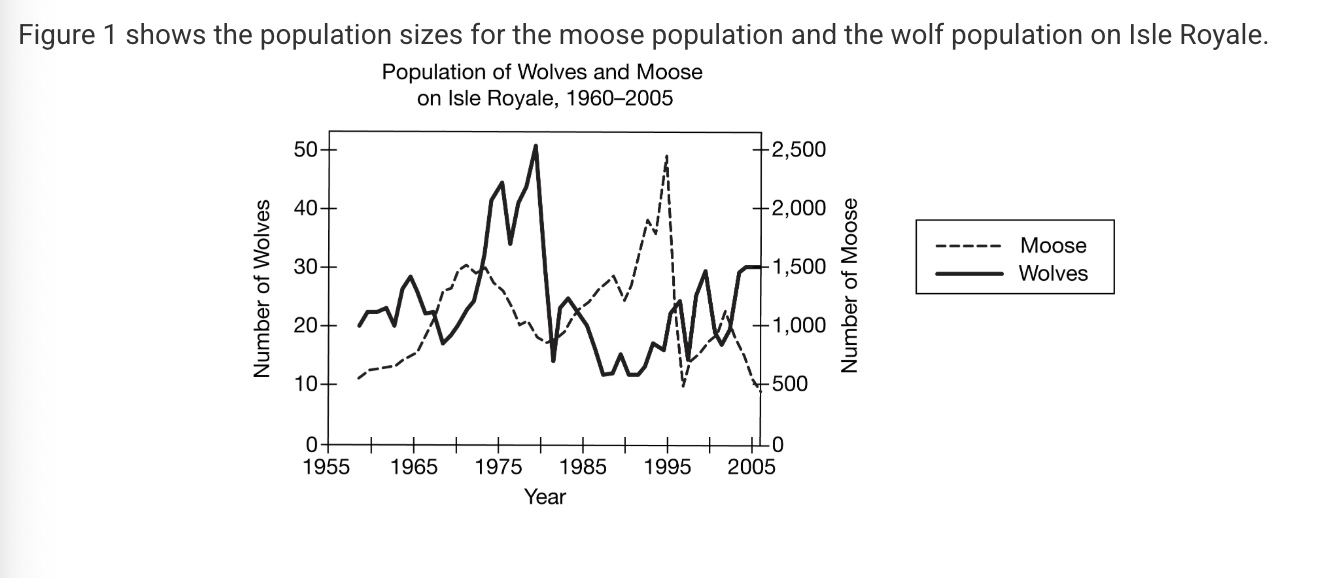
Which of the following best explains the change in the moose population from 1995 to 1997?
A) The large moose population led to a significant increase in the wolf population from 1995 to 1996, leading to increased predation of moose by wolves.
B) The high density of moose in the population led to a large number of moose emigrating from the island in search of mates and territory.
C) Plants in the area could not support the large population of moose in 1995.
D) The small number of wolves on the island could not support the large number of moose in 1995.
C) Plants in the area could not support the large population of moose in 1995.
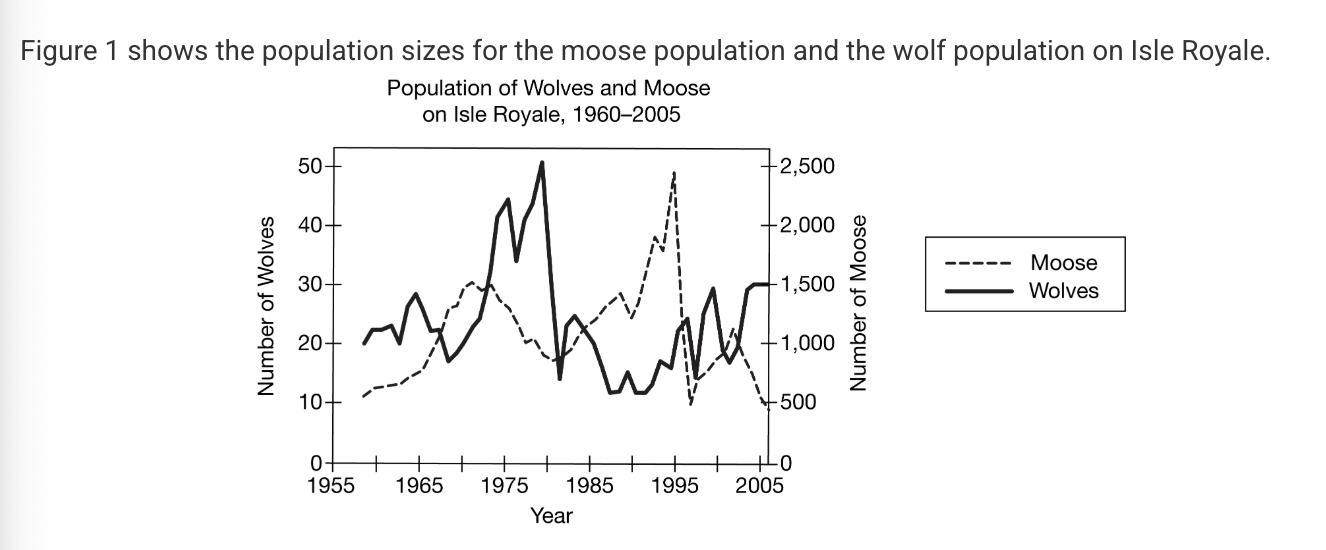
Based on the data in Figure 1, which of the following is the best estimate of the carrying capacity of the moose population?
A) 30
B) 50
C) 1,500
D) 2,500
C) 1,500
hope you did well
lol