Bivariate Linear Regression (Week 9)
1/19
There's no tags or description
Looks like no tags are added yet.
Name | Mastery | Learn | Test | Matching | Spaced | Call with Kai |
|---|
No analytics yet
Send a link to your students to track their progress
20 Terms
Purpose of Bivariate Linear Regression
To predict one variable from another variable using a straight line.
Bivariate Linear Regression Analysis
If two variables are correlated, you can use one to predict the other.
What does bivariate linear regression estimate?
Estimates parameters in a linear equation that can be used to predict values of one variable based on the other.
Equation for bivariate linear regression
Y = a + bX
Key advantage of bivariate linear regression
Provides a more detailed analysis, which includes an equation that can be used for prediction and/or optimization
IV and DV in bivariate linear regression
X must be the IV (aka the predictor)
Y must be the DV (aka the outcome)
To say that X is a predictor of Y, you must be able to establish:
Temporal Precedence (cause happens before effect)
Causal Mechanism (how exactly X affects Y/ the why)
Not better accounted for by correlation (JUST correlation)
No third variable causation ( spurious effects, confounding variables)
If you cannot do all the above, it is association (correlation)
Linear regression fits a ___ line to the data that is added to the scatterplot. This fitted line helps to ___ whether or not a ___ regression is a good fit to the data.
straight
show
linear
The two components to describe bivariate linear regression dataset
Trend (the general linear tendency)
positive or negative direction of the relationship
Scatter (variation from the trend)
How does bivariate linear regression work?
If a linear regression model is appropriate, then the fitted line (regression line) is used to predict a value of the response (dependent) variable for a given value of the explanatory (independent) variable
Also describes change y/ change x, AKA slope
Estimates the true, but unknown, linear relationship between the two variables
How is slope calculated?
Rise over run
OR
change in y divided by change in x
Equation for general regression line
Y’ = bX + a
Y’: Predicted Y score
b = Slope
X = Score for the predictor
a = Y-intercept ( value for where the regression line crosses the vertical axis, CONSTANT)
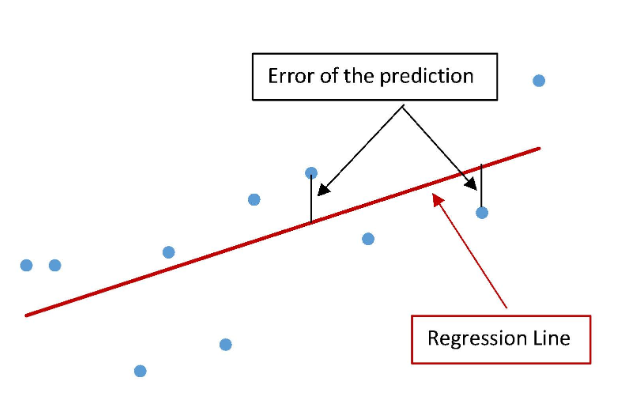
Standard error of estimate ( se)
The regression line will never perfectly pass through every data point
These errors are also called “residuals” individually
What does the standard error of estimate indicate?
Indicates, on average, how much the actual Y values differ from those predicted by the regression line Y’
Higher r = higher r2 = better the predication = lower
If our predication errors are normally distributed, se can be used to make a ___ ___ for our predictions
confidence interval
Y’ ± 1 Standard Error of Estimate = The range of predicted Y’ scores that will contain the actual Y ___% of the time
68%
Y’ ± 2 Standard Error of Estimate = The range of predicted Y’ scores that will contain the actual Y ___% of the time
95%
Y’ ± 3 Standard Error of Estimate = The range of predicted Y’ scores that will contain the actual Y ___% of the time
99%
Assumptions of Bivariate Linear Regression
Linearity: The two variables have a linear relationship
Normality: The two variables are approximately normally distributed
Independence: The measurements from each participant are in no way related to measurements from other participants
Homoscedasticity: The prediction of Y values is just as good/bad for all X values
How to check assumptions of Bivariate Linear Regression
Linearity: check the scatterplot
Independence: study design
Normality: not needed for this class
Homoscedasticity: not needed for this class