PY 211 - Exam 1
0.0(0)
0.0(0)
Card Sorting
1/37
Earn XP
Description and Tags
Study Analytics
Name | Mastery | Learn | Test | Matching | Spaced |
|---|
No study sessions yet.
38 Terms
1
New cards
Frequency
Describes the number of times or how often a category, score, or range of scores occurs
\
Purpose: to make the presentation and interpretation of the distribution of data much clearer
\
Purpose: to make the presentation and interpretation of the distribution of data much clearer
2
New cards
Relative Frequency
Divide the number of scores by the total number of data points (N)
3
New cards
Cumulative Relative Frequency
Add the relative frequency for the current score to the cumulative relative frequency for the previous score
4
New cards
Grouped Data
How often scores occur in intervals
\
summarized by group frequency tables. Data is often grouped when the data set is large.
\
summarized by group frequency tables. Data is often grouped when the data set is large.
5
New cards
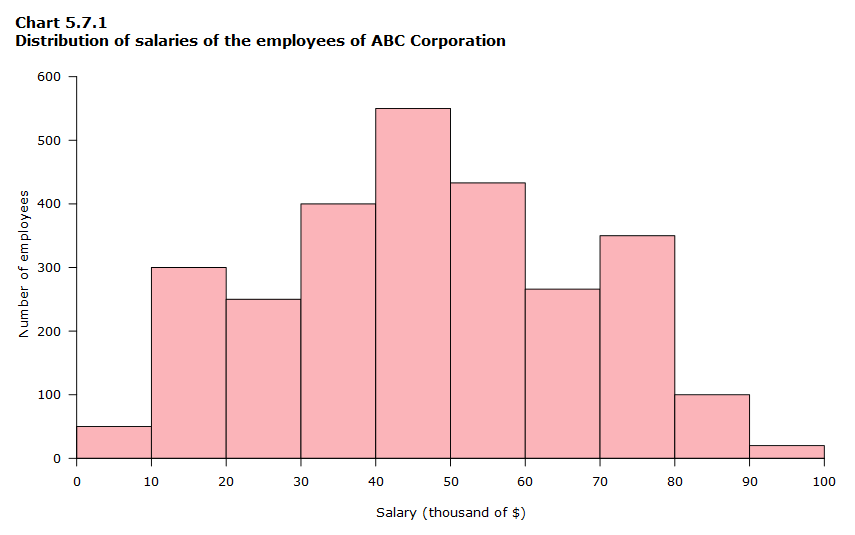
Histogram
used for group data especially
6
New cards
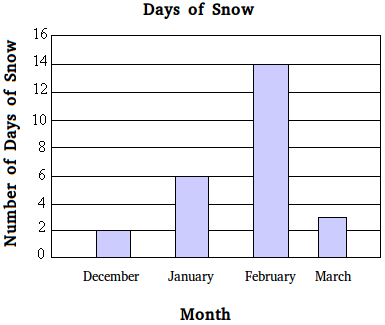
Bar Graph
used for data that is not grouped into intervals
7
New cards
Pie Charts
summarizes relative percent (relative frequency) of discrete and categorical data into sectors

8
New cards
Unimodal
If graph has one high point
9
New cards
Bimodal
Graph has two high points
10
New cards
Multimodal
3+ peaks on a graph
11
New cards
Symmetrical Distribution
Equal number on both sides of the middle line
12
New cards
Skewed Distribution
Anything clearly not symmetrical. Has one side that is long and spread out like a tail.
\
The side with the fewer scores is considered to be the direction of the skew.
\
The side with the fewer scores is considered to be the direction of the skew.
13
New cards
Nominal Level of Measurement
No information about order; no information about distance between categories
\
ex: age/gender
\
ex: age/gender
14
New cards
Ordinal
Contain information about order; no information about distance between categories.
\
ex: finishing places in a race, education level
\
ex: finishing places in a race, education level
15
New cards
Interval
Differences between values correspond to differences in the underlying variable
\
ex: happiness, anger (-5 to +5)
\
ex: happiness, anger (-5 to +5)
16
New cards
Ratio
Differences between values are absolute; veins at 0
\
ex: class standing, birth order
\
ex: class standing, birth order
17
New cards
Central Tendency
Statistical measures for locating a single score that is most representative or descriptive of all scores of distribution
\
mean, median, mode
\
mean, median, mode
18
New cards
Mean
the balance point in a distribution represented by the letter M
\
M = SigmaX/N
\
M = SigmaX/N
19
New cards
Median
The middle value in a distribution of data listed in numeric order
\
Median position = (N+)/2
\
Median position = (N+)/2
20
New cards
Mode
The value in a data set that occurs most often
21
New cards
When is mean appropriate?
1. appropriate when data are normally distributed
2. appropriate when data is measured on an interval or ratio scale
22
New cards
When is Median appropriate
1. appropriate when data has a skewed distribution
2. appropriate when the data is measured on an ordinal scale
23
New cards
Variability
Provides a quantitative measure of the degree to which scores in a distribution are spread out or clustered together
\
purpose: to describe the situation, measure how well an individual score represents the distribution
\
purpose: to describe the situation, measure how well an individual score represents the distribution
24
New cards
How to Calculate Variance
calculate the mean, subtract mean from each score the data set to get you the deviation score, square each deviation score, add up each squared deviation score and divide them by the amount of scores that you have.
25
New cards
Standard Deviation
The most widely used number to describe a group of scores. It is simply the square root of the variance.
26
New cards
Range
The spread of your data from the lowest to the highest value in distribution
\
the difference between the smallest score and the highest score.
\
the difference between the smallest score and the highest score.
27
New cards
Normal Curve
\-1 to +1 = 68% of data
\-2 to +2 = 95% of data
\-3 to +3 = 99% of data
\-2 to +2 = 95% of data
\-3 to +3 = 99% of data
28
New cards
Z-Scores
Specifies the precise location of each x value within a distribution. The numerical value specifies the distance or standard deviation of a value from the mean
29
New cards
Purpose of z-scores
1. tells you the exact location of the raw score within a distribution
2. forms a standardized distribution that can be directly compared to other distributions that have also been transformed
30
New cards
Population
an entire group of people to which a researcher intents the results of a study to apply
31
New cards
Sample
scores of a particular group studied
32
New cards
Random Selection
You start with the whole population and then randomly select some participants to be in the study.
33
New cards
Population Parameters
the mean, variance, and standard deviation of a population
34
New cards
Sample Statistics
The mean, variance and standard deviation for the scores in a sample
35
New cards
Probability
expected relative frequency of a particular outcome
36
New cards
Outcome
Observed results of an experiement
37
New cards
Addition Rule
Used when there are two or more mutually exclusive outcomes (which means if one outcome happens the other cannot). The total probability of either outcomes is the sum of the individual probabilities
38
New cards
Multiplication Rule
Use this to figure the probability of getting both of two (or more) independent outcomes. The probability of getting two or more independent outcomes is the product of the individual probabilities.