week 8 - Introduction to Confidence Intervals & Hypothesis Testing and Comparing Two Means
1/27
There's no tags or description
Looks like no tags are added yet.
Name | Mastery | Learn | Test | Matching | Spaced | Call with Kai |
|---|
No analytics yet
Send a link to your students to track their progress
28 Terms
explain a 95% confidence interval
on average, 95% of the confidence intervals contain mu - success rate rate of the procedure
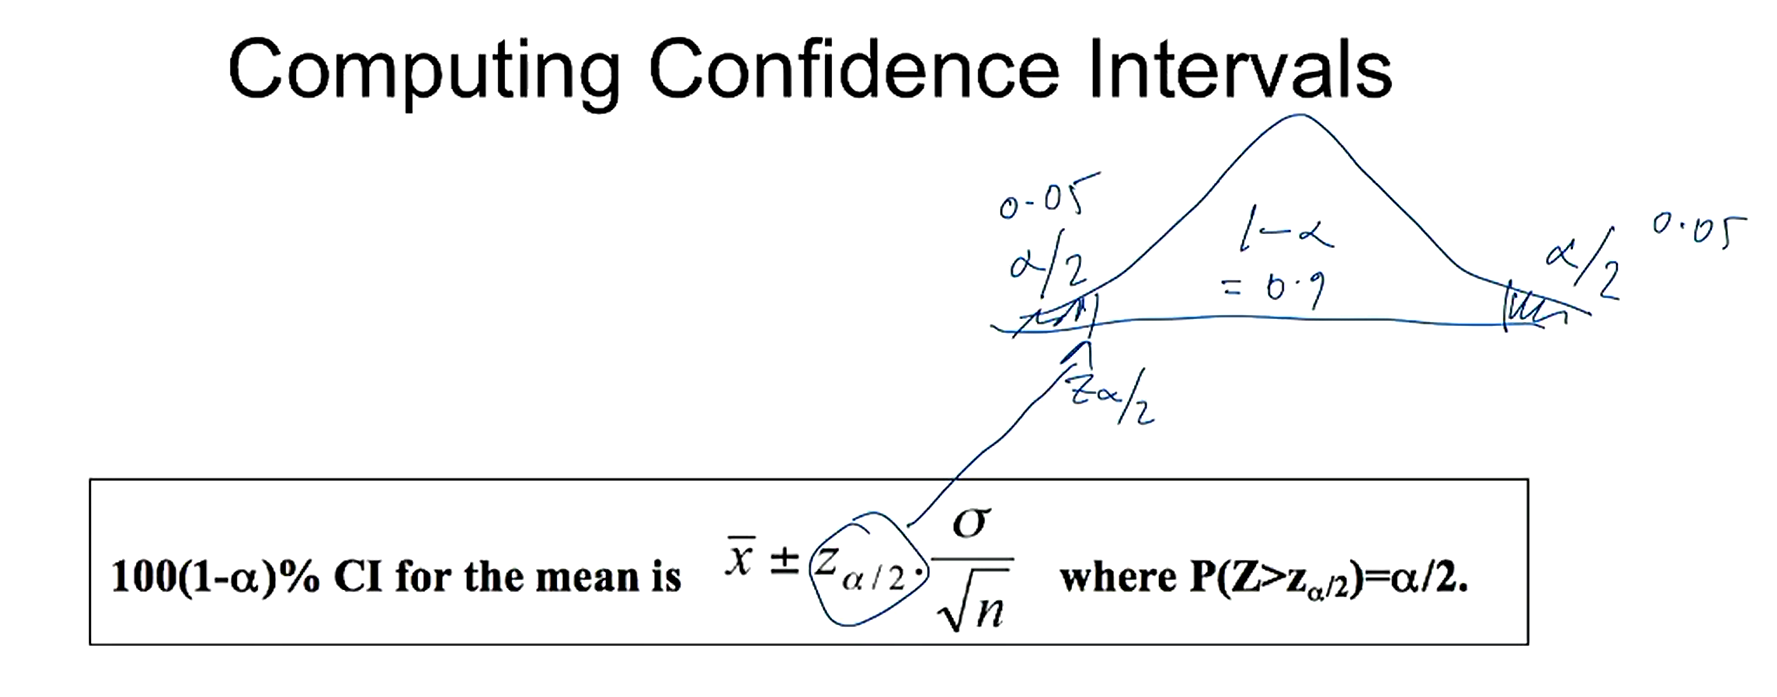
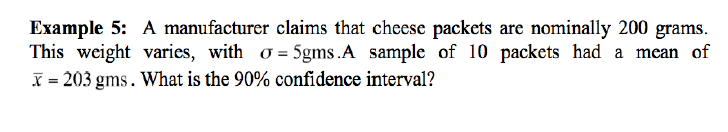
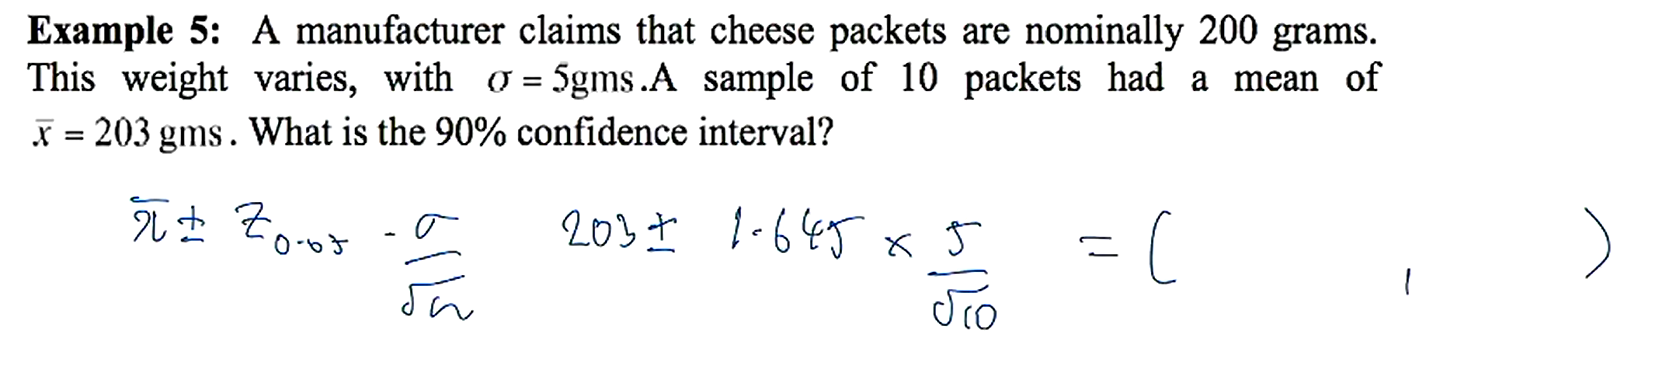
what is the general structure of a confidence interval for a known sigma? draw a distribution to illustrate a 90% CI
as the level of confidence increases, what happens to the width of the interval? why is this the case?
as the level of confidence increases, the interval becomes wider
this is because the only thing changing is the multiplier - as level of confidence increases, multiplier also increases
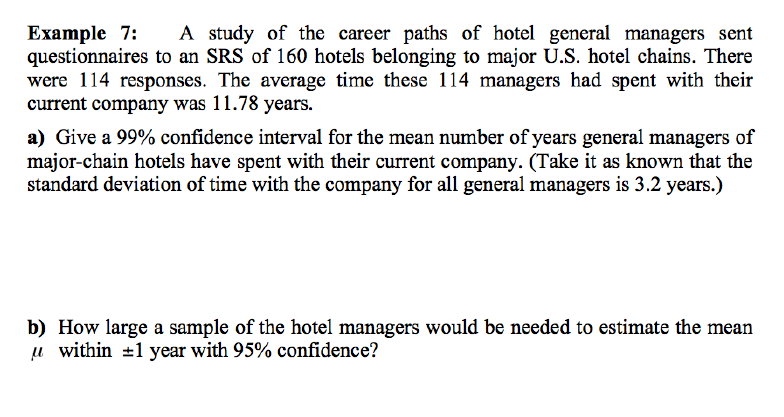
what 3 factors must you consider when trying to determine the required sample size?
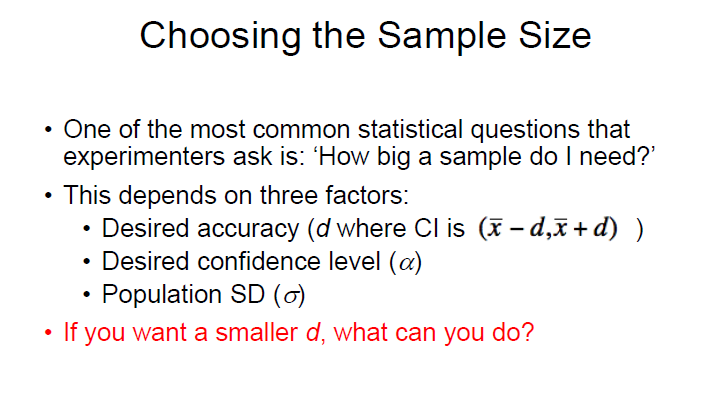
how do you achieve a smaller margin of error (d)?
lower level of confidence, thus lower z multiplier
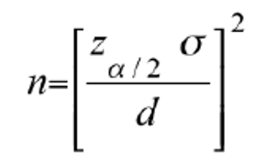
how do you calculate the appropriate sample size given a desired accuracy and margin of error?
why do we tend to use wider intervals and a larger n when sigma is unknown?
to account for the extra variability from using s rather than sigma
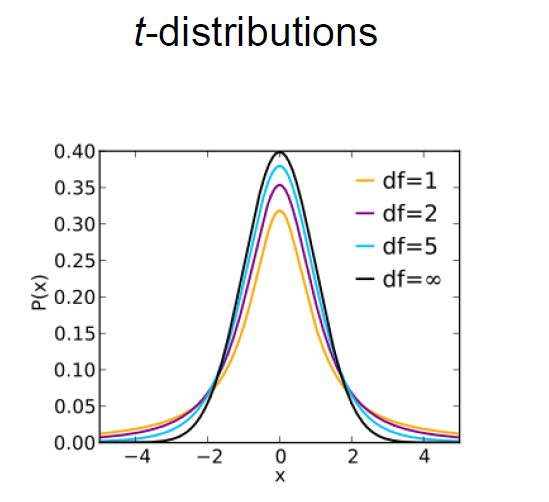
describe the features of t distributions. what are the differences between t distributions and the normal distribution and when does the t dist = the normal dist?
longer tails thus give larger CIs - harder to reject H0
does not have a fixed width - changes depending on the sample size
normal dist is a single curve, t dist is a family of curves that changes with df
when df = infinity, you get the normal distribution
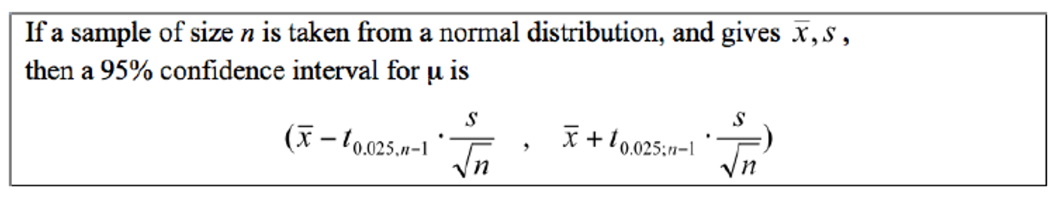
define a 95% confidence interval for mu with an unknown sigma
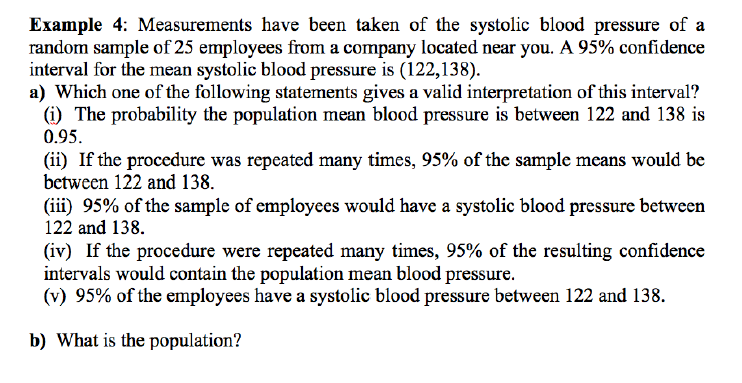
a) iv - success rate of procedure
b) all employees of the company near you
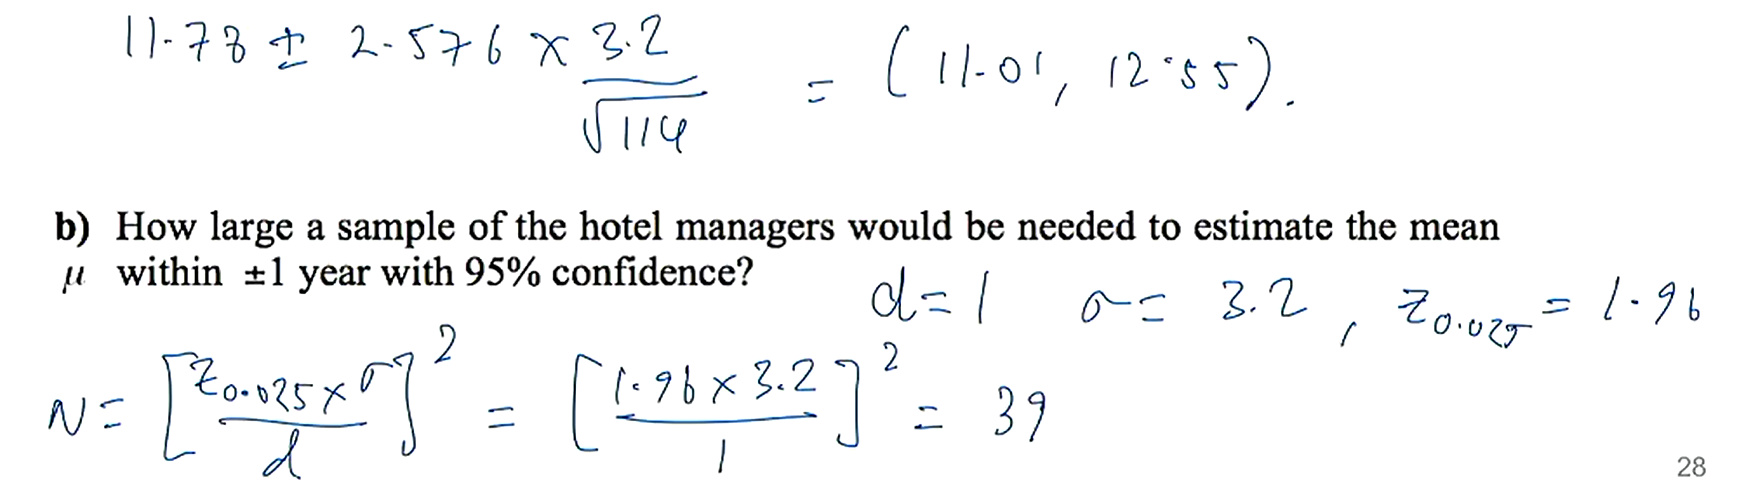
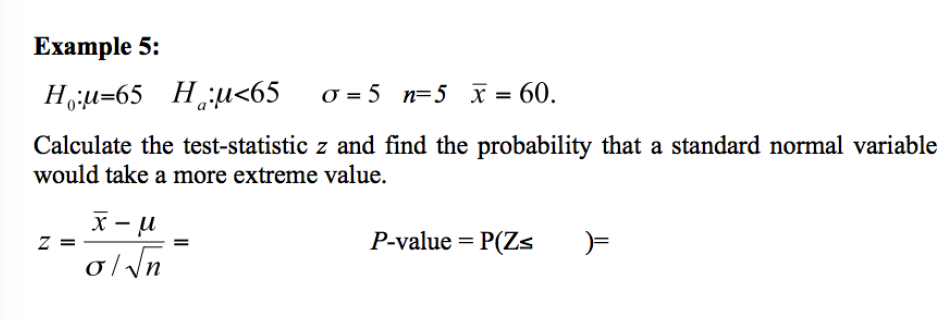
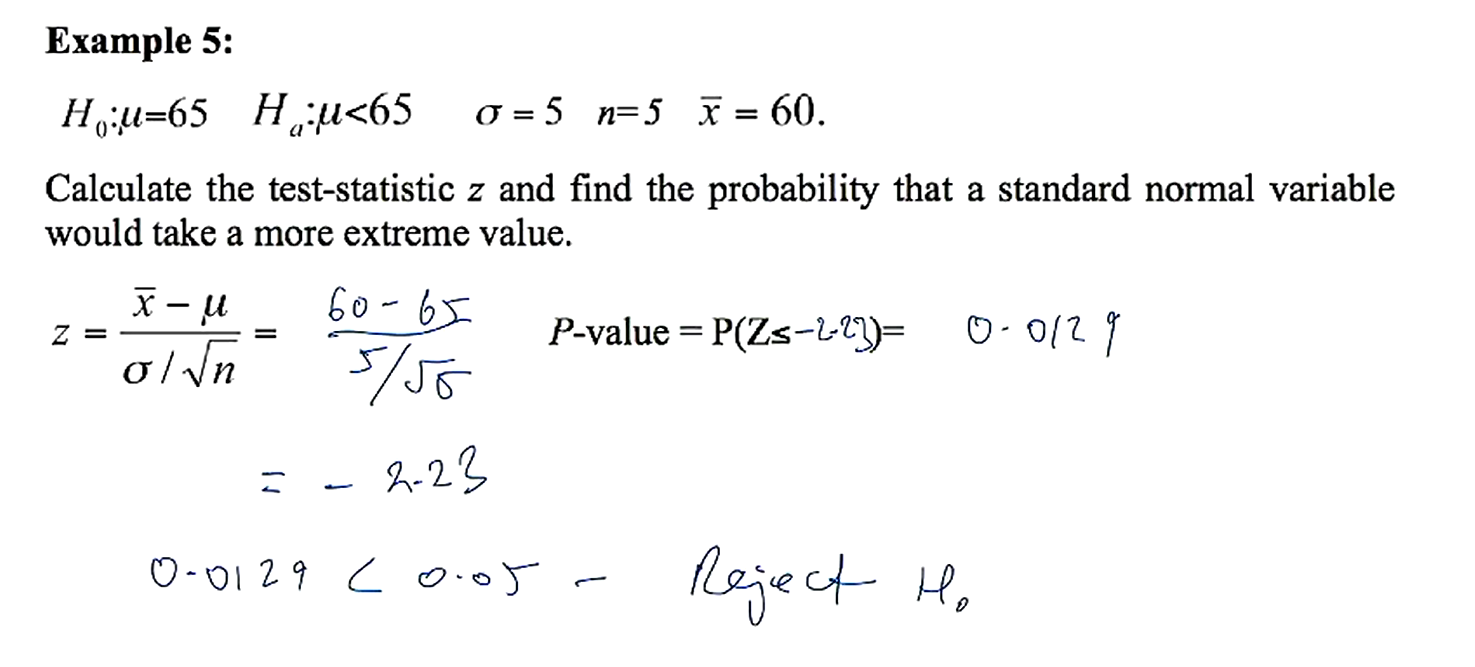
define the test statistic for a known sigma
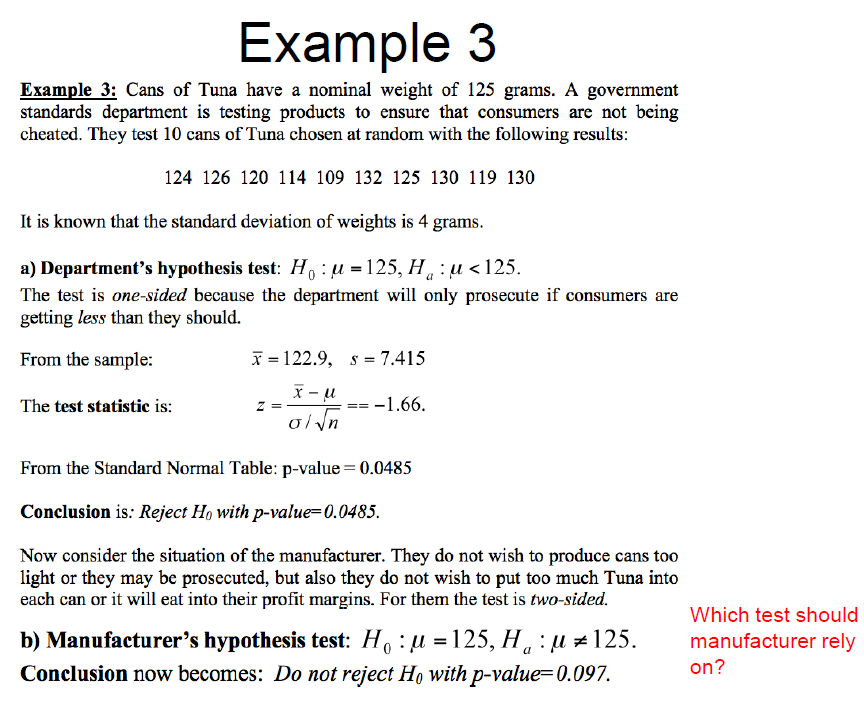
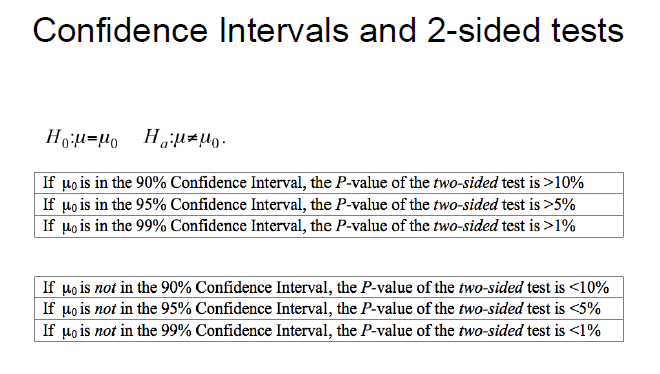
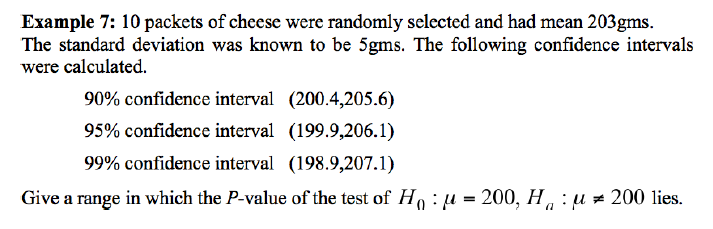
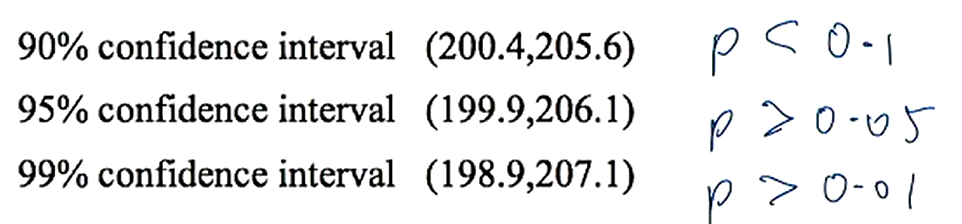
when is there a relationship between confidence intervals and tests of significance?
no answer?
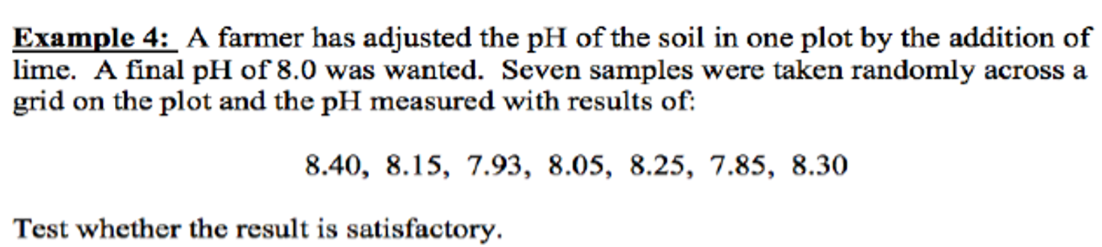
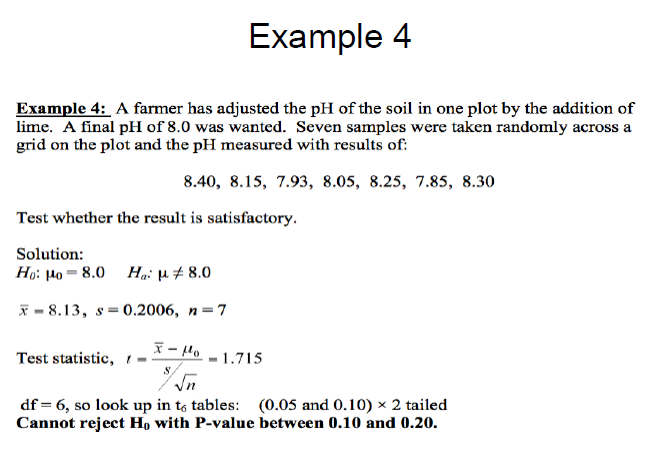
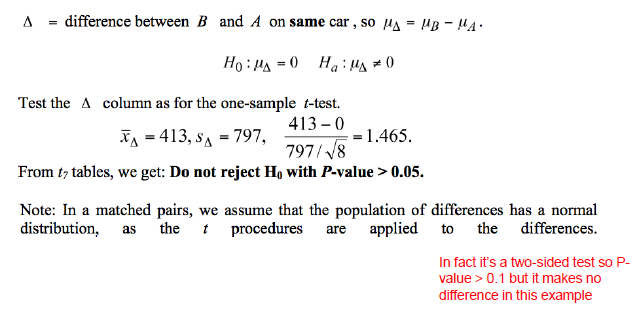
p between 0.1, 0.2 (2 sided)
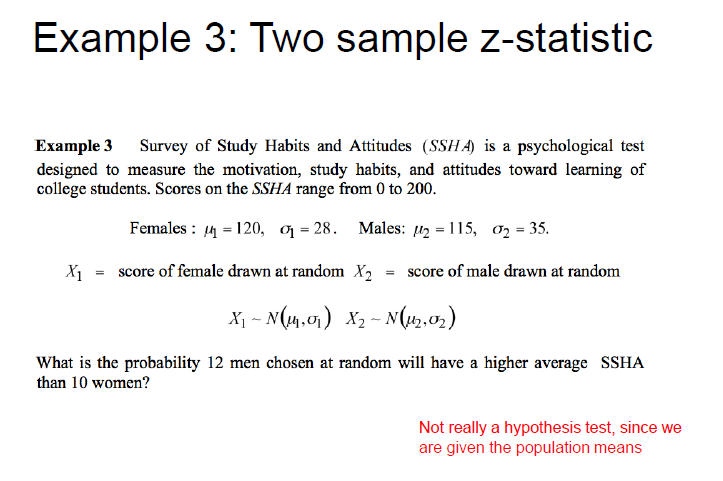
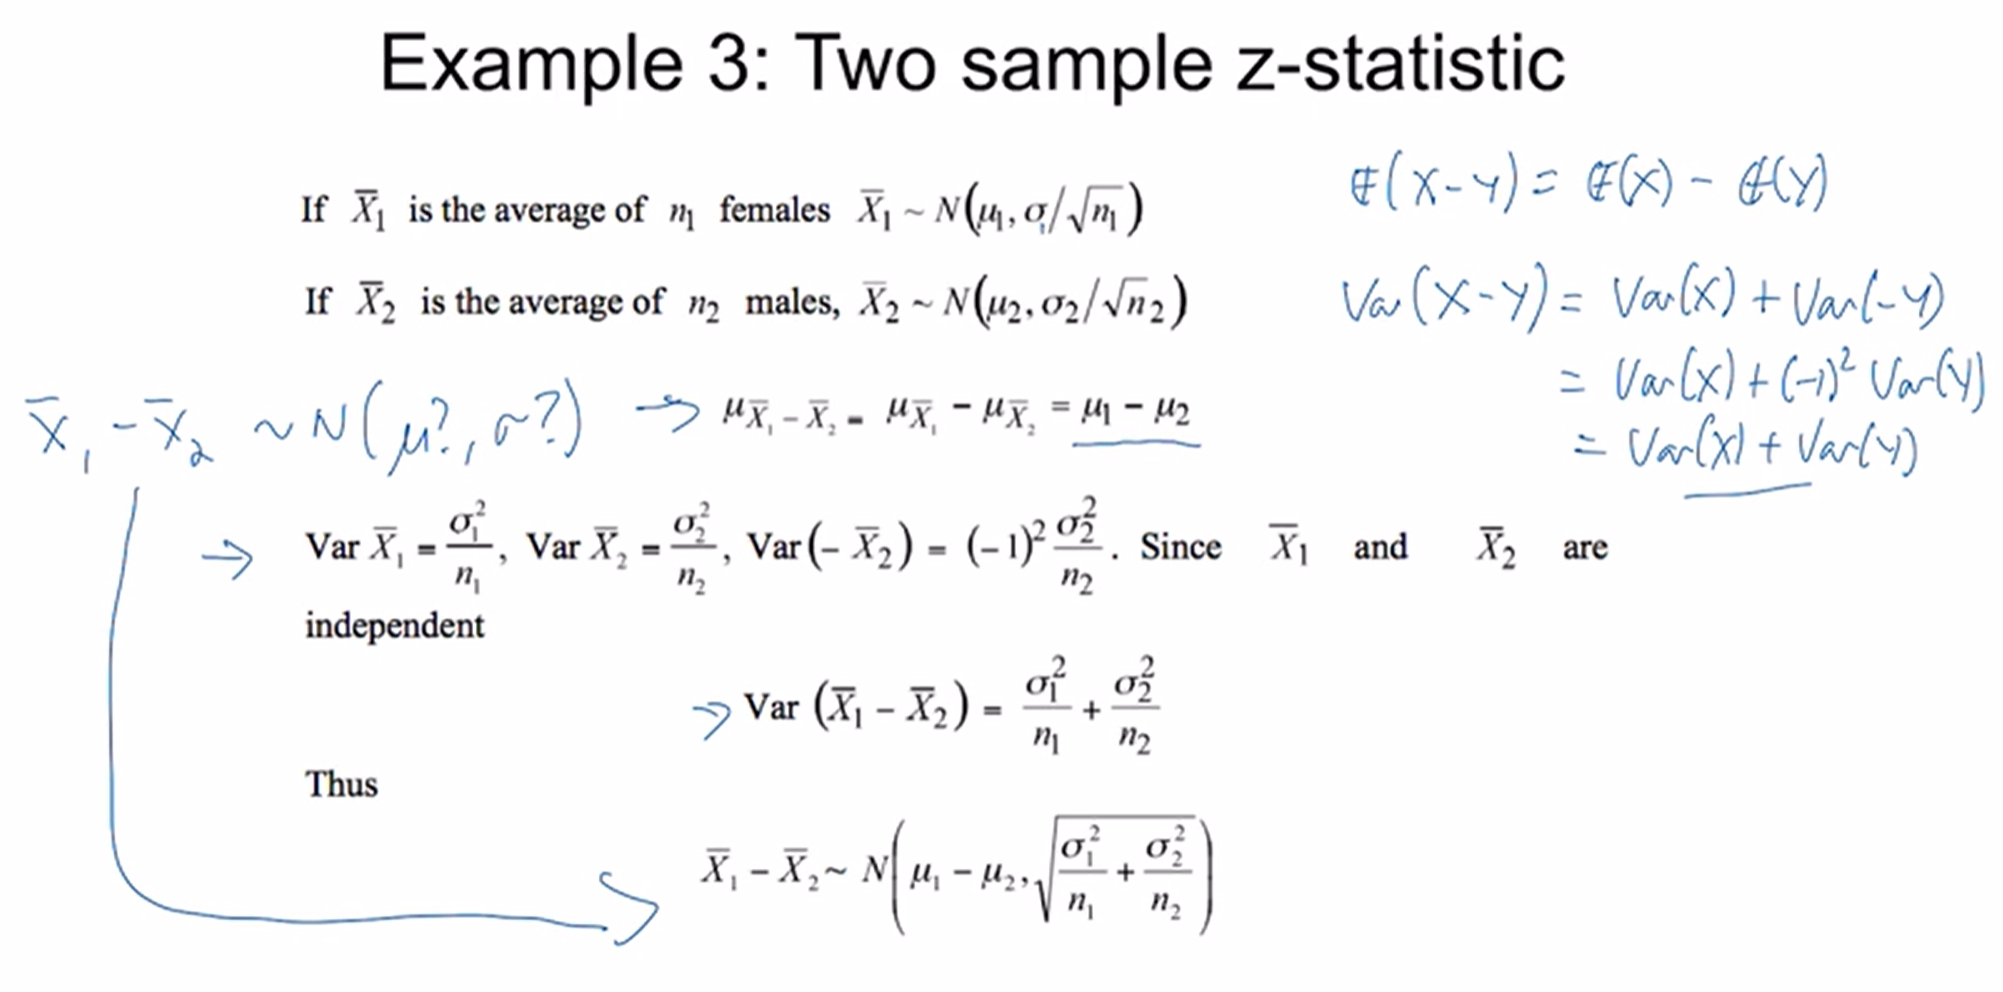
we are finding the prob that men will have a higher average, thus X1 (females) - X2 (males) will be negative → we are finding the prob that Z is less than a certain value
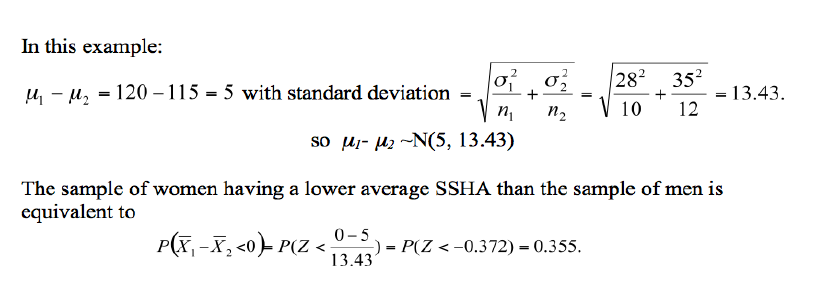
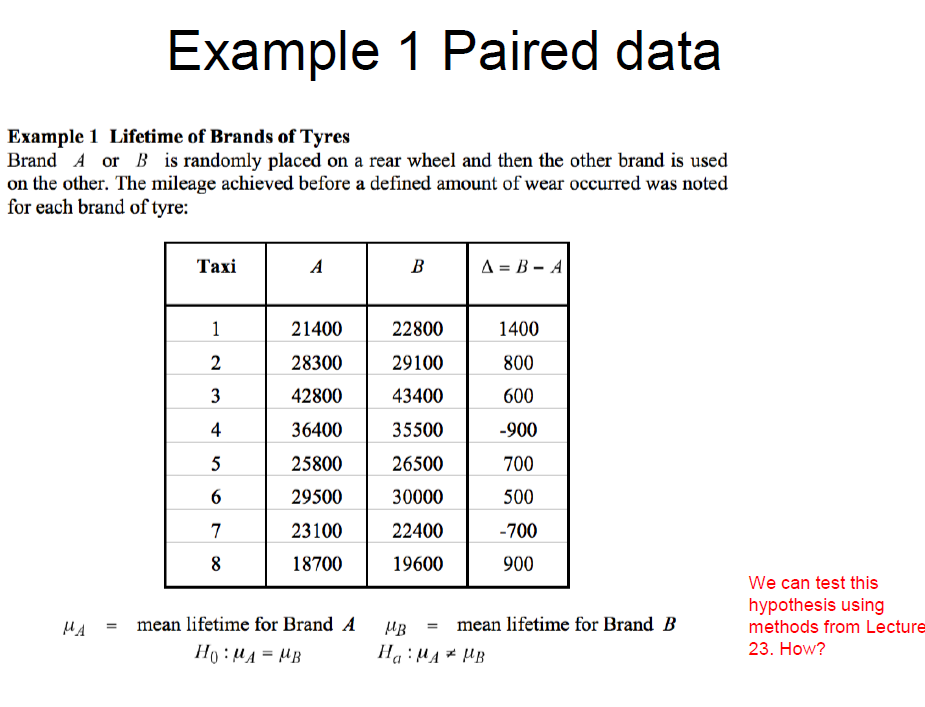
explain these calculations
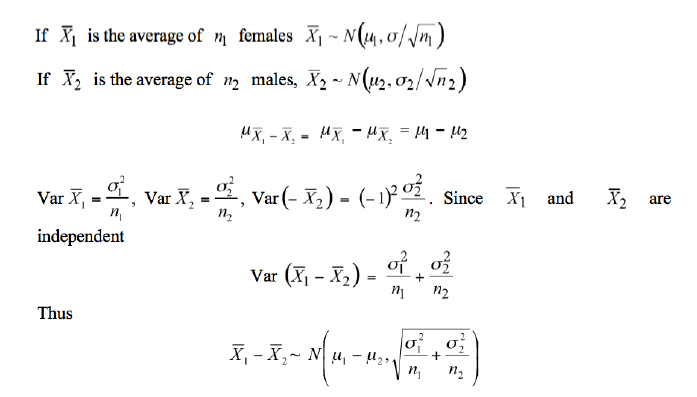
we can take the means of the differences, as the expectation of the differences is simply X1-X2
we can find SD by adding the expected variances. each independent variance = SD^2/n
thus, SD of each independent sample is sqrt (SD^2/n). we can add the SDs as they are independent (E(X1-X2))
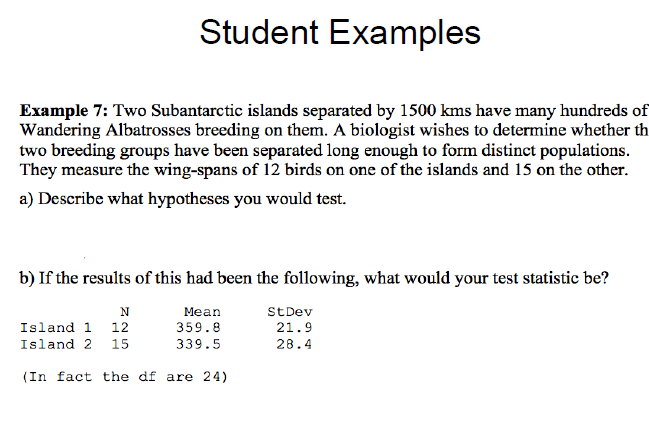
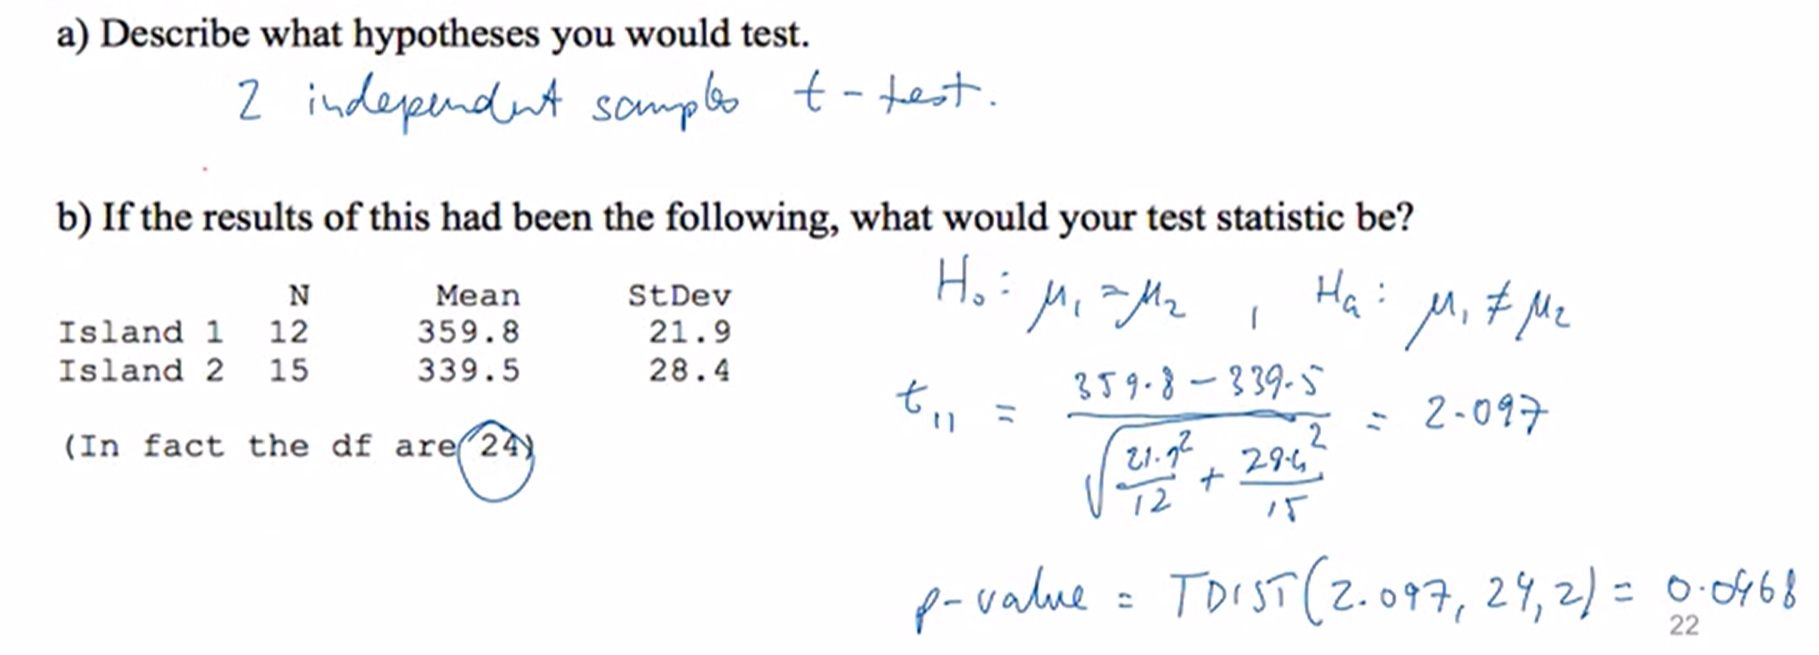
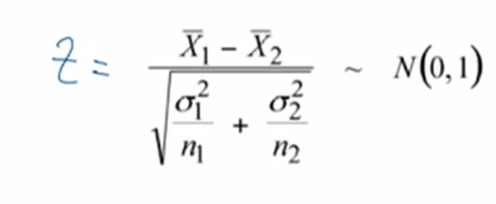
how do you calculate the 2 sample Z statistic? how is the 2 sample t statistic different to this?
t statistic using s rather than sigma
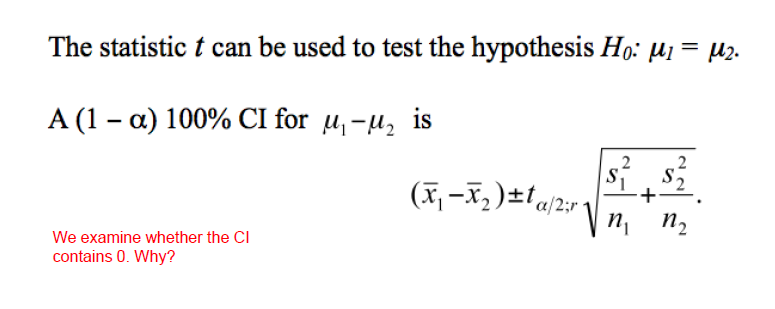
how do you construct a confidence interval for a 2 sample t test?
we want to know if zero is within the confidence interval
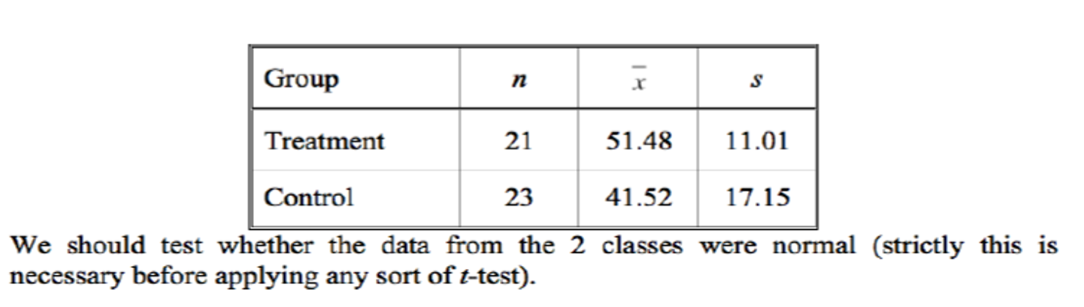
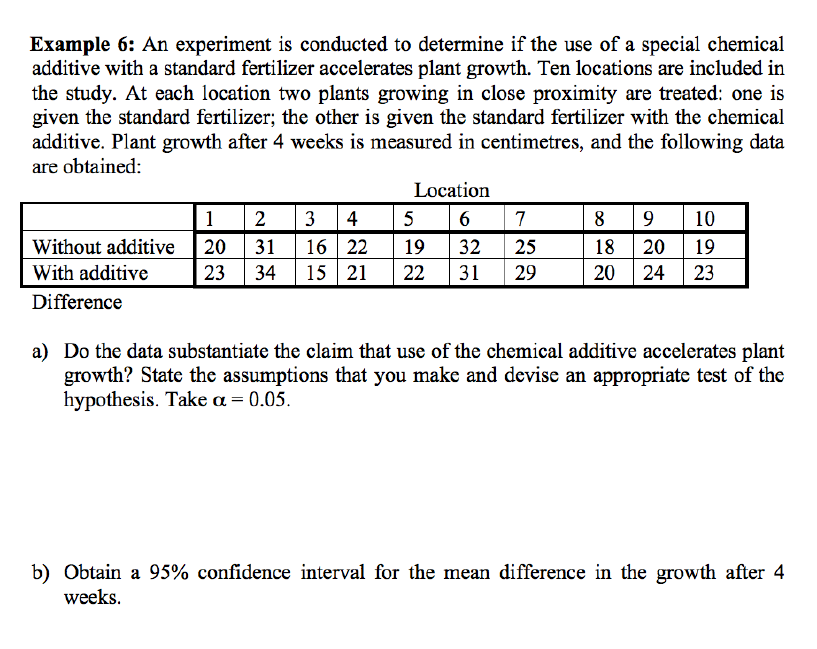
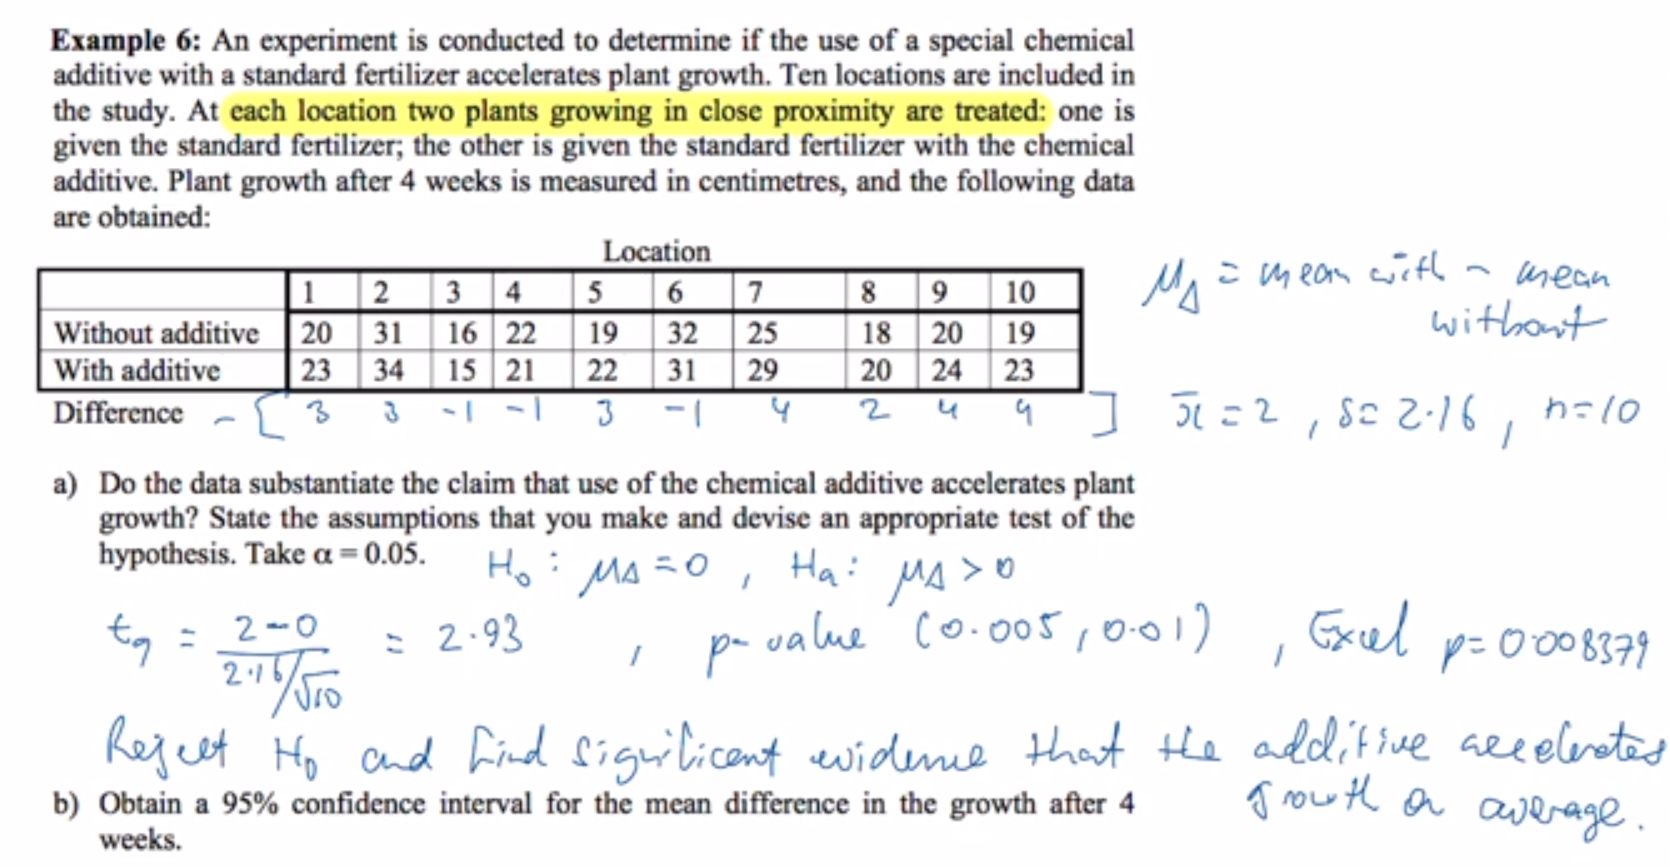
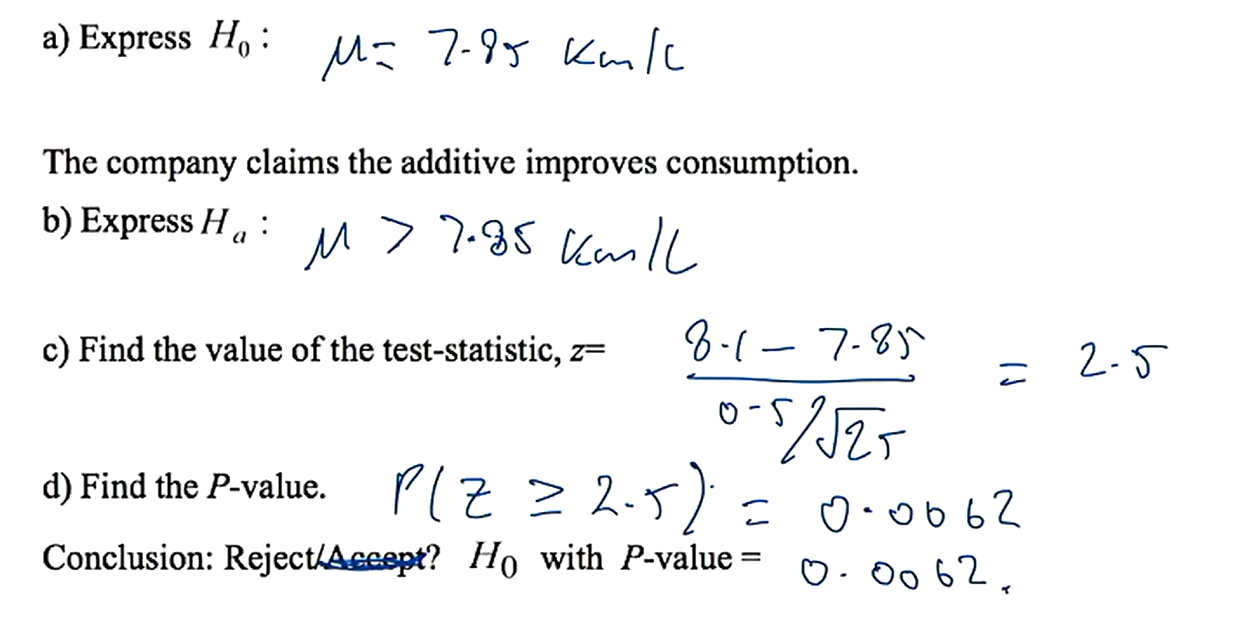
does the treatment group result in a significantly larger mean?