PT 451 Statistical Inference
1/66
There's no tags or description
Looks like no tags are added yet.
Name | Mastery | Learn | Test | Matching | Spaced |
|---|
No study sessions yet.
67 Terms
population
entire group of people that you're studying
sample
actual group of people that you're studying
normal curve
The frequency distribution of a continuous trait in population is assumed to approximate a _______________ ___________ (bell curve)
frequency distribution
plot of the count for different values of a trait
68.3%
μ ± 1σ contains what percentage of all values in a normal distribution?
99.7%
μ ± 3σ contains what percentage of all values in a normal distribution?
95.5
μ ± 2σ contains what percentage of all values in a normal distribution?
± 1.96 σ
95% of all values in a normal curve will fall within what value?
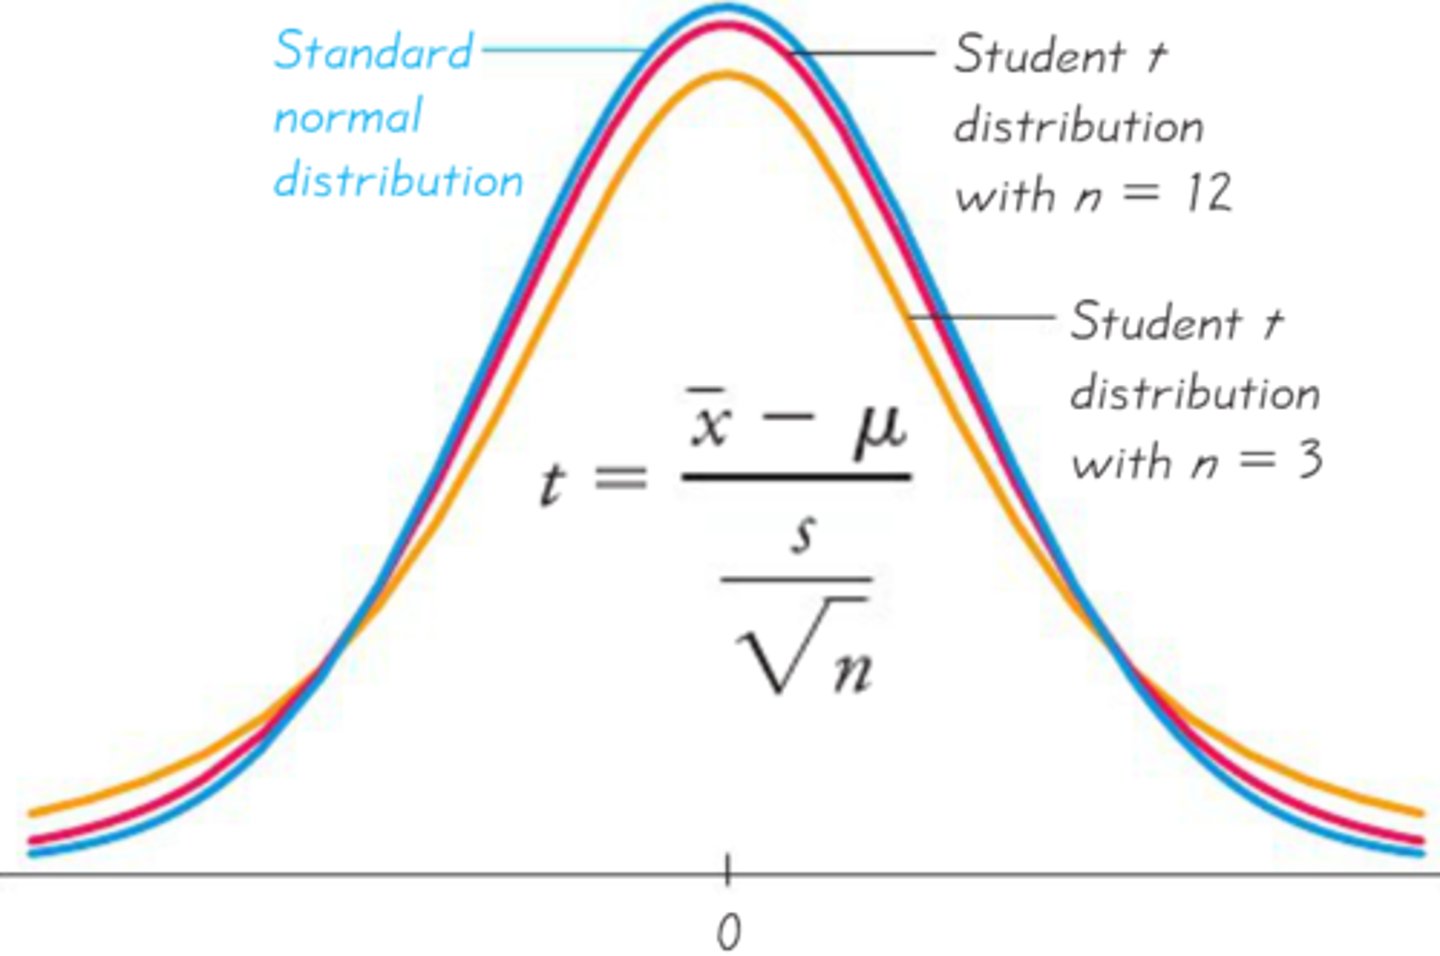
t-distribution
The frequency distribution of a continuous trait in a sample is assumed to approximate what curve?
t-distribution is flatter
difference between t-distribution and a normal distribution
False (Each sample size has its own t-distribution)
True or false? T-distribution remains the same among different sample sizes as long as the variable being measured stays the same
wider, flatter
Describe t-distributions for smaller samples
smaller
When sample size decreases, each standard deviation from the mean includes a smaller or larger proportion of the values in the the t-distribution
decreases
The number of standard deviations decreases or increases as sample size increases within a specific percentage of all the values in a distribution
number of values free to vary
degrees of freedom
sampling error
mismatch of mean and standard deviation between sample and population
False (always occurs)
sampling error only occurs when you collect an inaccurate sample. True or False?
standard error of the mean
error associated with our sample mean
decreases
what happens to the SEM when sample size decreases regardless of whether s stays the same?
confidence intervals
How do we account for sampling error
95%
most common CI
population
Range of values we are 95% confident contains the estimated sample or population parameter?
False
True or false? The 95% CI is the range of values that contains 95% of all the values
False (we can not "prove" anything. only "disprove").
To prove something, we test where two groups are the same. True or False?
null hypothesis
what do we formulate to test whether two groups are the same?
alternative hypothesis
What do we accept if we disprove the null hypothesis?
No (we only "fail to reject")
Should we ever technically "accept" a hypothesis?
dichotomous
What kind of outcome is produced from inferential statistic
null hypothesis
Inferential statistics estimate the probability that the _________________________ is correct
p-value
the probability of observing
some effect under H₀ (i.e., purely by chance)
mean difference, standard deviation, sample size
what three things is the p-value based on?
high
When effects are small, variable, and derived from a small sample size, the p-value is high or low?
directional hypothesis
a hypothesis that makes a specific prediction about the direction of the relationship between two variables
nondirectional hypothesis
research hypothesis that does not predict a particular direction of difference between the population like the sample studied and the population in general
one-tailed
What kind of statistical tests do we use with directional hypotheses?
one-tailed
Do one-tailed or two-tailed have lower critical values?
Type I errors
Error occurring when we reject the null hypothesis, but it is actually true (false positives)
Type II errors
Error occuring when we accept the null hypothesis, but it is false
Type 1
Which error is more serious? Type 1 or Type 2?
significance level
The rate of Type I errors is set by what parameter of inferential statistics.
significance level α
The p-value that we are willing to accept in order to reject H₀
0.05
What is the most common value for α?
critical value
represents how many standard errors that two scores must be from one
another to be considered differen
larger
When we calculate a t-statistic, if it is
_____________ than this critical value, then we reject H₀
power
The rate of Type II errors is set by what parameter of inferential statistics.
β
The probability of making a Type II error is defined as ____
0.2
most common value for β
1-β (0.80)
Power formula
α, variance, sample size, and effect size
Power is a function of what 4 things?
power analysis
a statistical method to determine the acceptable sample size that will best detect the true effect of the independent variable
priori power analyses
a statistical method that helps researchers determine the minimum sample size needed for a study to detect an effect with a certain level of confidence. It's performed before data collection begins as part of the research planning process
post hoc power analysis
power analysis conducted after a study
minimal detectable effect
represents the smallest effect that a statistical test can detect.
central limit theorem
Tells us that as we sample a population, the frequency distribution for sample means will approximate a normal distribution, even for skewed
population distributions.
True (central limit theorem)
It is possible to apply inferential statistics based on normal curves to skewed variables. True or False?
True
Larger samples are likely to give more consistent sample means that are closer to the true population mean. True or False?
parametric statistics
Statistics that assume we can estimate population parameters from our sample
1. data derived from known sampling distribution
2. data points are independent observations
3. close variances
4. Interval and ratio data
4 assumptions of parametric statistics
nonparametric statistics
do not try to estimate population parameter; don't assume that the
population follows a known sampling distribution.
distribution-free statistics
another name for nonparametric statistics
too small sample size, nominal or ordinal data,
When should you use nonparametric statistics?
z-test, one-sample t-test
statistical test used to compare a sample to the population
population mean, population standard deviation
What does a z-test use in its calculation?
hypothetical mean, sample standard deviation
What does a one-sample t-test use in its calculation?
standard errors the sample mean differs from the population mean
The z or t statistic represents what?
1.65
test statistics exceeding what value in one-tailed experiments are considered extreme enough to reject the H₀
1.96
test statistics exceeding what value in two-tailed experiments are considered extreme enough to reject the H₀