Looks like no one added any tags here yet for you.
3 displays for measuring the shape:
histogram, stemplot, boxplot
Histogram
involves having intervals each of the same size (classes)
counting the # of data pts that fall into each class (giving us frequency)
Drawing our graph w/the vertical axis being frequency & horizontal axis our variable labeled by the ends of the classes
Has 4 shapes; Right Skewed, Left Skewed, Normal/Bell, & Uniform
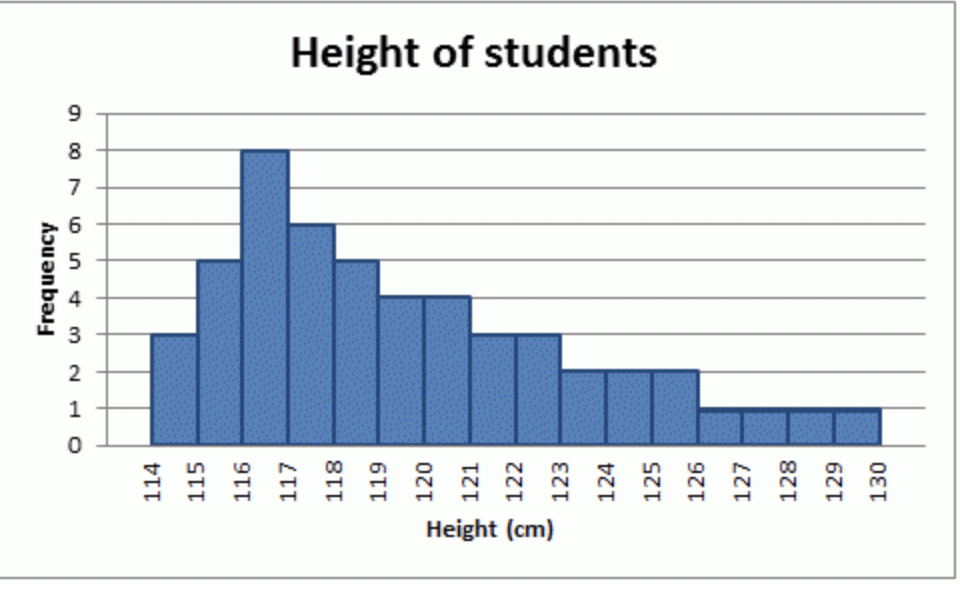
Right Skewed Distribution
has most of the data on the low side but few very high values on data set. So low values common & high values rare.
Found as; mean > median
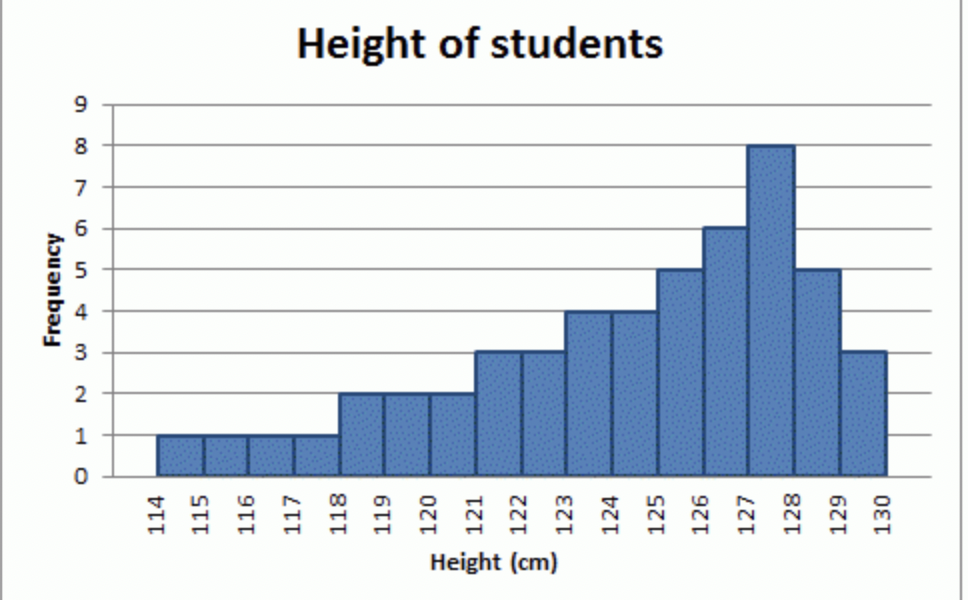
Left Skewed Distribution
has most of the data on the high side but few very low values on data set. So high values common & low values rare.
Found as; mean > median
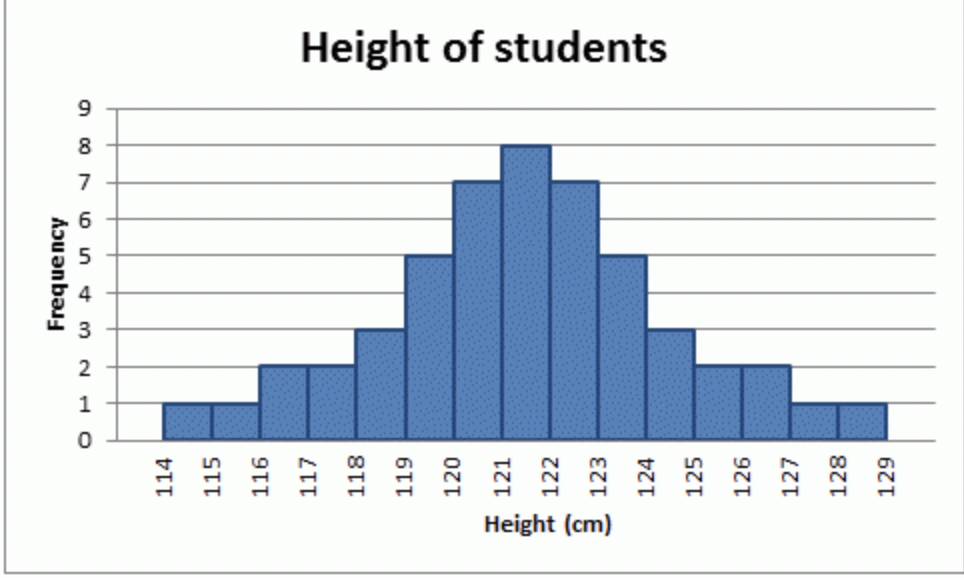
Normal/Bell Distribution
has most of the data in the middle but few very low & high values on data set
Found as; (since symmetrical) mean = median
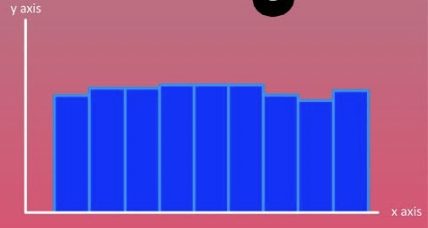
Uniform Distribution
low values, medium values, ^ high values are all equally likely. So all values are equally likely to occur
Found as; (since symmetrical) mean = median
When using [ you need to _______ the data set to your histogram.
Is also always on the left end
include
When using ( you need to _______ the data set to your histogram.
Is also always on the right end
exclude
Histograms are ____ for when we have alot of quantitative data. And are only ____ because it doesn’t show the actual data points
good, bad
Stemplot
has each data pt broken into a stem & leaf portion
Leaves must be a single digit & are typically the last digit of each data point
Graph is then made by writing each distinct stem & placing all the corresponding leaves next to them
can tell shape by looking at it turned on its side
should ALWAYS INCLUDE a key to help the reader understand the data
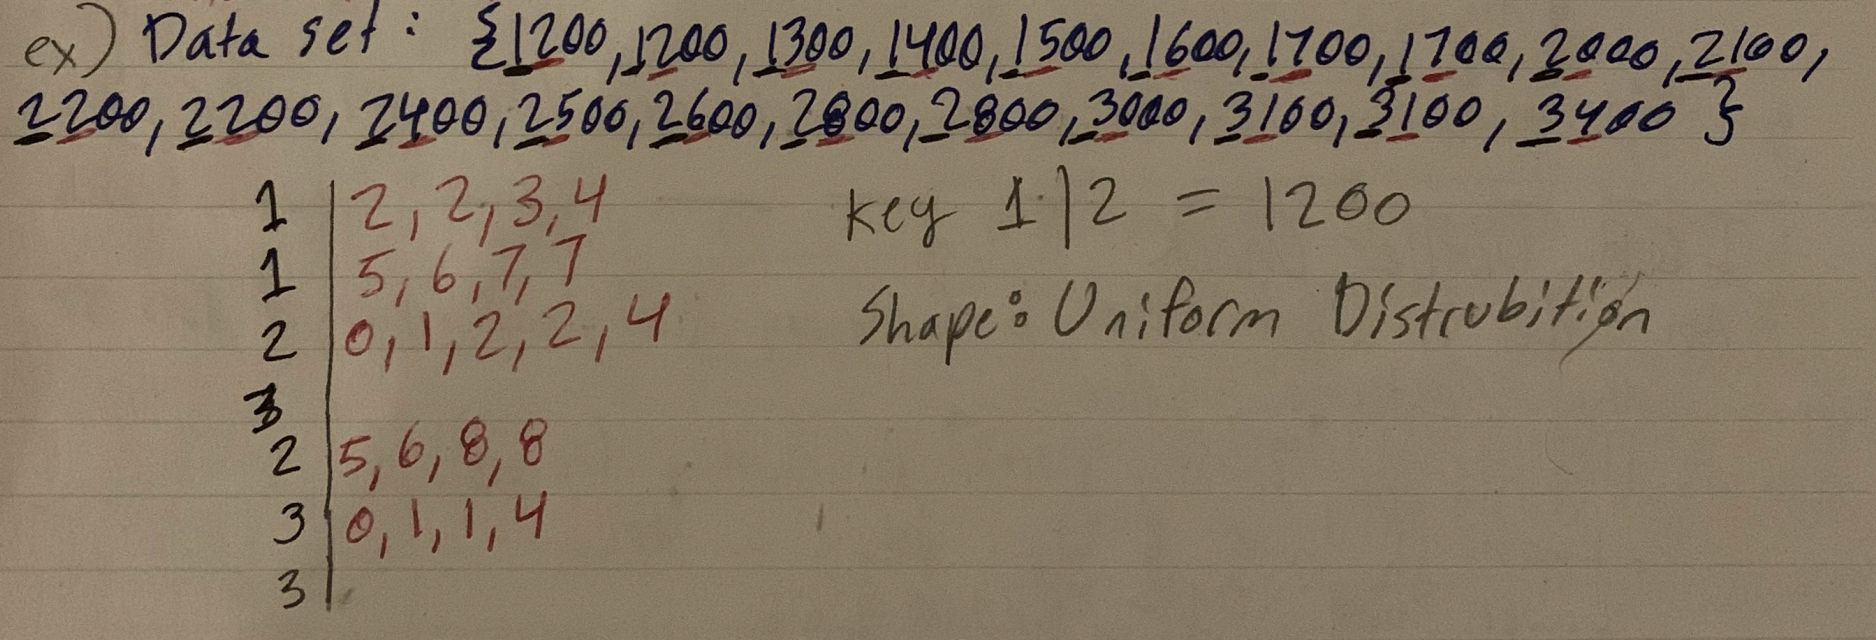
Example of a Stemplot
Data set {17, 23, 36, 43, 44, 44, 48, 52, 54, 58, 58, 59 }
Key: 1 | 7
1 | 7
2 | 3
3 | 6
4 | 3, 4, 4, 8
5 | 2, 4, 8, 8, 9
Shape: Left-Skewed
Split Stemplot
where each stem is written twice
The first stem gets the leaves 0 through 4
The second stem gets leaves 5 through 9
*Should be used whenever we have 3 or less distinct stem
Interquartile Range/IQR
an outlier is a data that is far away from the general pattern of data set
“extreme value“
2 ways of checking for these:
Construct a Lower & Upper bound
L Bound= Q1 - (1.5) x IQR
R Bound= Q3 + (1.5) x IQR
Any data pts lower than L bound of higher than R bound = outliers
Is possible to have no outliers
Box plot
visual display of 5 number summary
Construct a horizontal axis
Draw a box that start at Q1 & ends at Q3. Inside the bow we draw a line @the median/M
Extend the lines from the box to minimum & maximum values
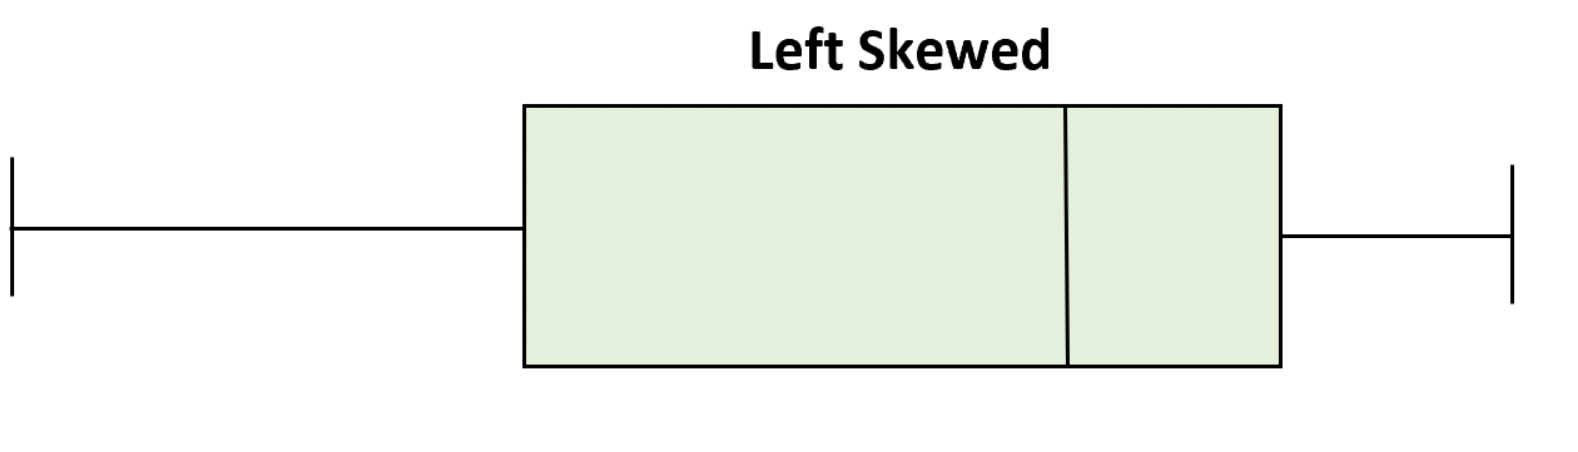
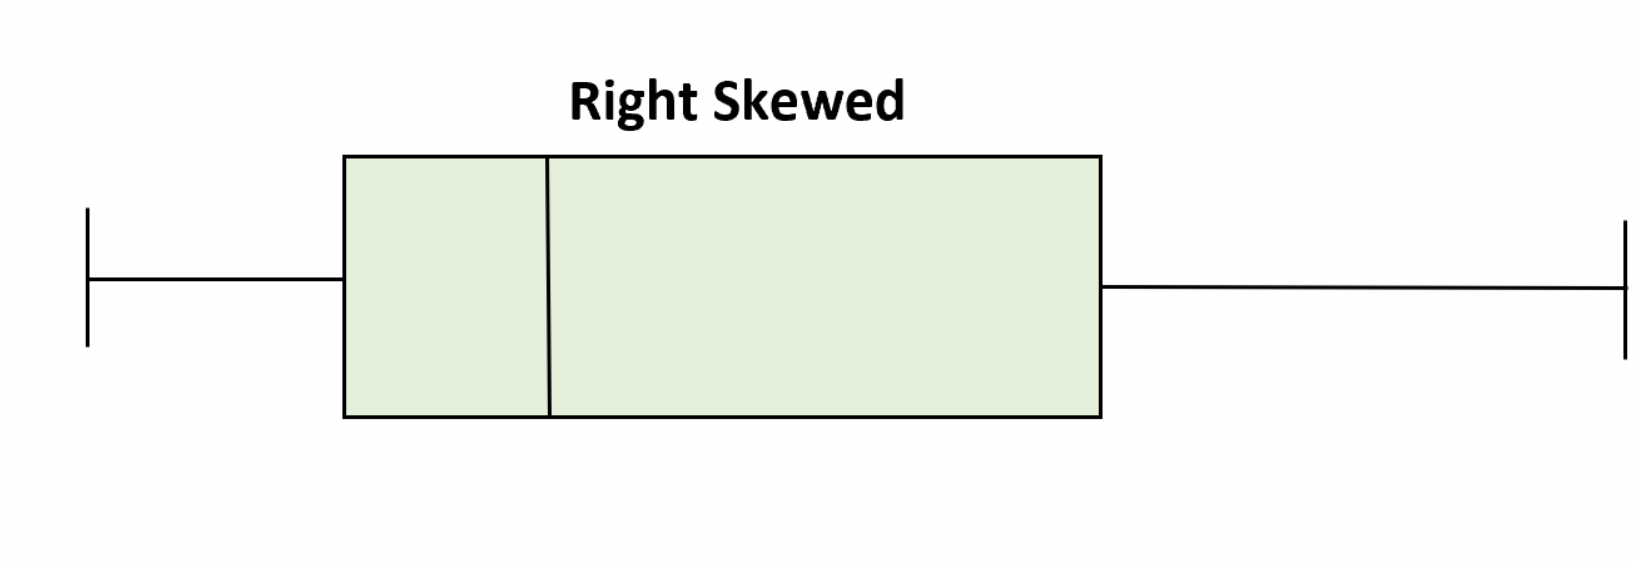
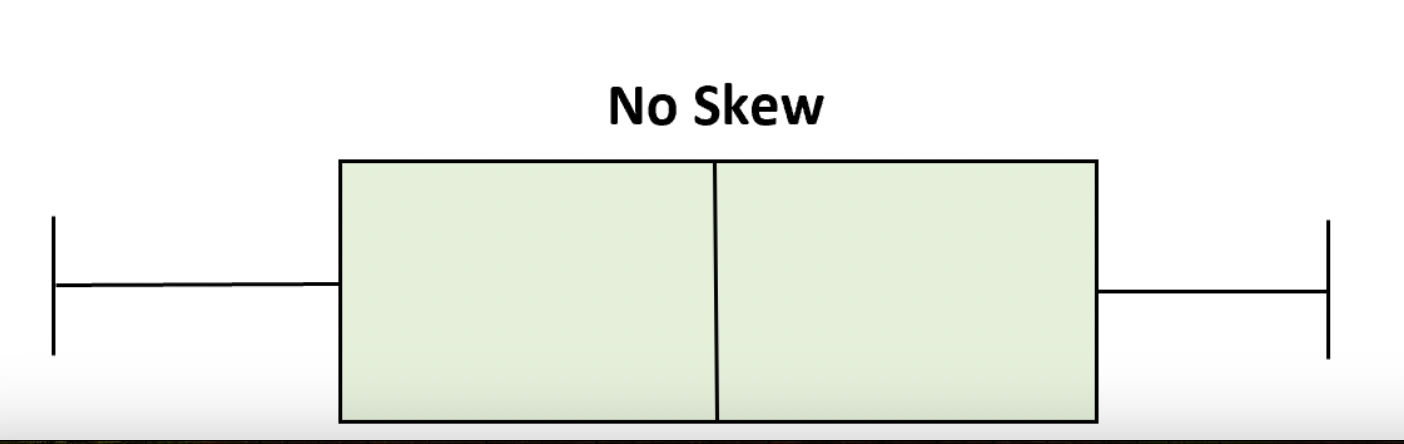
ONLY THE BOX is considered when determining SHAPE
Minimum & Maximum lines are called whiskers & not considered
Can only see shapes: left, right, & symmetric
What shape is this
Left Skewed Box plot
Right Skewed Box plot
Symmetric