1B.1-2-3-4
1/28
There's no tags or description
Looks like no tags are added yet.
Name | Mastery | Learn | Test | Matching | Spaced | Call with Kai |
|---|
No analytics yet
Send a link to your students to track their progress
29 Terms
What numerical range does probability lie in and what do the limits represent?
Between 0 and 1; 0 means the event never occurs, 1 means the event is certain to occur.
Name the two main rules for combining probabilities of events.
The addition rule (“OR”) and the multiplication rule (“AND”).
State the addition rule for two non-mutually exclusive events A and B i.e. that at least one event will occur out of 2 or more possible events.
P(A or B) = P(A) + P(B) – P(A and B)
What is the simplified addition rule when events A and B are mutually exclusive?
P(A or B) = P(A) + P(B) because P(A and B) = 0.
Give an alternative way to express the addition rule using the probability of neither event occurring.
P(A or B) = 1 – P(neither A nor B).
State the general multiplication rule for two events A and B i.e. the probability of the of the joint occurrence of two or more events.
P(A and B) = P(A) × P(B|A).
What does P(B|A) mean?
Conditional probability: the probability that event B will occur given that event A has already occurred
How is the multiplication rule simplified for independent events?
For independent events, P(B|A) = P(B), so P(A and B) = P(A) × P(B).
In probability notation, how is “the probability of B given A” written and pronounced?
Written as P(B|A) and pronounced “P of B given A.”
Describe the subjective approach to defining probability and provide an example.
Probability is a personal degree of belief, such as a doctor’s judgement about a treatment’s success; foundation of Bayesian statistics.
Describe the frequentist approach to defining probability.
Proportion of times an event would occur in a large number of similar repeated trials, e.g. number of ‘heads’ in coin tossed 100 times.
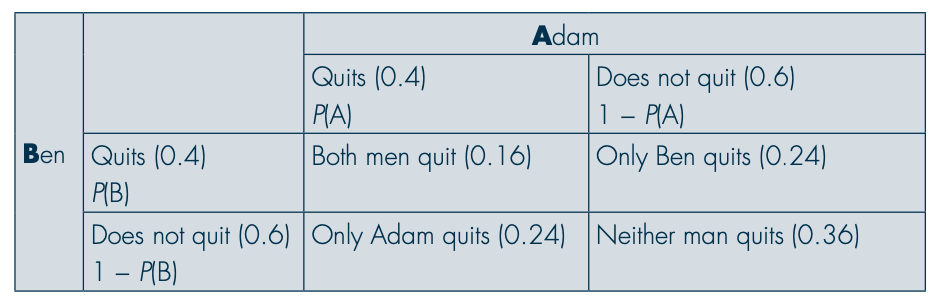
A smoking cessation programme has a probability of 0.4 that any individual completing the programme will quit smoking. If two random individuals (Adam and Ben) who never meet complete the programme, what is the probability that
At least one of them quits smoking
0.64 (1 – 0.36 or 0.4 + 0.4 − 0.16)
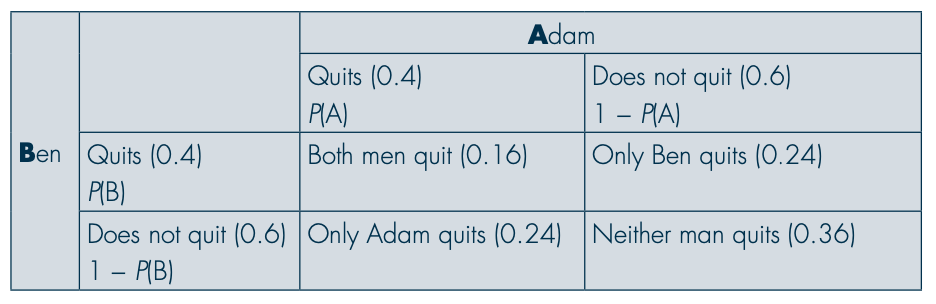
A smoking cessation programme has a probability of 0.4 that any individual completing the programme will quit smoking. If two random individuals (Adam and Ben) who never meet complete the programme, what is the probability that
Both of them quit smoking
As Adam and Ben never meet, the probability of both of them quitting smoking are independent events;
therefore, it can be calculated as
P(A and B) = P(A) × P(B) = 0.16
What is sampling error and how is it generally affected by sample size?
Sampling error is the uncertainty from observing a sample instead of the whole population; it decreases as sample size increases.
Define standard error (se).
The standard deviation of the sampling distribution of a statistic; it measures how precisely the sample statistic estimates the population parameter.
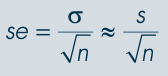
Give the formula for the standard error of a sample mean when the population standard deviation is unknown.
se ≈ s / √n, where s is the sample standard deviation and n is the sample size.
Why are standard errors important in statistical inference?
They underpin the calculation of confidence intervals and hypothesis tests.
Provide the general formula for a 95% confidence interval (CI).
95% CI = Sample statistic ± 1.96 × se.
How is the formula modified to calculate a 99% confidence interval?
99% CI = Sample statistic ± 2.58 × se.
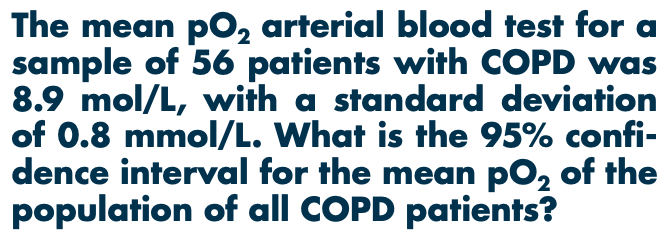
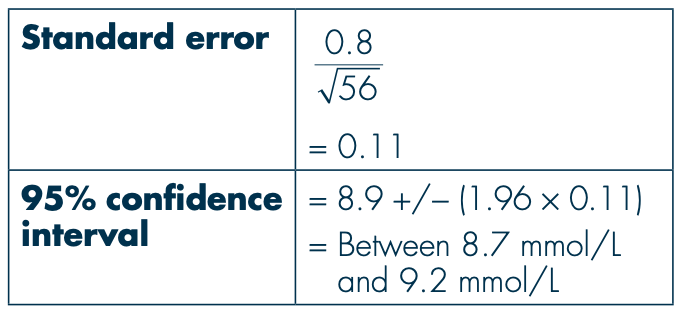
The mean pO2 arterial blood test for a sample of 56 patients with COPD was 8.9 mol/L, with a standard deviation of 0.8 mmol/L. What is the 95% confi- dence interval for the mean pO2 of the population of all COPD patients?
se ≈ s / √n, where s is the sample standard deviation and n is the sample size
95%CI = Sample statistic ± (1.96 × se)

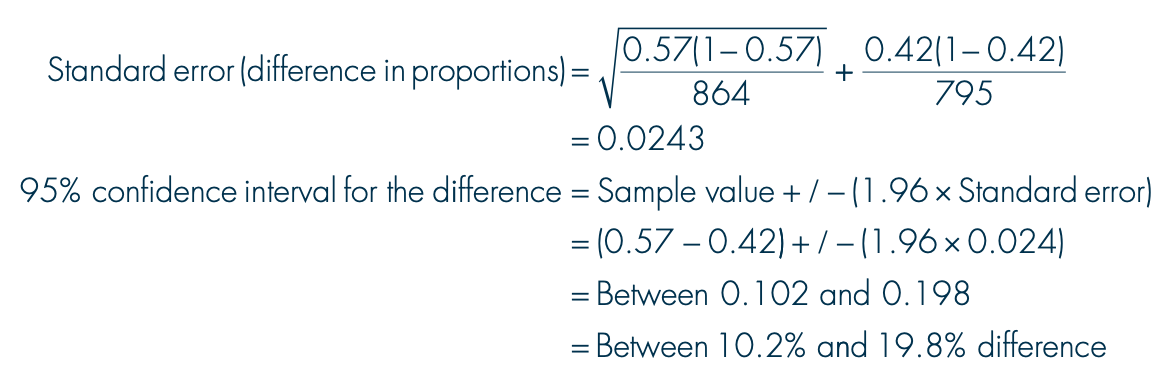
57% of the 864 patients at a stop-smoking clinic had quit smoking by the end of the programme, compared with 42% of 795 patients at a neighbouring clinic. What was the difference in quit rates between the two clinics?
se ≈ s / √n, where s is the sample standard deviation and n is the sample size
95%CI = Sample statistic ± (1.96 × se)
What is a confidence interval?
A range of values indicating the precision with which the sample estimate is likely to represent the population from which the sample was drawn.
Interpret a 95% confidence interval in plain language.
We expect the interval to contain the true population value in 95 out of infinite similar, unbiased samples.
When does a 95% confidence interval for an absolute risk difference indicate no evidence of a true difference?
When the interval includes zero.
When does a 95% confidence interval for a relative risk measure indicate no evidence of a true difference?
When the interval includes one.
What conclusion is drawn when two 95% confidence intervals do not overlap?
There is strong evidence of a significant difference at the 5% level.
What does independence of events mean in epidemiology, and what term is used when events are not independent?
Independence means one event does not affect the probability of the other; if not independent, the events are said to be associated.
One can estimate the likelihood that two events are associated by calculating…?
Measures of effect.
The p-values and confidence intervals can then be calculated to give an indication of…
How likely it is that any observed association in a study is due to chance.