2021 CTS Assessment Group 1
1/9
There's no tags or description
Looks like no tags are added yet.
Name | Mastery | Learn | Test | Matching | Spaced | Call with Kai |
|---|
No analytics yet
Send a link to your students to track their progress
10 Terms
Question Pre-amle
R Code Appendix
What kind of learning problem is this? Clearly motivate your response.
This is a supervised learning problem of the classification kind:
We have both predictors and a target response, of which the target response is dichotmous
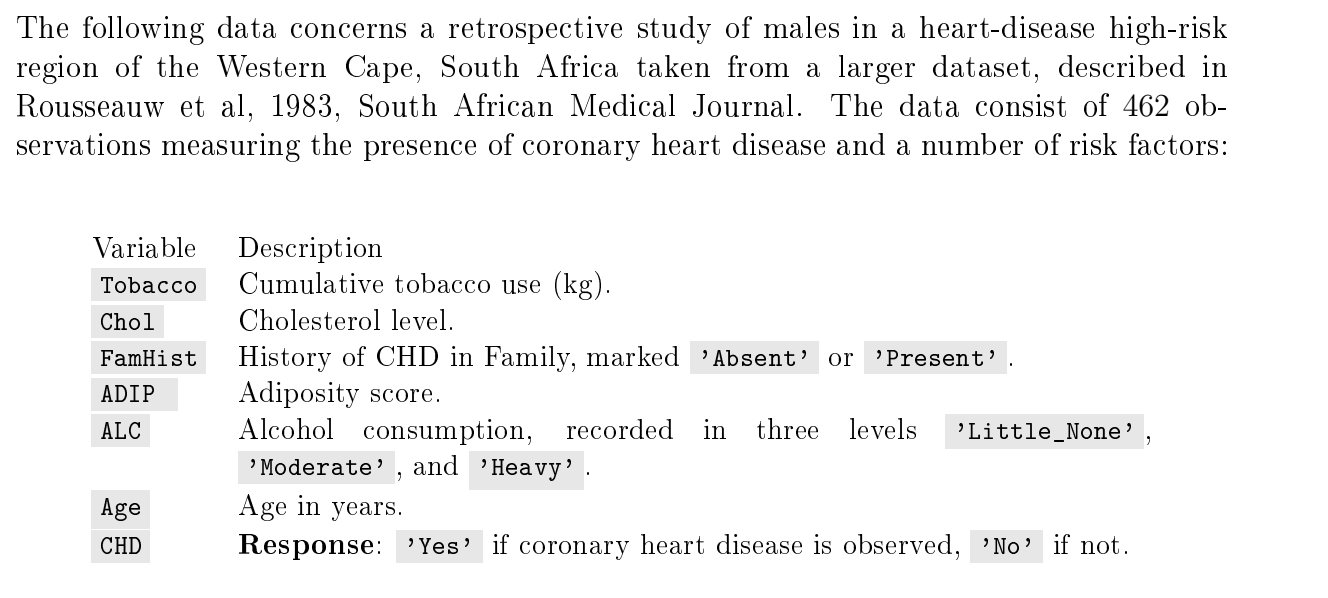
Explain what this section of the code is doing and interpret the output.
Here, we are calculating are calculating the empirical frequencies/ probabilities of their response conditional on the states of the predictors FamHist, ALC for purposes of exploratory Data Analysis.
Based on these frequencies, initial indications are that individuals with a. family history are more likely to present with CHD
The likelihood of observing CHD is lower in individuals with little to no alcohol use as compared to moderate or heavy use, with no clear difference between individuals with moderate or heavy use
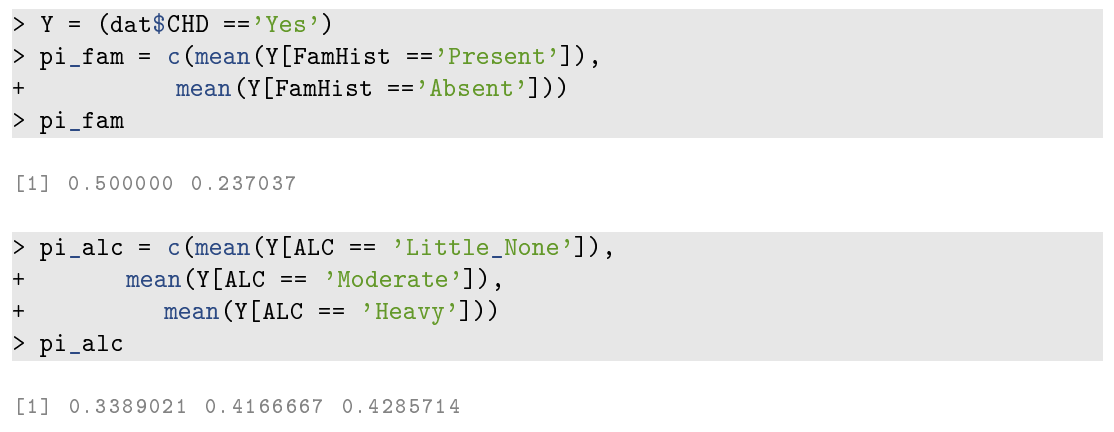
Consider now modelling the data using a tree-based model as in Appendix A. [1] Give an expression for an appropriate penalised objective function to be used under a tree-based model in this case.
Where πj is the empirical frequency of the response in region j, and the tree partitions of the feature space into R regions. Misclassification rate or Gini Index is also fine for the objective part.
![<p>Use the validation plot in Figure 1 to determine the appropriate amount of [2] pruning to apply to the unconstrained tree: Give the value for the complexity parameter to be passed to the pruning function, clearly motivating your response.</p>](https://knowt-user-attachments.s3.amazonaws.com/4cded2a5-9ce5-43e4-b067-a128c627518c.png)
Use the validation plot in Figure 1 to determine the appropriate amount of [2] pruning to apply to the unconstrained tree: Give the value for the complexity parameter to be passed to the pruning function, clearly motivating your response.
Ideal response is a tree of size 3, and thus cp = 0.079. The reason here is that the error bars indicate large variation relative to the shape of the curve. This means there is quite a bit of uncertainty about the estimate of the validation error. As such we must be conservative in our application of regularisation.
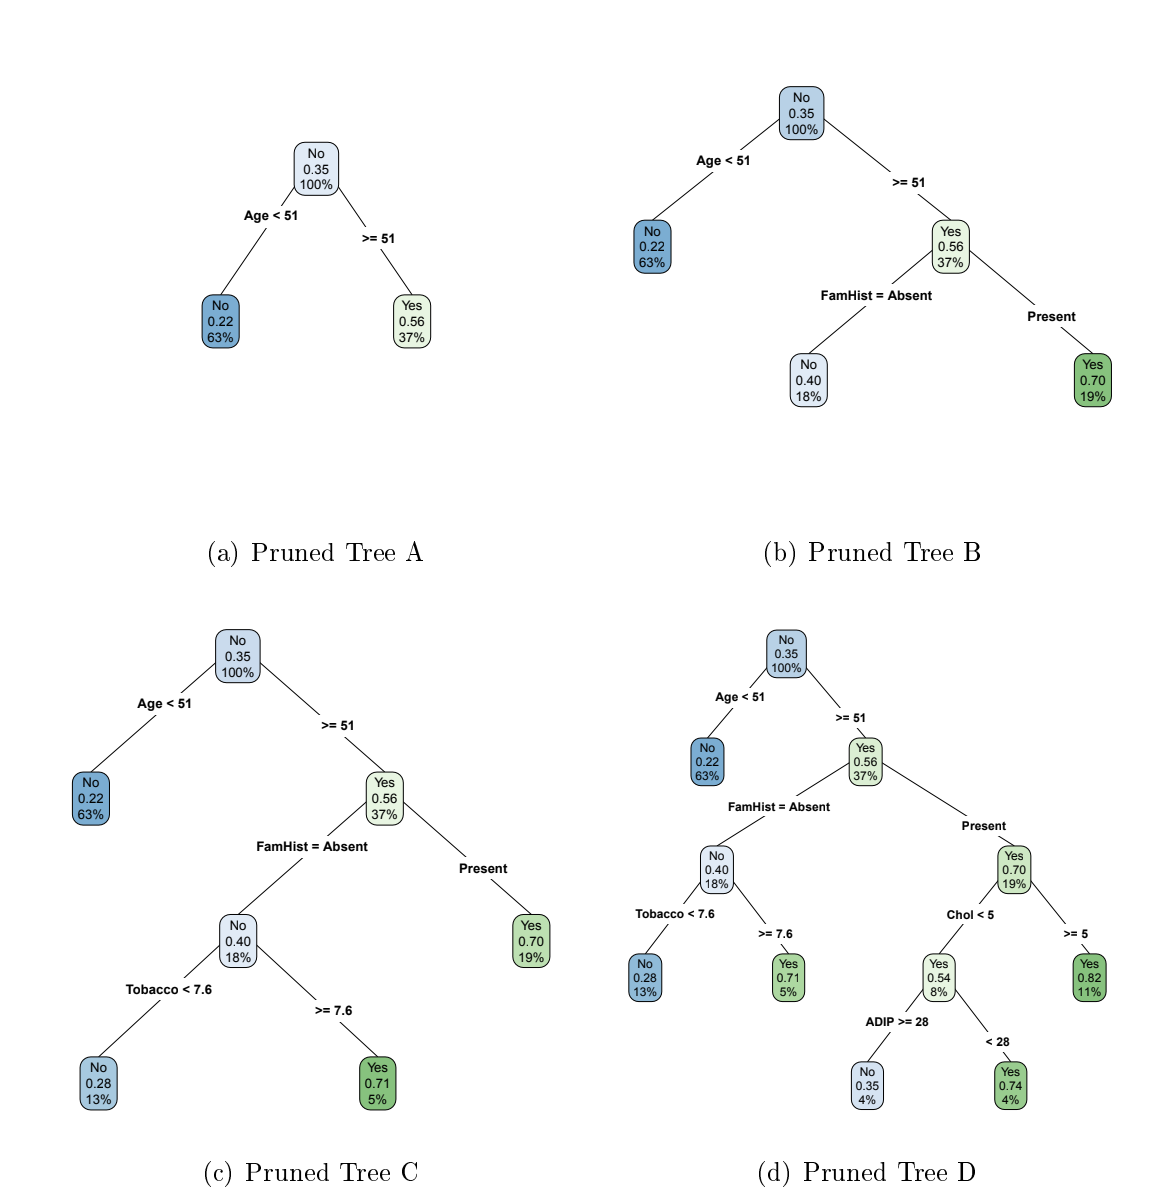
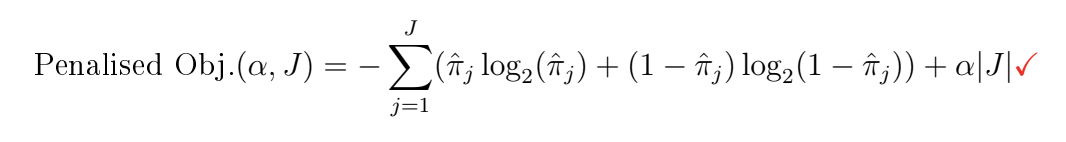
Figure 2 gives four trees corresponding to particular values of complexity pruning. Clearly indicate which is the appropriate tree model (based on your analysis in the preceding question), writing down either A, B, C, or D, and then interpret the tree plot.
A - a tree of size 2: Under this tree model the only relevant predictor is that of age, with older individuals (the split point being age 51) being predicted to have a higher likelihood of presenting CHD (.56). No other variables appear to be predictive.
B - a tree of size 3 (ideal): under this tree model the only relevant predictors are that of age and family history of CHD, with older individuals (split point at age 51) being predicted to have a higher likelihood of presenting CHD (56% prob.), albeit with a notably higher likelihood of presenting with CHD for individuals with a fmaily history of CHD (70%) vs those with no family history (40%). N other variables appear to be predictive.
C - a tree of size 3/4: under this tree model the only relevant predictors are that of age and family history of CHD, with older individuals (split at age 51) being predicted to have a higher likelihood of presenting CHD (56%), albeit with a notably higher likelihood of presenting with CHD for individuals with a family history of CHD (70%) vs those with no family history (40%). Interestingly, amongst individuals with no family history of CHD, tobacco use (>7,6kg) is associated with significantly increased likelihood of CHD (70% vs 285; Formaer on par with individuals who have a family history of CHD. No other variables appear to be predictive.
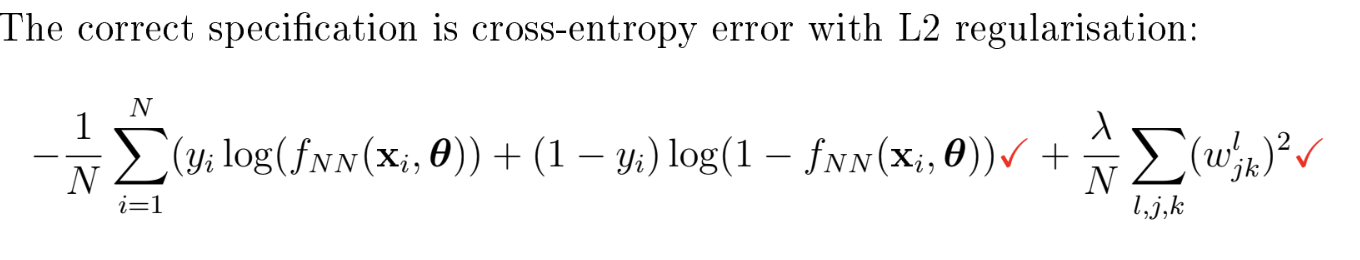
Give a general expression for the penalised objective function which would apply under a neural network model fitted to the present data. Clearly identify all elements in the expression and motivate your choice of objective function. Use the penalty term specifation implied by the code used to t the neural network in Appendix A. (Just the specifation, you don't have to assign values to the parameters.)
where:
Yi denotes the ith response, Fnn(xi,θ) is the prediction from the network.
wljk is the jkth weight in layer l,
λ is the regularisation parameter.
For purposes of the analysis, you t a 5-network to the data using a regularisation hyperparameter of 0.021. Explain how you would have determined that this is the correct level of regularisation to apply.
First split the data into a training and validation set.
Then we would create an increasing sequence of values to assign to the regularisation parameter and then fit the neural network for each level of regularisation.
We then record the validation error at each level and choose the regularisation level as being at the minimum or ideally more conservative slightly larger than at the minimum as the appropriate level.
![<p>Figure 3 gives a response curve over age and family history for individuals with [3]</p><p>a cumulative tobacco use of 0kg and 5kg, respectively. Interpret the response</p><p>curves under the fitted model.</p>](https://knowt-user-attachments.s3.amazonaws.com/c6ff04d2-6370-4d2c-87b4-c1353453dfe2.png)
Figure 3 gives a response curve over age and family history for individuals with [3]
a cumulative tobacco use of 0kg and 5kg, respectively. Interpret the response
curves under the fitted model.
The response curves indicate that the predicted probability of CHD increases with age regardless of family history or tobacco use.
However, for individuals with a family history of CHD, a marked increase in the likelihood of CHD is predicted over all age ranges.
This is further compounded by Tobacco use although an increase in likelihood of CHD is similarly observed for individuals with no history of CHD.
The differential effect for family history appears to be larger than for Tobacco use at this level of tobacco use.
Explain how you would construct the response curves in Figure 3.
We need to crate four dummy predictor, data matrices: First we create a regularly spaced sequence along the observed age range
Then we fix on the states of the family history variable, present and absent, and for each of those fix on a Tobacco level of 0 and 5.
Subsequently, we predict the response under the regularised neural network and plot the response curves on the same figure.