International Marketing Session 6
1/15
There's no tags or description
Looks like no tags are added yet.
Name | Mastery | Learn | Test | Matching | Spaced |
|---|
No study sessions yet.
16 Terms
What is International Marketing Research?
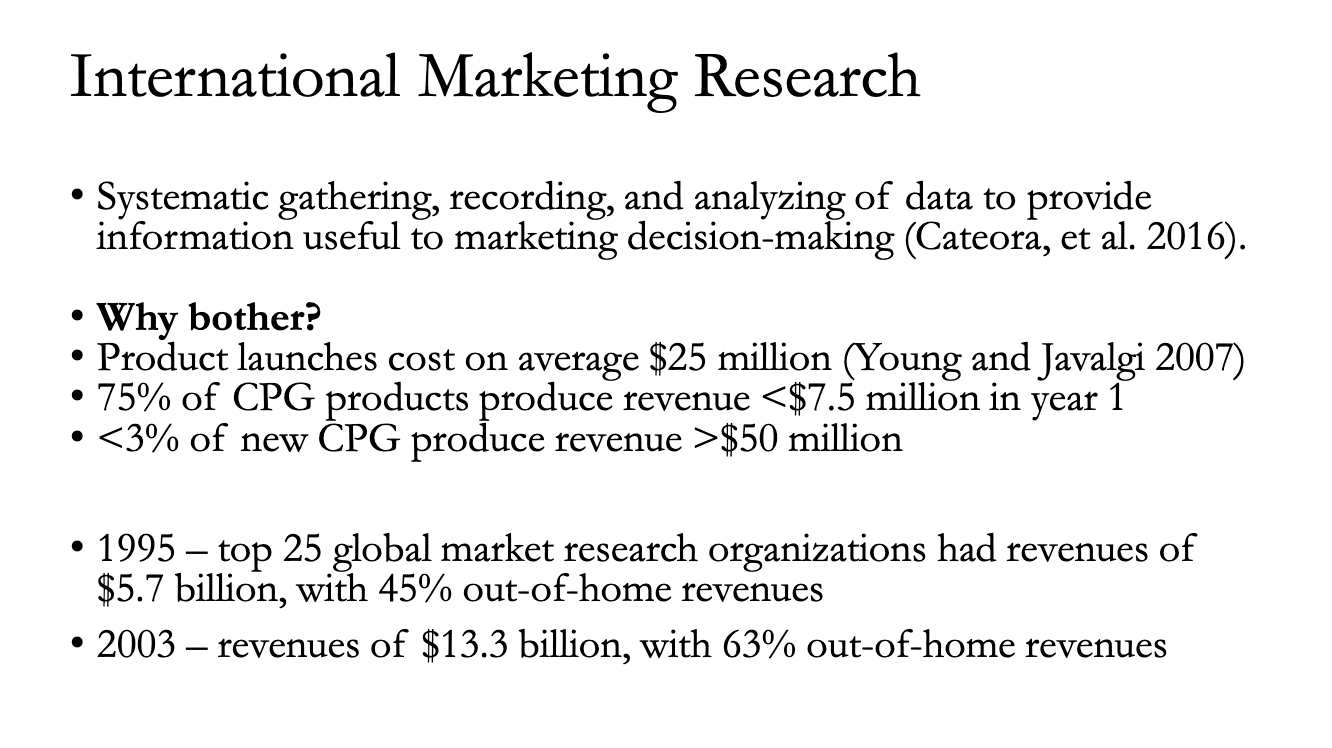
It is the organized process of gathering and analyzing data to help managers make better decisions.
Why bother? (The Financial Risk): Launching a new product is incredibly expensive (avg. $25 million).
The Failure Rate: It is risky. 75% of new consumer products earn less than $7.5 million in their first year. Less than 3% become huge hits (earning >$50 million).
Research helps reduce this risk of failure.
The Process (6 Steps)
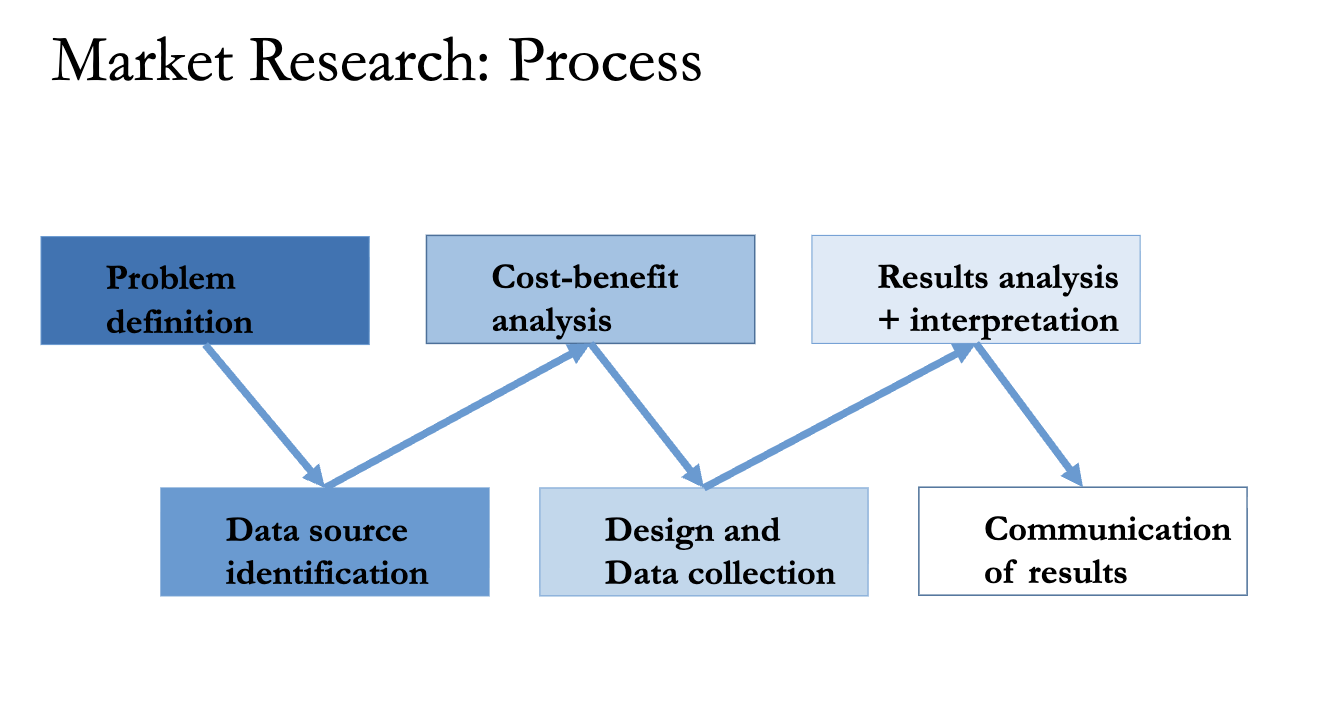
Slide 4 outlines the roadmap you must follow to do research correctly :
Problem Definition: What are we trying to figure out? (Most important step).
Cost-Benefit Analysis: Is the answer worth the money it costs to find it?
Data Source Identification: Where will we get the info?
Design & Collection: Creating the survey/experiment and getting answers.
Results Analysis: Crunching the numbers.
Communication: Explaining what it means to the boss.
Problem Definition
The 4 Types of Research Problems You can categorize almost any business question into one of these four buckets :
Explore
Describe
Forecast
Establish Casuality
1) Explore :
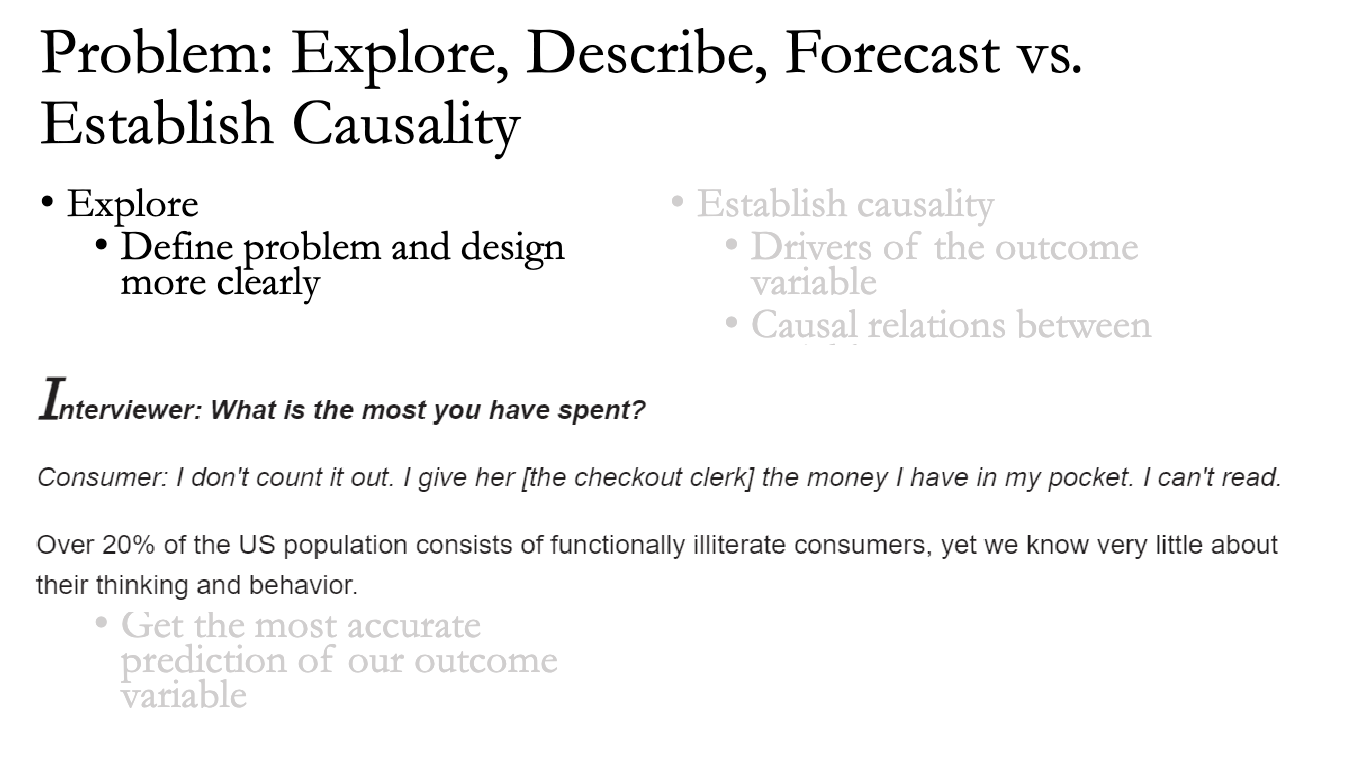
Explore: "We don't know what we don't know." Used to define a fuzzy problem more clearly.
2) Describe:
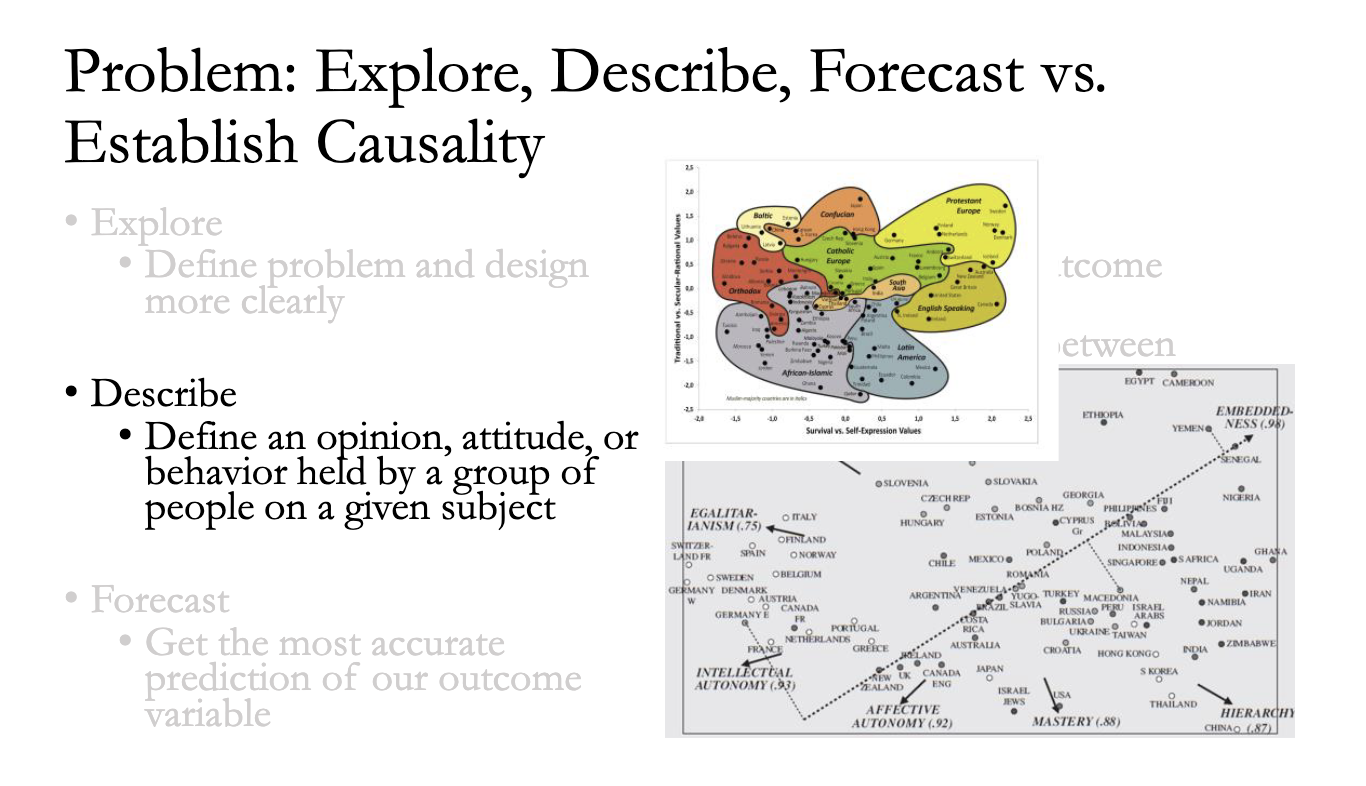
Describe: "What is happening?" Used to take a snapshot of opinions or behaviors (e.g., "30% of people like blue").
3) Forecast:
Forecast: "What will happen?" Predicting the future numbers (e.g., "What will tourism demand be in 2025?").
4) Establish Casuality:
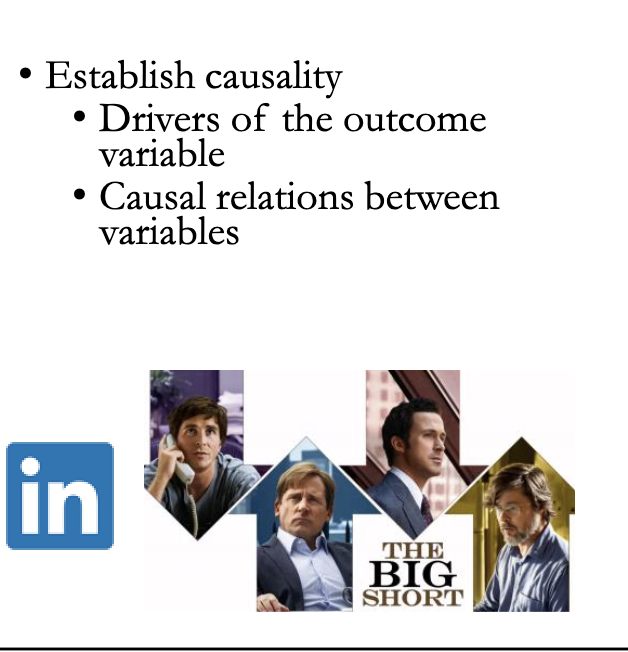
Establish Causality: "Why did it happen?" Proving that X causes Y.
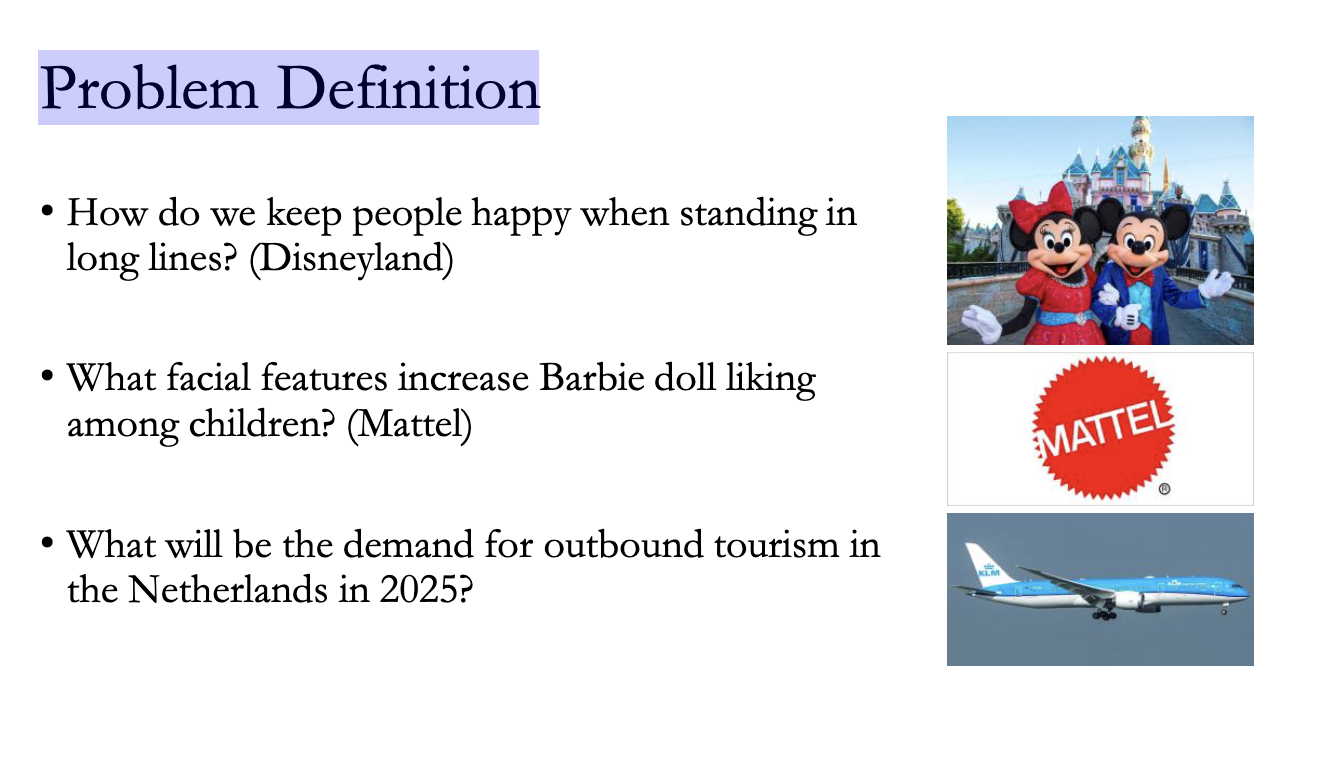
Example: "What specific facial features cause children to like a Barbie doll?" (Mattel) .
Example: "How do we cause people to stay happy in long lines?" (Disneyland) .
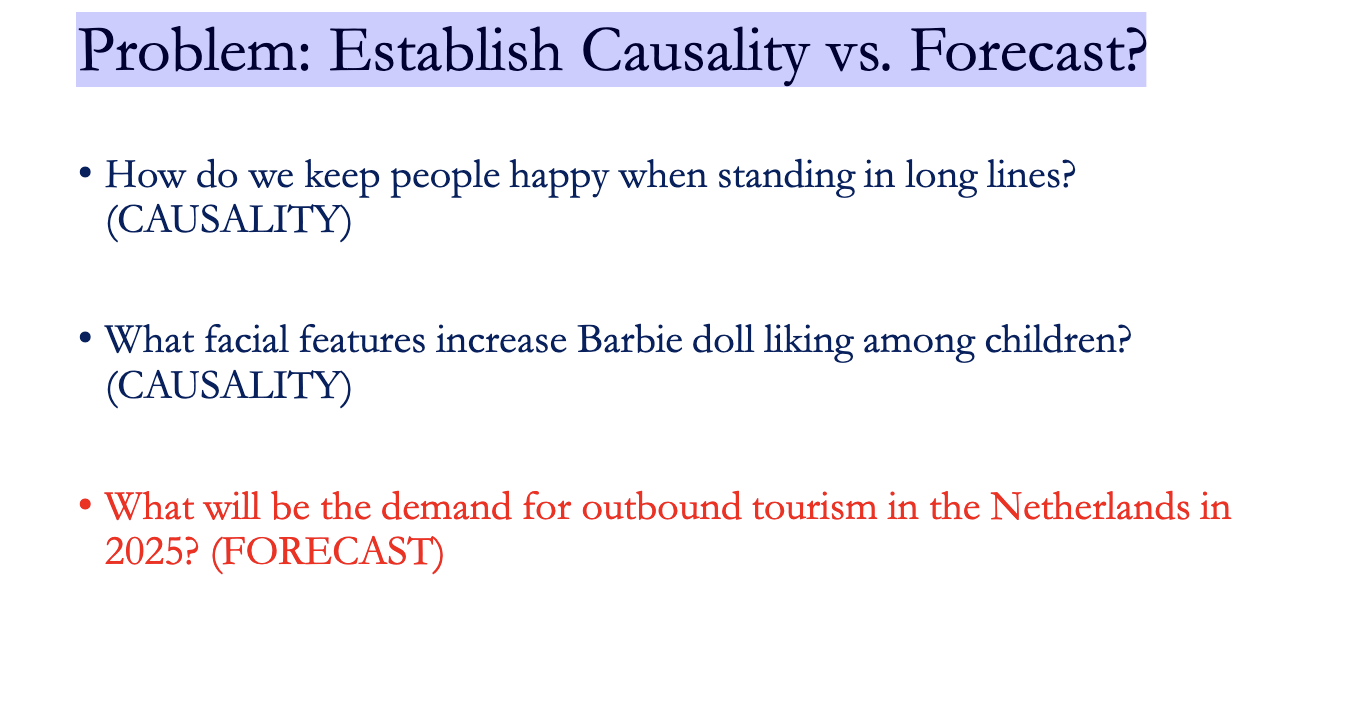
Problem: Establish Causality vs. Forecast?
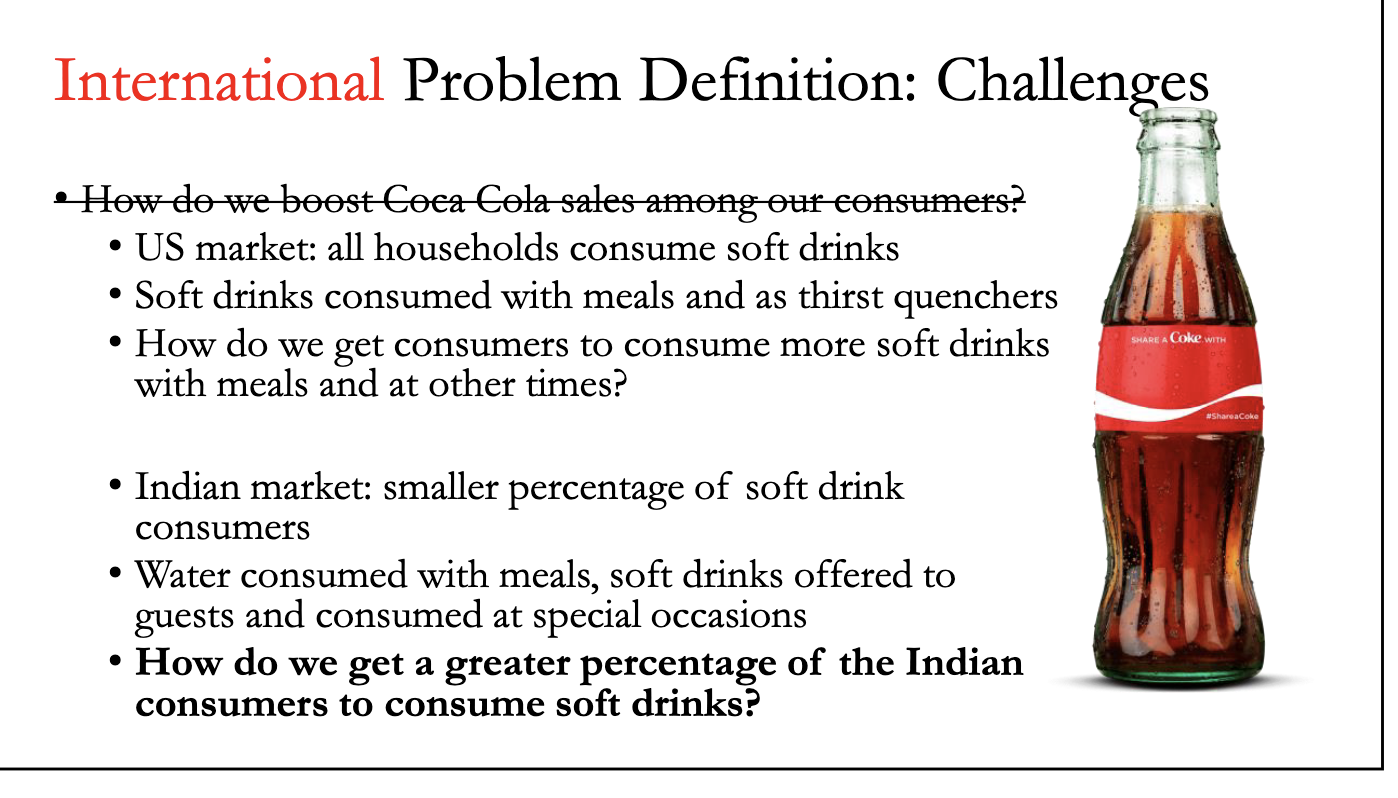
The International Challenge (The Coca-Cola Case) Slide 10 shows why you can't just copy-paste your research question to a new country.
US Market: Everyone drinks soft drinks with meals. The goal is just "drink more."
Indian Market: People drink water with meals and save soft drinks for special guests.
The Trap: If you ask Indian consumers, "How do we get you to drink Coke with dinner?", it fails because that behavior doesn't exist culturally. You have to change the question to fit their reality.
The "Trust" Problem (Cross-Cultural Equivalence)
The problem of Equivalence.
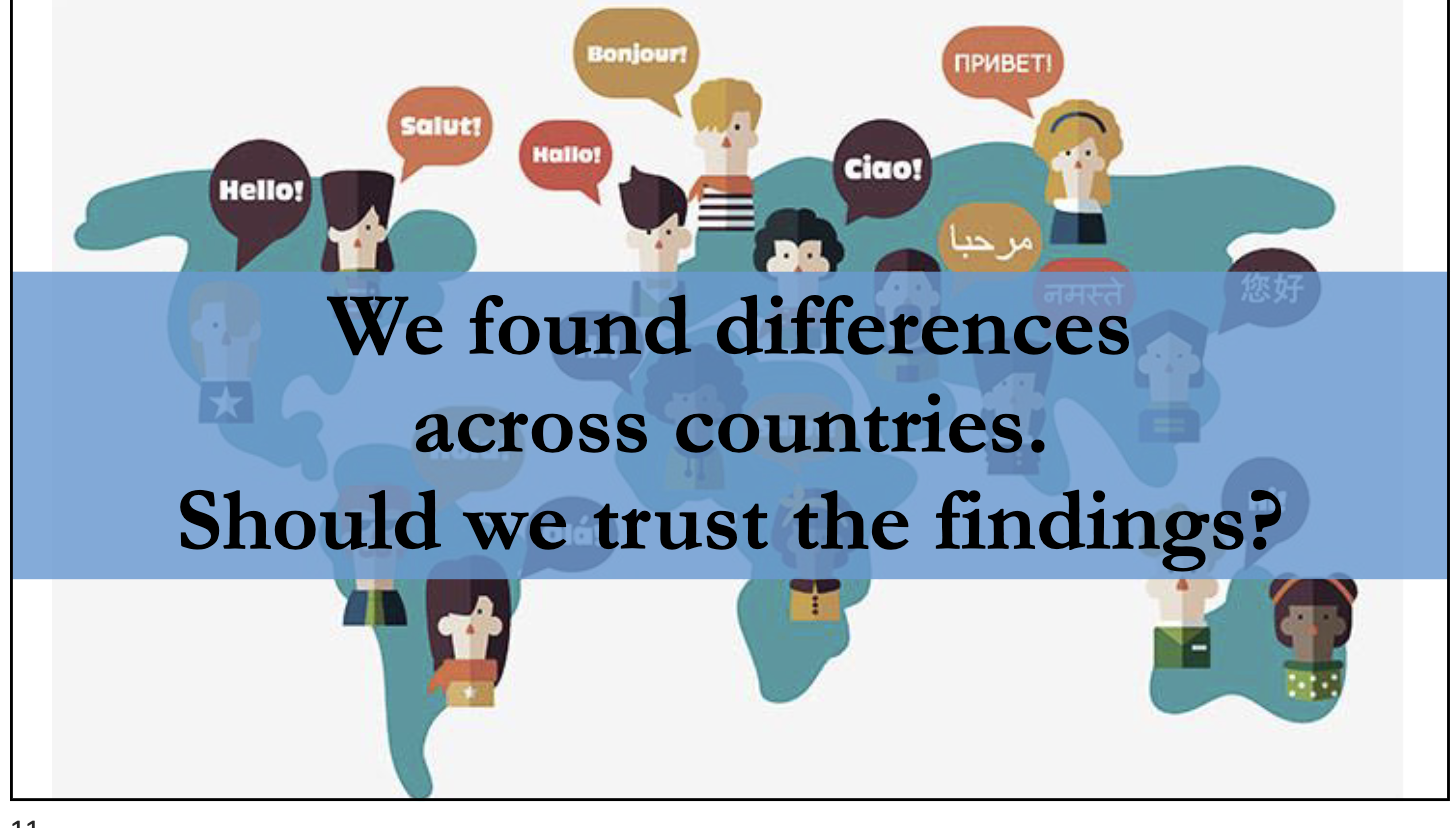
The Big Question If you run a survey in Brazil and the UK, and the results are different, is it because the people are different, or because the questions meant something different to them? This is the problem of Equivalence.
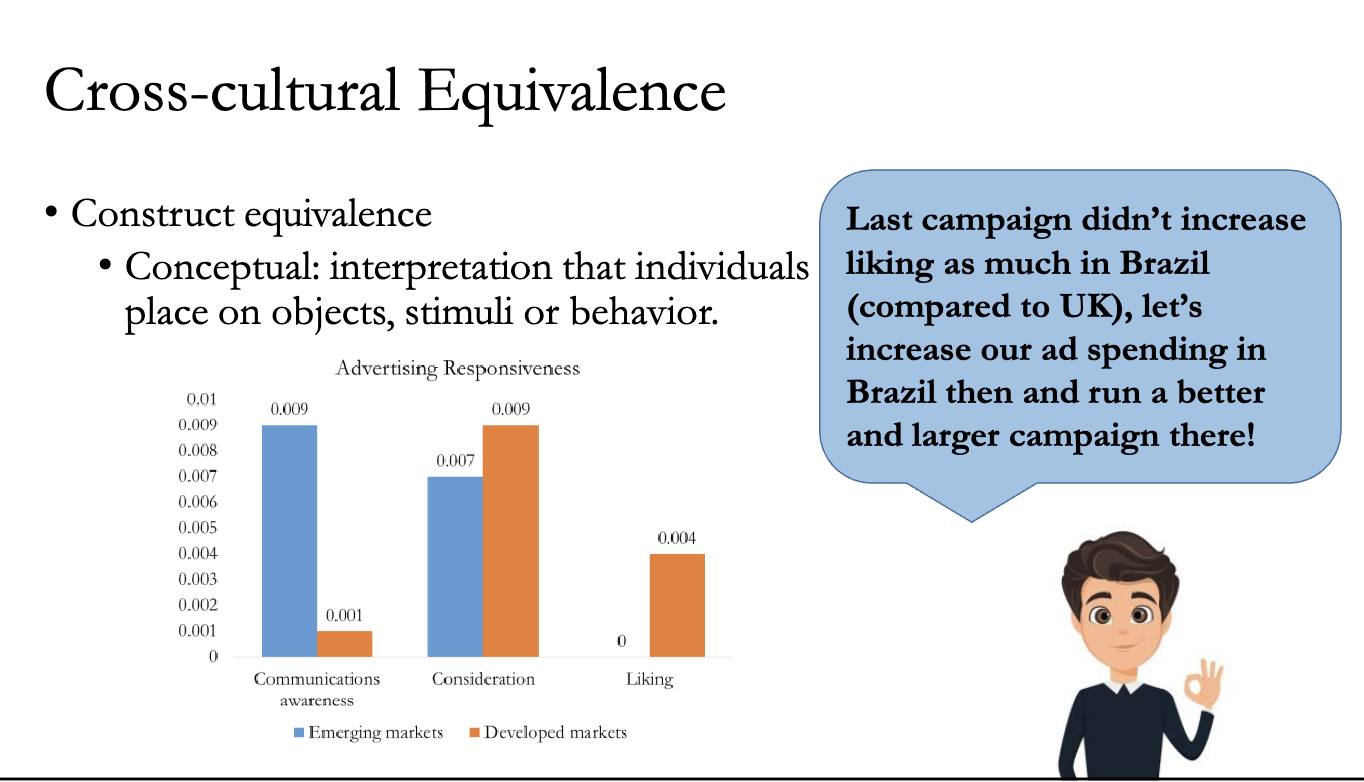
Construct Equivalence (Do we mean the same thing?) This ensures that the concept you are studying actually exists and means the same thing in both cultures. It has three layers :
1) Conceptual: Does the concept make sense here? (e.g., "Self-esteem" might be defined differently in Japan vs. the US).
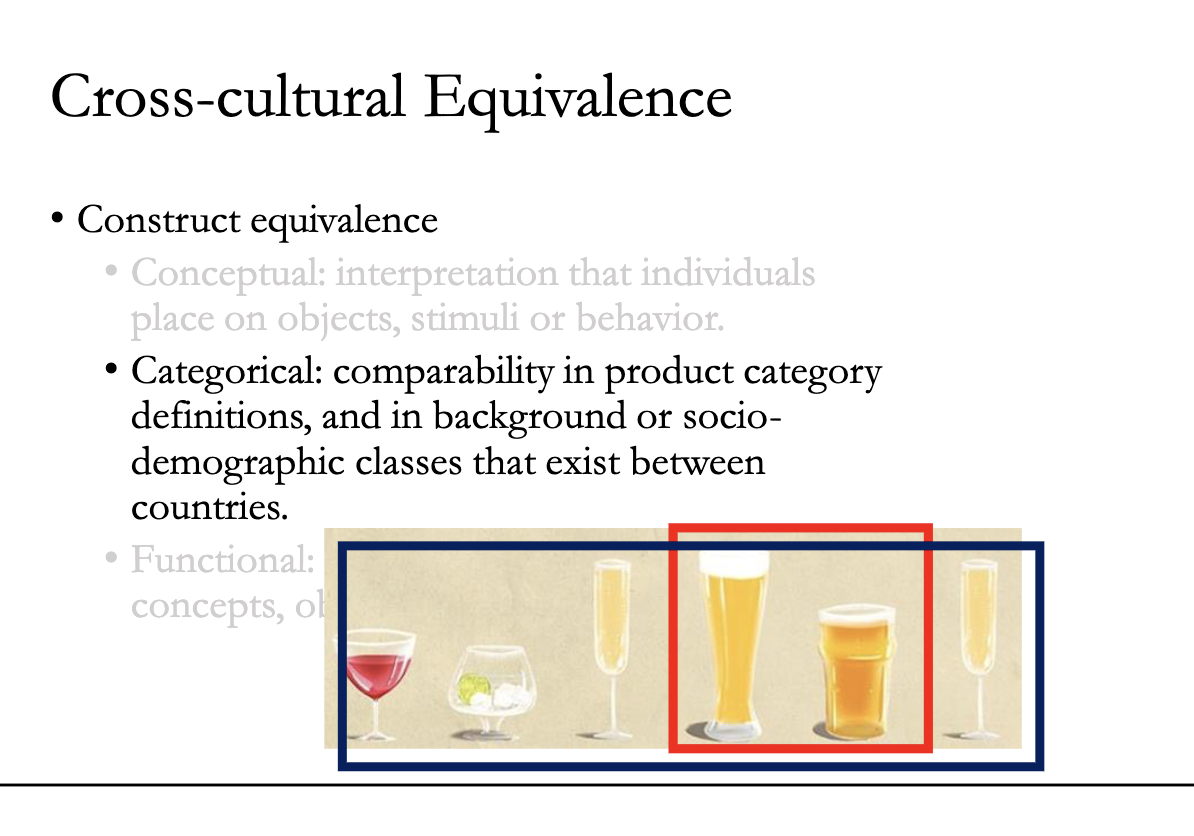
2) Categorical: Do we group things the same way?
Example (Slide 13): In some countries, Beer might be categorized as a "soft drink" or an everyday beverage, while in others it is strictly "alcohol." If you compare "Alcohol Sales," you might get wrong data if the categories don't match.
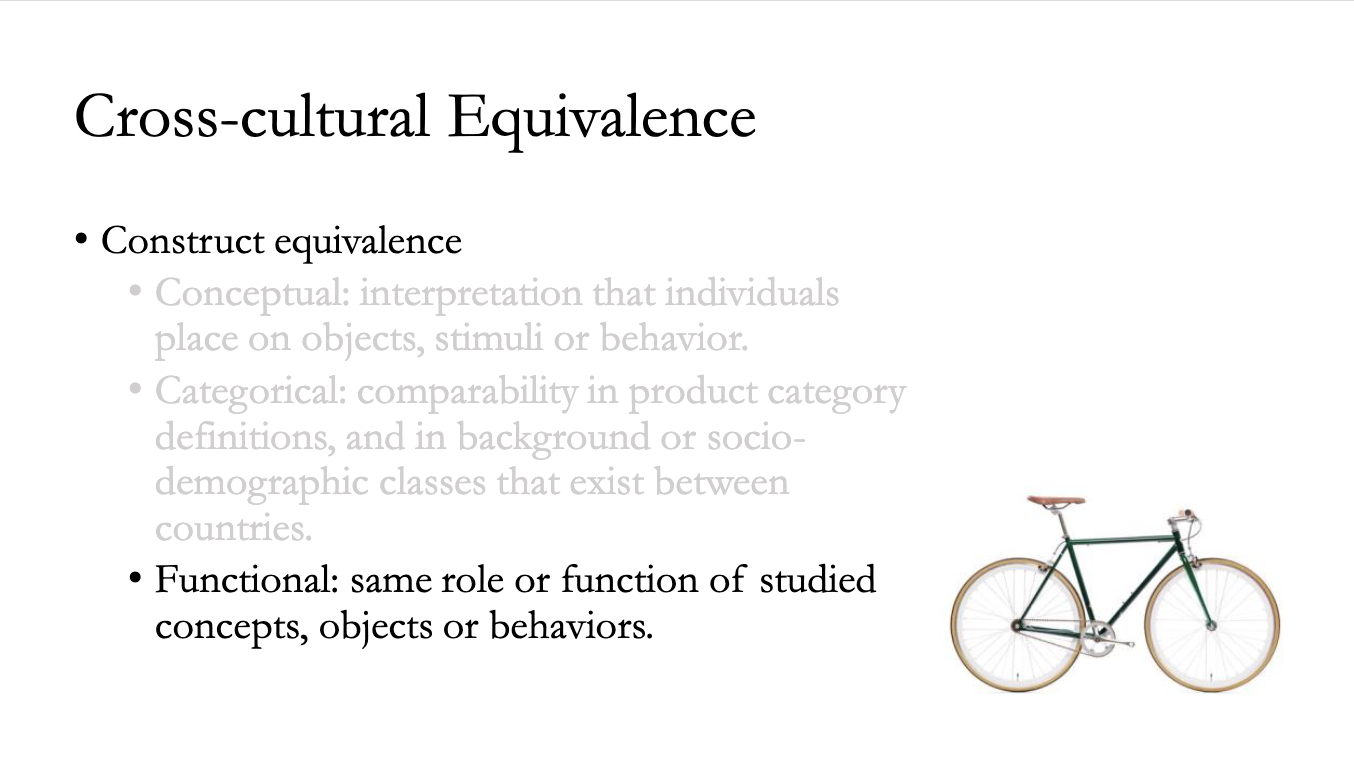
3) Functional: Does the item do the same job? (e.g., A bicycle is a recreational toy in the US, but a primary mode of transport in China)
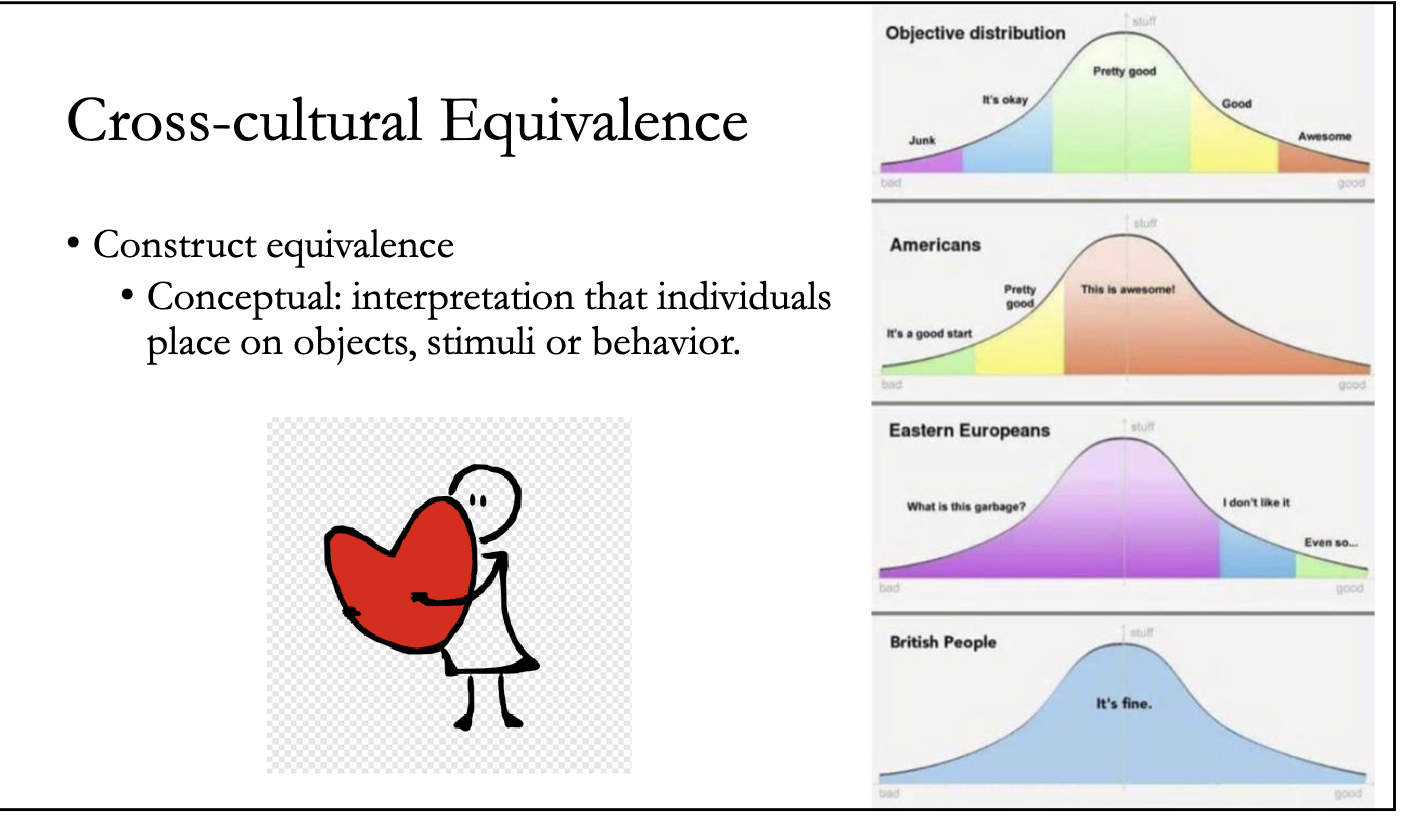
The Cultural Bias Example (Slide 14) This chart illustrates why you must be careful comparing ratings.
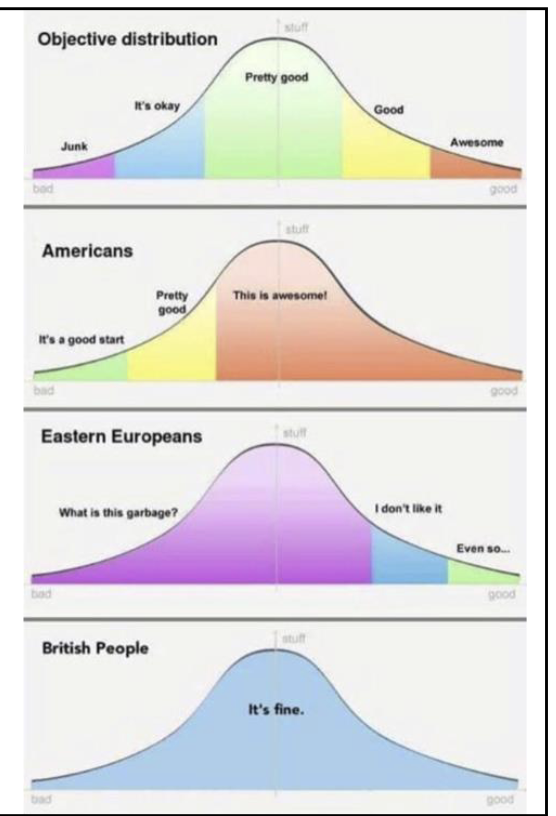
The Risk: If an American rates a product 5/5 and a British person rates it 3/5, they might actually like it the same amount, but their cultural way of expressing it differs.
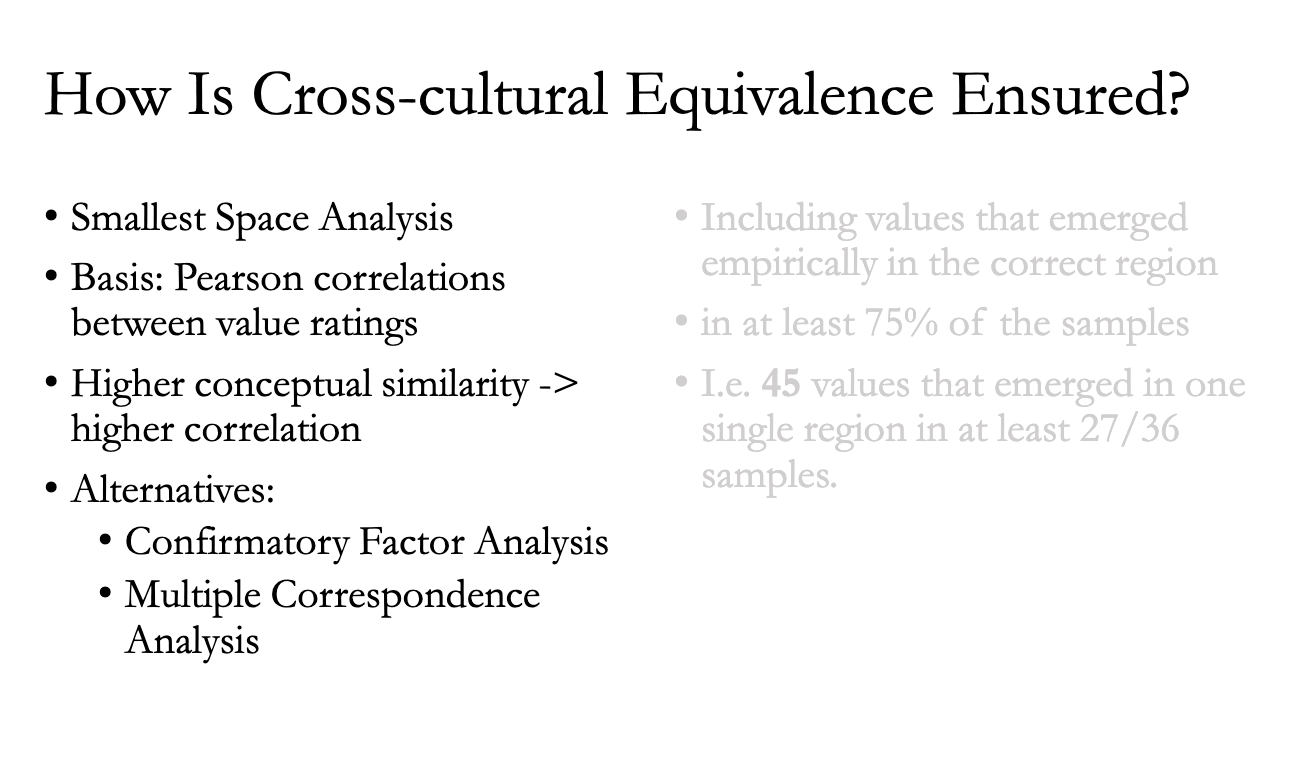
HOW TO ENSURE CONSTRUCT EQUIVALENCE?
The Tool (Schwartz’s Cultural Values)
The Goal: How do we know we are measuring the same thing?
(Page 8 / Slide 16)
The previous section defined the problem: "Construct Equivalence" (does the concept exist in both cultures?). This section answers the question: "How do we actually ensure it?"
The lecture uses Schwartz’s Cultural Values as a case study to show you the method.
The Tool (Schwartz’s Cultural Values)
(Page 9 / Slides 17–18)
1. What are we measuring? To test if a survey works across cultures, researchers used "Cultural Values."
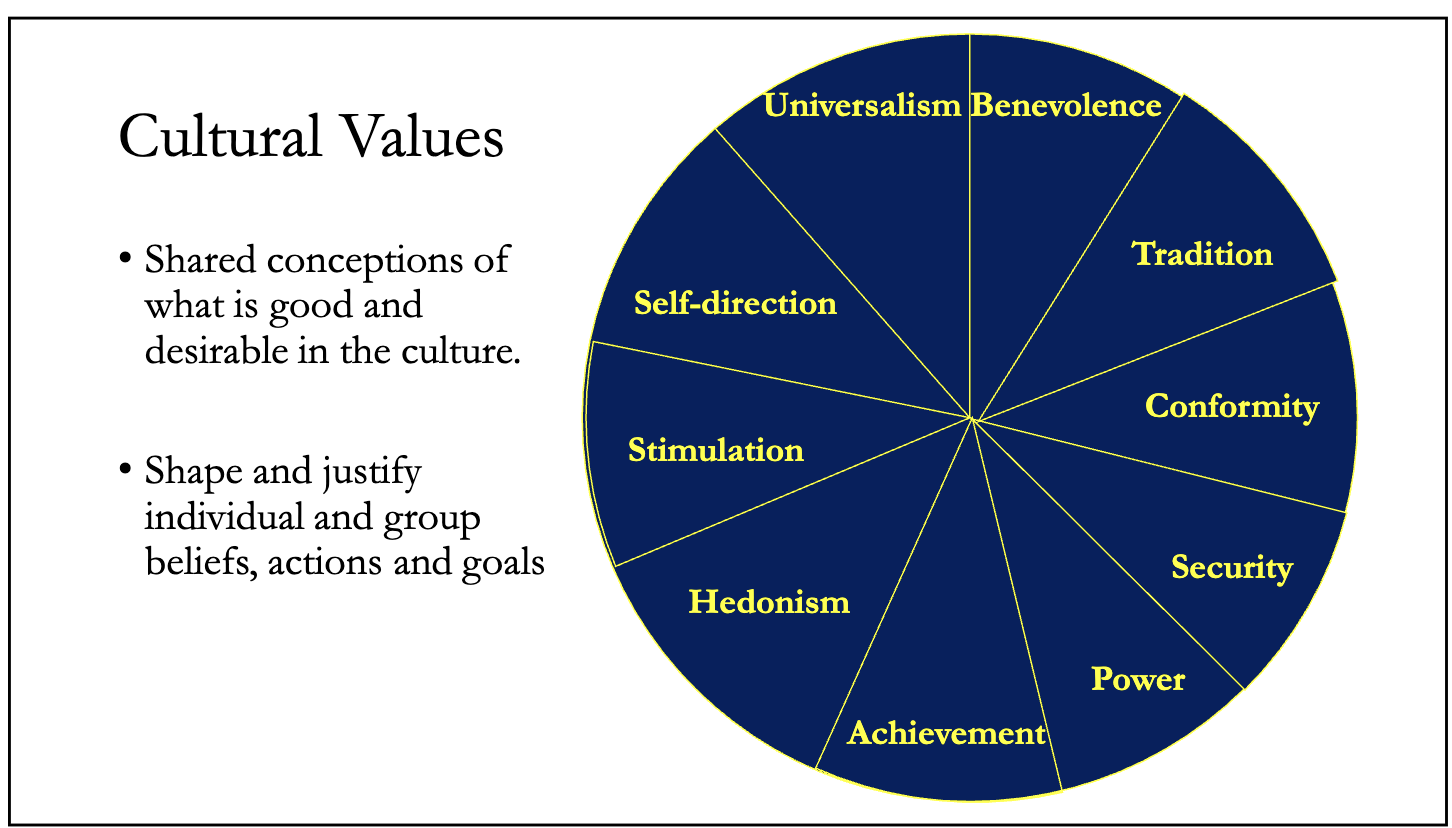
Definition: These are shared ideas about what is "good" or "desirable" in a society.
The Study: Schwartz didn't just guess; he validated his theory with massive data (60+ countries, 60,000+ people) to find values that exist everywhere, not just in the West.
2. The "Pizza" Chart (Slide 17) Imagine human values as a color wheel or a pizza. Values that are next to each other are similar; values on opposite sides are opposites.
Example: Power is next to Achievement (both are about self-success).
Example: Power is opposite to Universalism (caring for others).
Defining the Terms To ensure equivalence, you cannot just ask, "Do you value Power?" You must define it precisely so a person in Japan and a person in Brazil understand it the same way.
The slide lists the specific definitions used in the survey :Power: Social power, authority, wealth.
Achievement: Successful, capable, ambitious.
Hedonism: Pleasure, enjoying life.
Security: National security, social order, clean.
The Statistical Check (Smallest Space Analysis)
The Statistical Check (Smallest Space Analysis) How do we prove people understood these words the same way? We look at Patterns (Correlations).
The Logic: If "Power" and "Achievement" are similar concepts, people who rate Power high should also rate Achievement high. If they don't, then the words might mean something different in that culture
The Test (Simulated Countries)
The Test (Simulated Countries)
(Pages 11–12 / Slides 21–24)
The lecture uses two fake countries to demonstrate how researchers spot a problem.
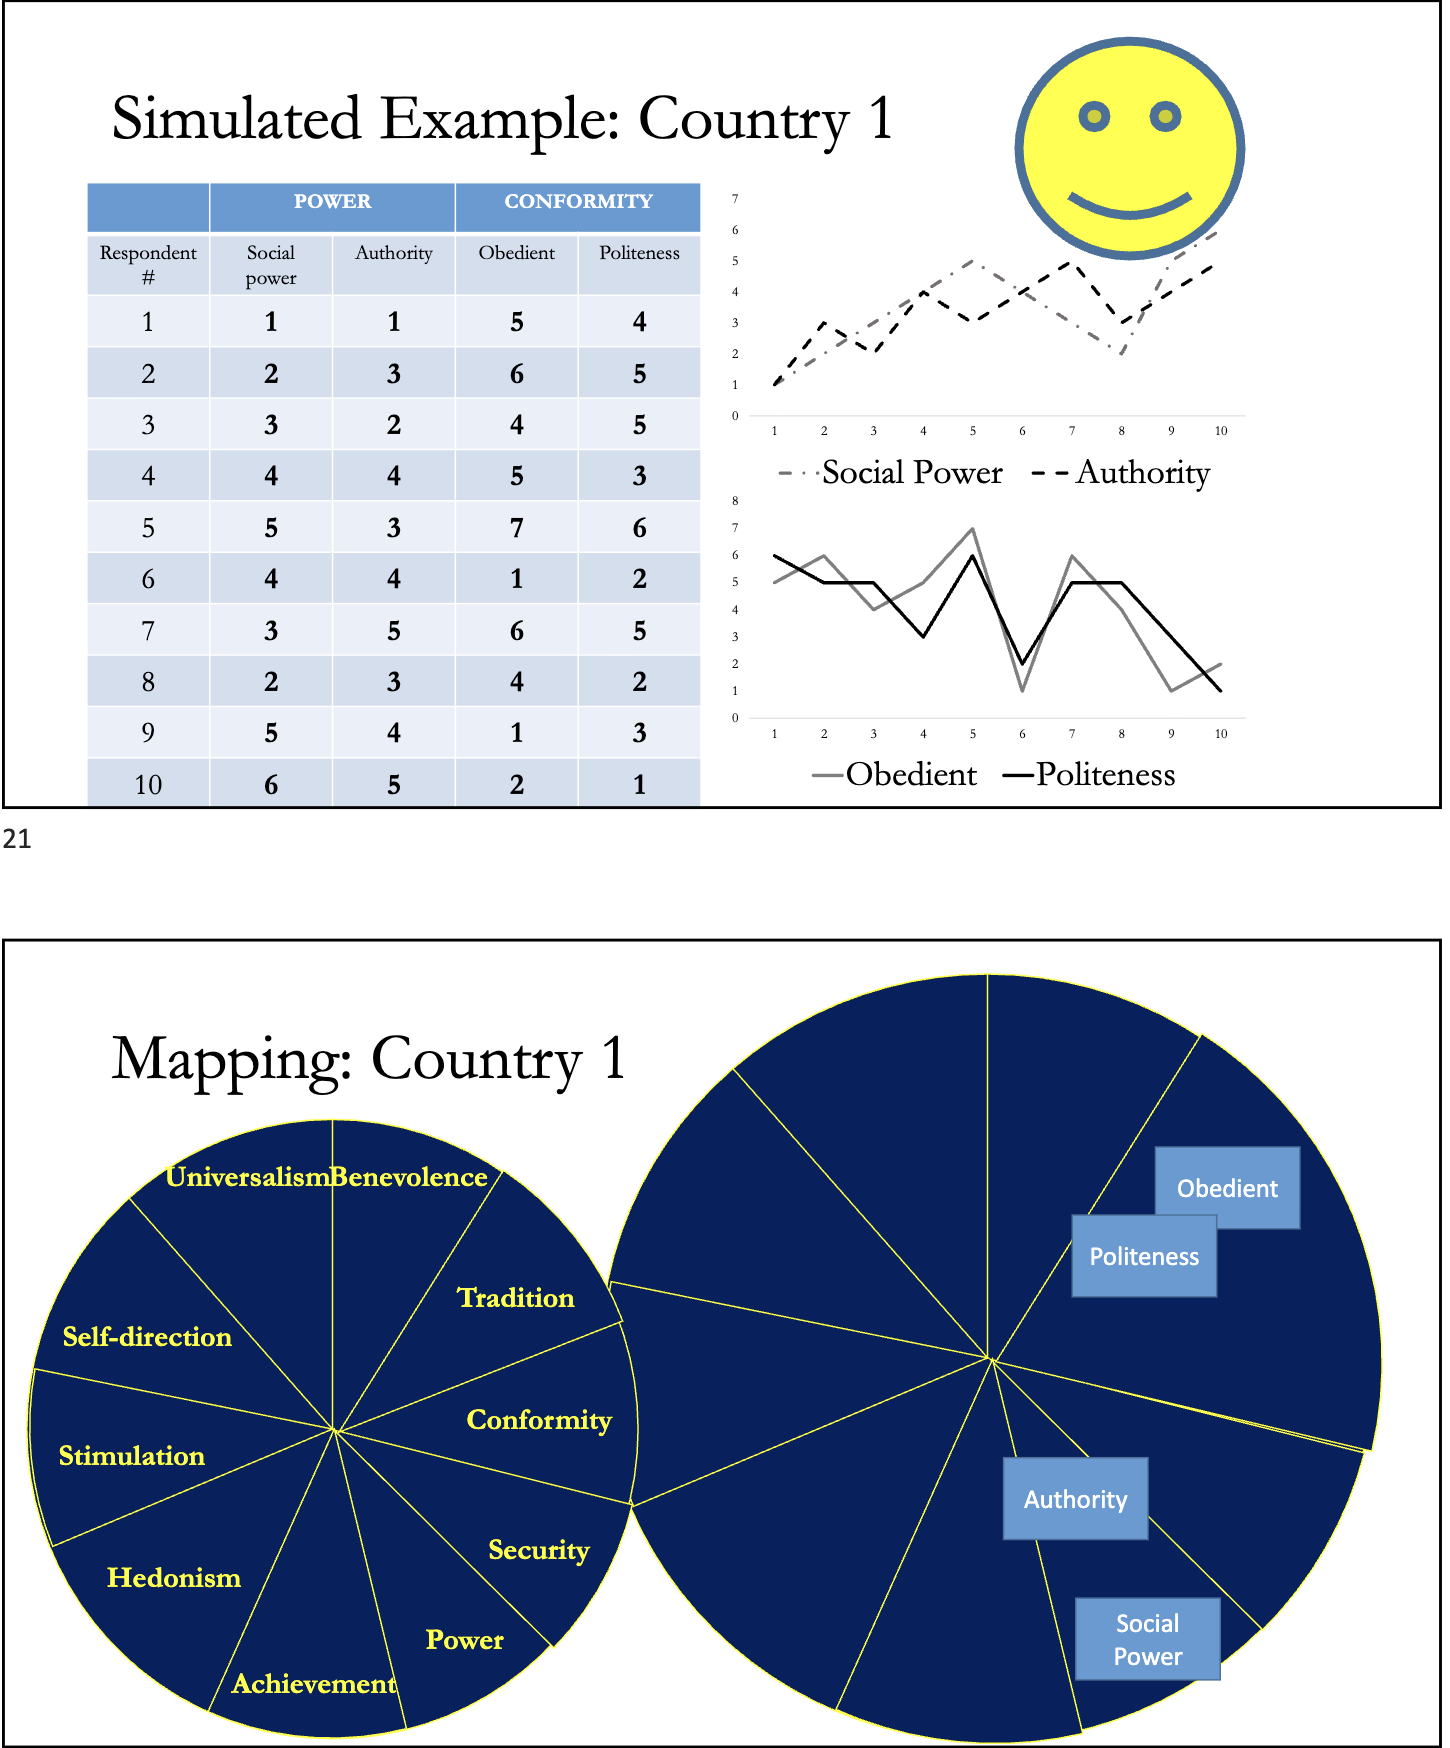
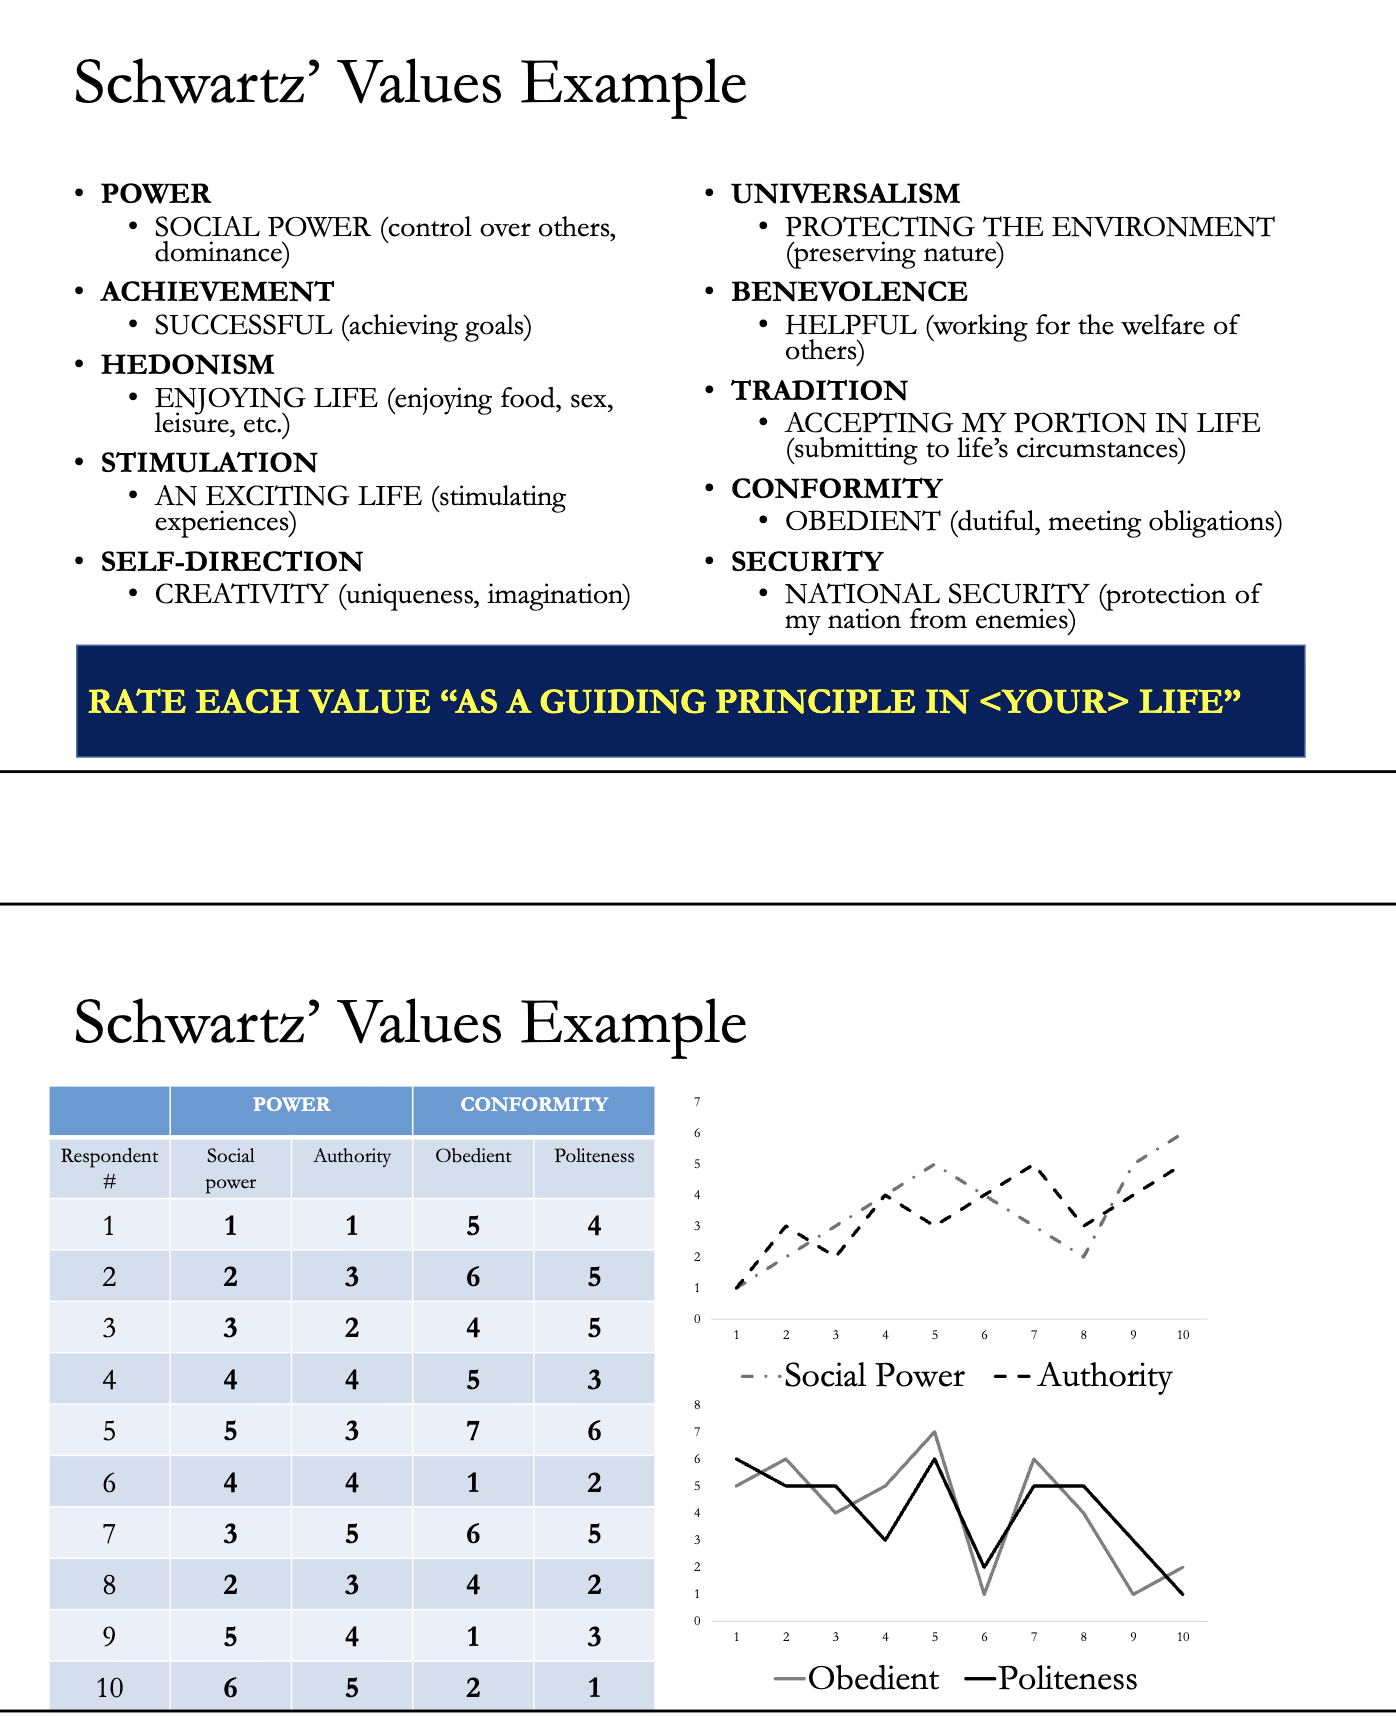
Case A: Country 1 (The "Good" Country)
The Data: Look at the table on Slide 21.
People who liked "Social Power" (Column 1) also liked "Authority" (Column 2). The lines on the graph move together.
People who liked "Obedient" also liked "Politeness."
The Map (Slide 22): When you map this visually, "Social Power" and "Authority" sit right next to each other in the Power slice of the pizza. "Obedient" and "Politeness" sit together in the Conformity slice.
Verdict: This works! The concepts are grouped correctly.
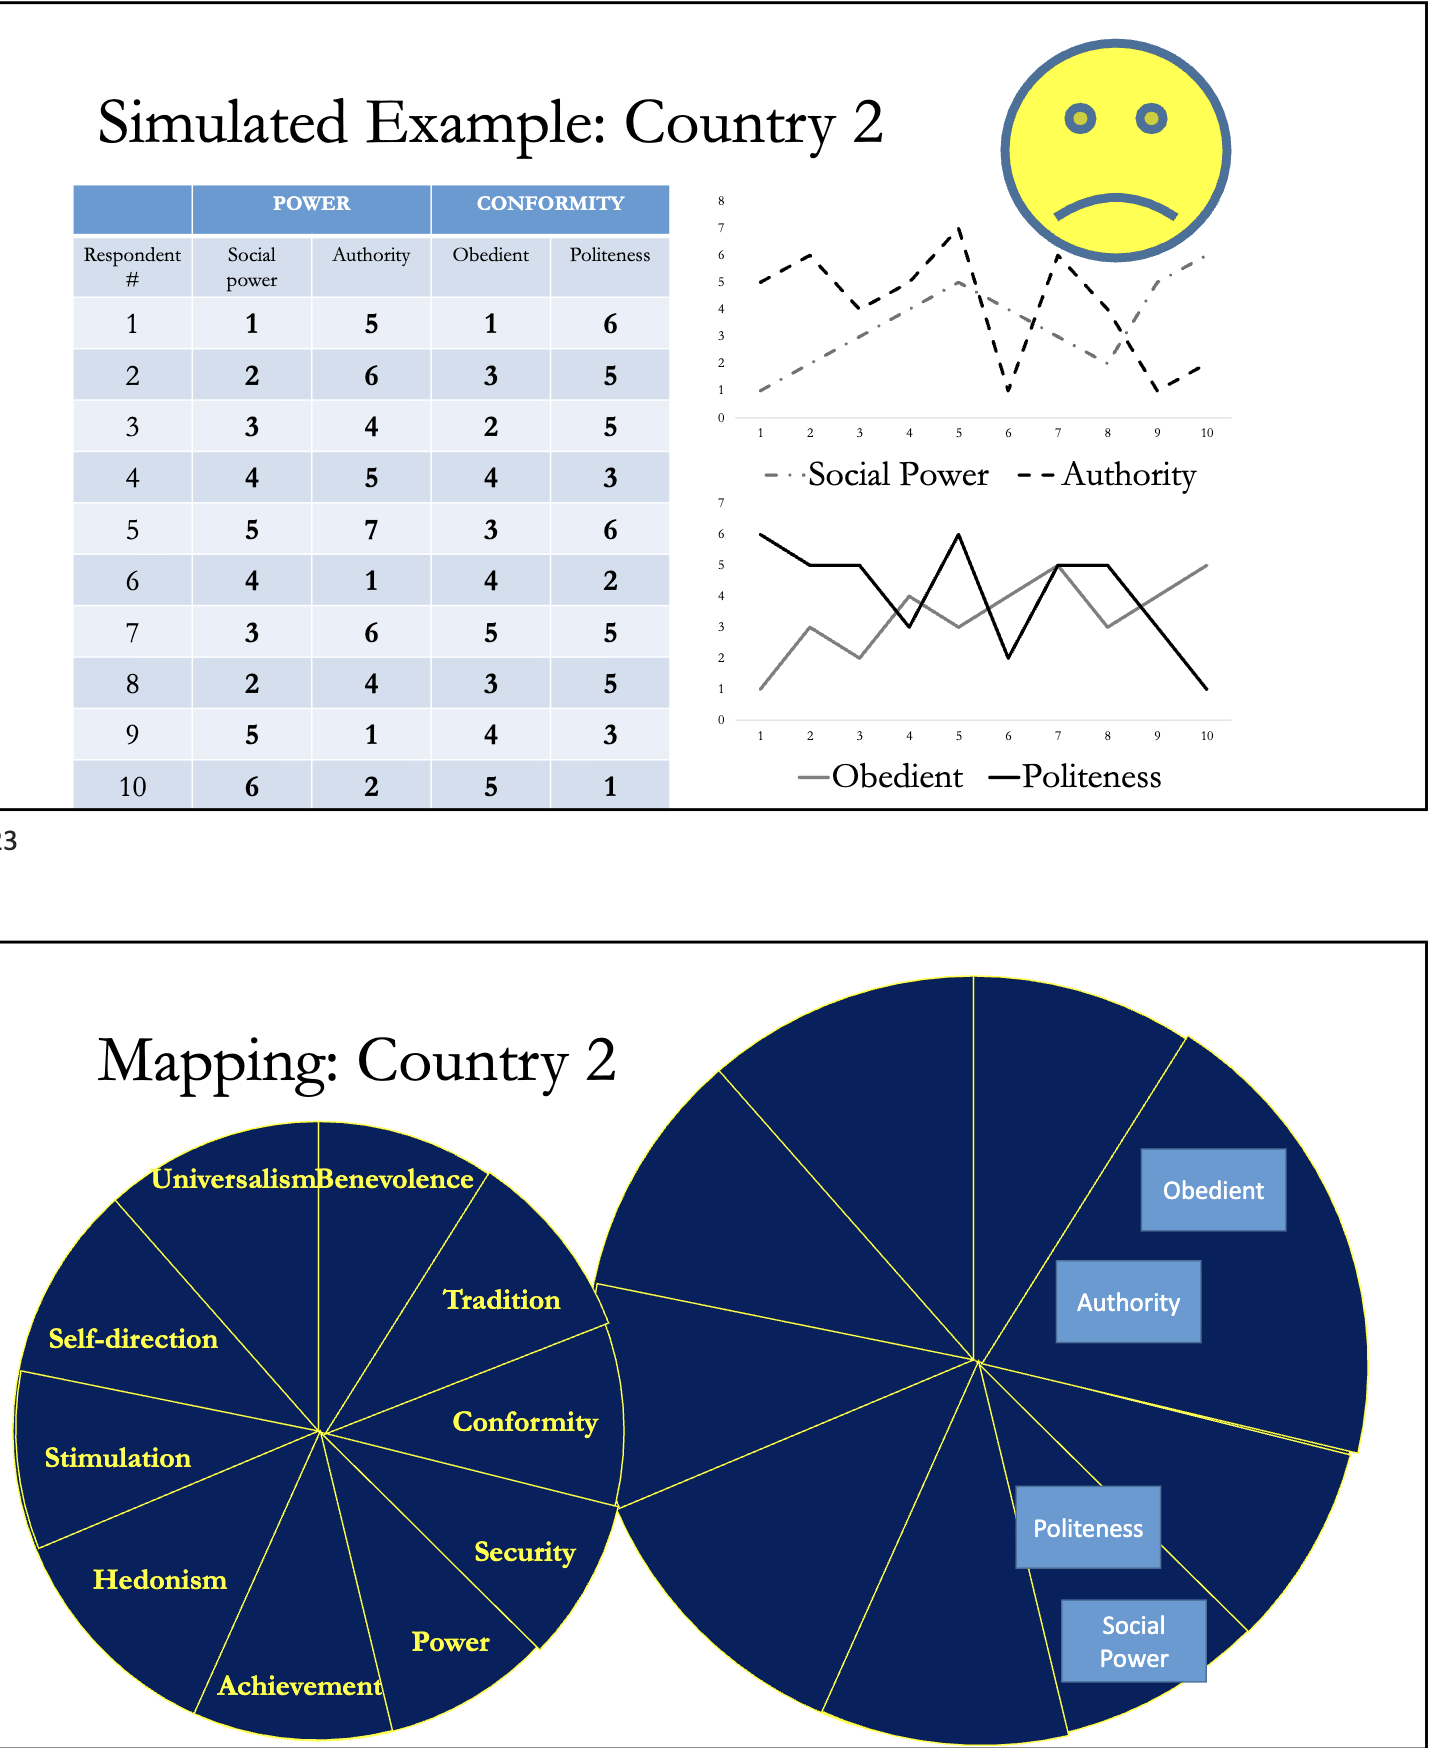
Case B: Country 2 (The "Bad" Country)
The Data: Look at the table on Slide 23.
The answers are messy. People who rated "Social Power" high often rated "Authority" low. The lines on the graph crisscross chaotically.
The Map (Slide 24): When you try to map this, the words are scattered. "Authority" has drifted away from "Social Power." "Politeness" has drifted into the wrong section.
Verdict: Lack of Equivalence. In this country, the word "Authority" might have a different nuance (perhaps negative?) than "Social Power," so they cannot be treated as the same construct.
The Solution (How to fix it)
The Solution (How to fix it)
(Page 13 / Slides 25–26)
1. The "Clean Up" Method If you find that a value (like "Authority") is drifting into the wrong spot in many countries, you have to throw it out.
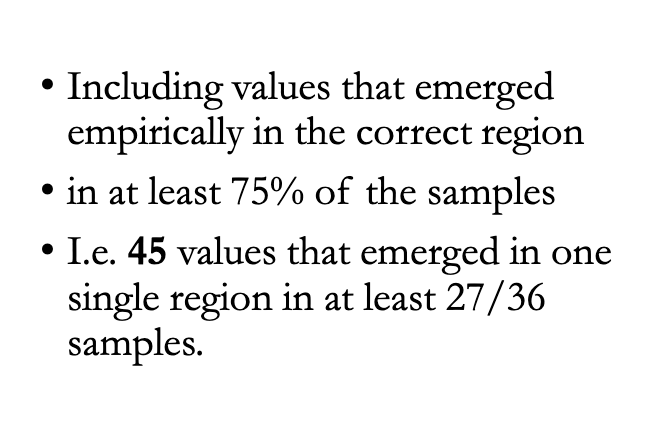
The Rule: Researchers only keep values that appear in the correct "slice" of the pizza in at least 75% of the countries sampled.
The Result: They started with many items but narrowed it down to 45 specific values that meant the same thing universally (e.g., "Family Security" is understood universally, but "Detachment" might not be).
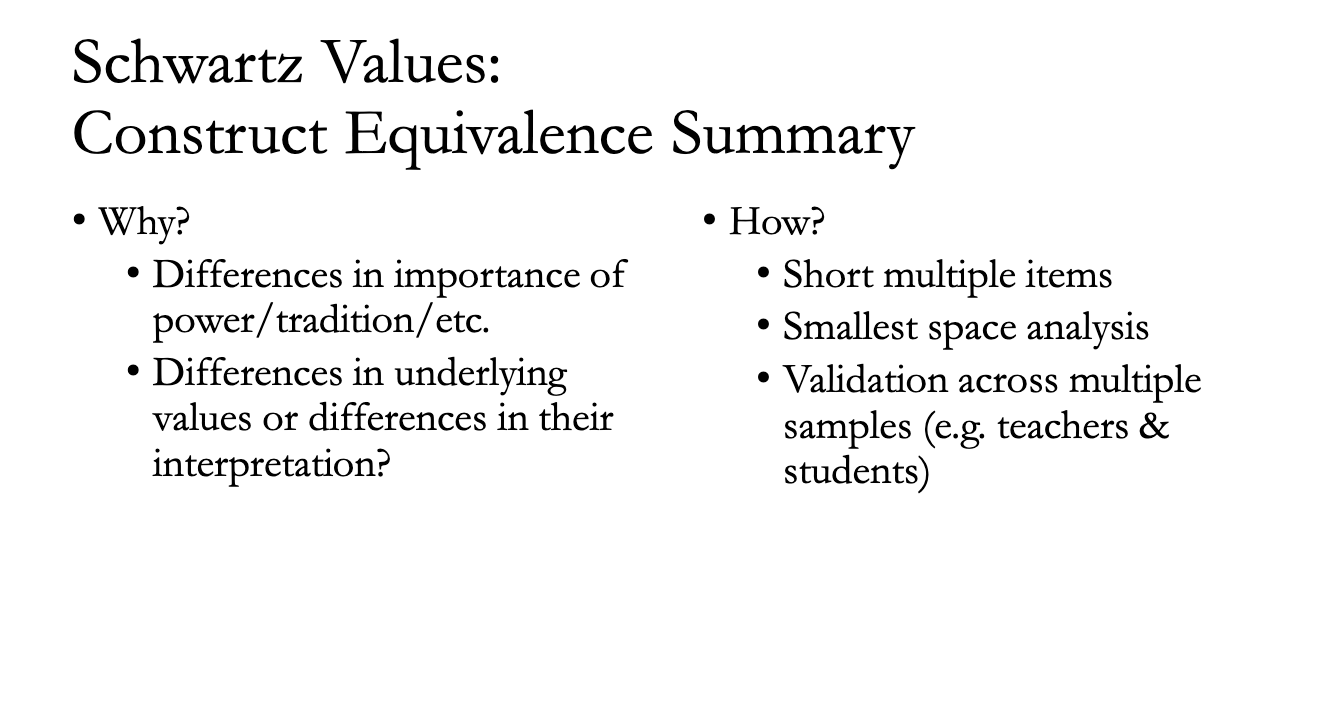
2. Summary Checklist (Slide 26) To ensure your international research is valid, you must :
Why? Check if differences in scores are real cultural differences or just translation errors.
How?
Use multiple items (don't just ask one question about Power; ask 3 or 4).
Use Visual Mapping (Smallest Space Analysis) to see if the items group together correctly.
Validate across different groups (teachers vs. students).
MEASUREMENT EQUIVALENCE
The Three Pillars of Measurement Equivalence
The Three Pillars of Measurement Equivalence
(Page 14 / Slides 27–28)
1. The Big Picture Once you know that a concept (like "Love" or "Power") exists in both cultures (Construct Equivalence), you have to measure it. But can you measure it the same way? This is Measurement Equivalence.
2. The Three Types of Measurement Problems The slide breaks this down into three specific challenges :
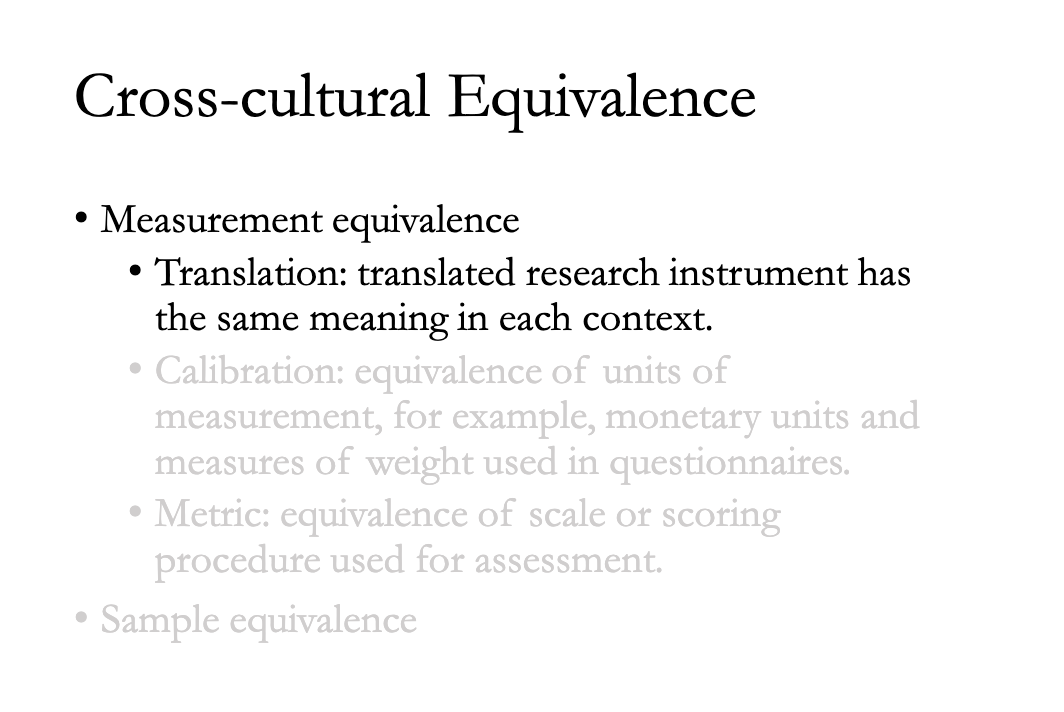
i) Translation Equivalence: Does the question mean the exact same thing when translated? (e.g., "Dinner" in the UK might mean lunch, while in the US it means the evening meal).
ii) Calibration Equivalence: Do the units match?
Example: If you ask about weight, Americans answer in pounds, Europeans in kilograms. You must convert them to compare.
Example: Inflation rates or currency values differ wildly.
iii) Metric Equivalence: Do people use the scale the same way?
Example: In some cultures, people are polite and tend to rate everything 6 or 7 out of 7. In others, they are critical and rarely give high scores. If you compare a "6" from a polite culture to a "6" from a critical culture, they might not mean the same level of satisfaction.
Solving the Language Barrier (Translation) : Translation Equivalence
Solving the Language Barrier (Translation)
(Pages 15–16 / Slides 29–32)
1. The "Golden Rules" of Translation
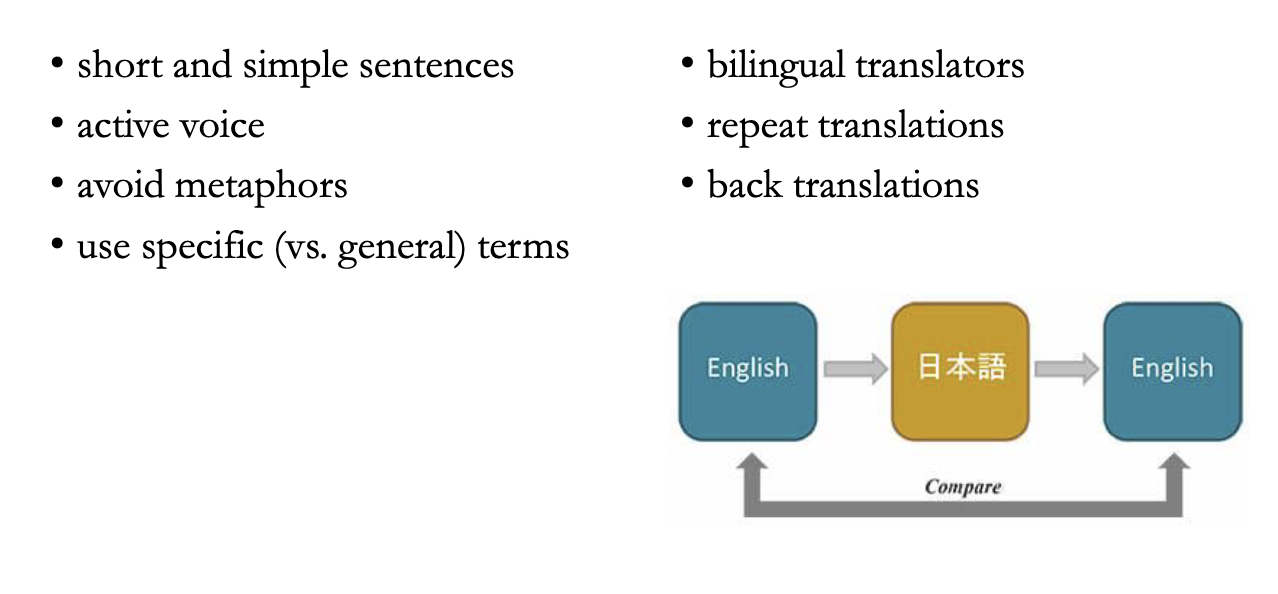
How do you ensure your survey isn't "lost in translation"? Slide 30 gives a checklist:
Keep sentences short and simple.
Use Active Voice ("I bought the car") instead of Passive ("The car was bought by me").
Avoid Metaphors: Say "I was happy," not "I was over the moon" (which might sound confusing in another language).
Use specific (vs. general) terms
Back-Translation: This is the gold standard.
Step 1: Translate English → Japanese.
Step 2: Have a different person translate that Japanese → back to English.
Step 3: Compare the new English version to the original. If they don't match, you have a problem.
2. Verifying with Statistics
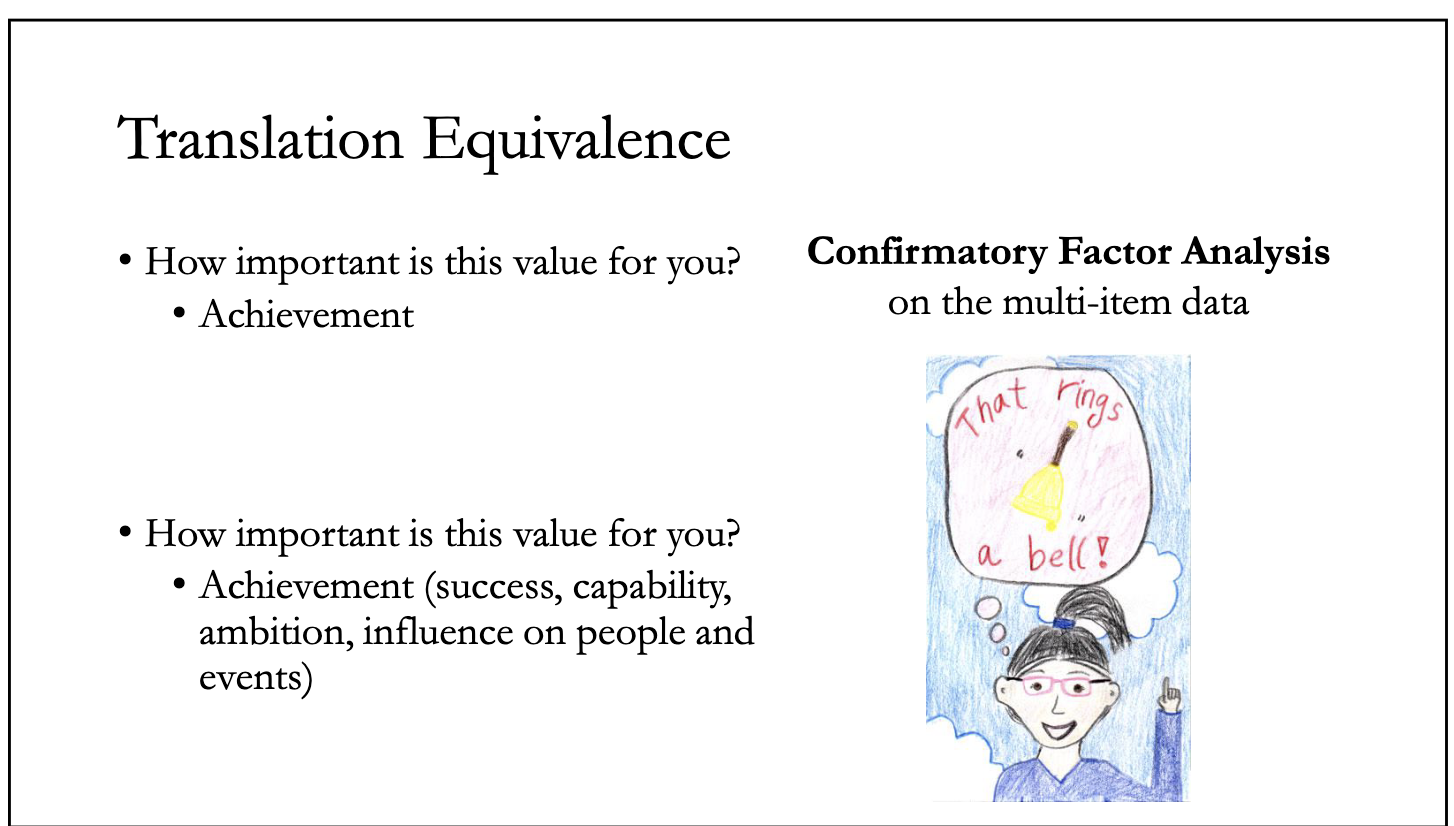
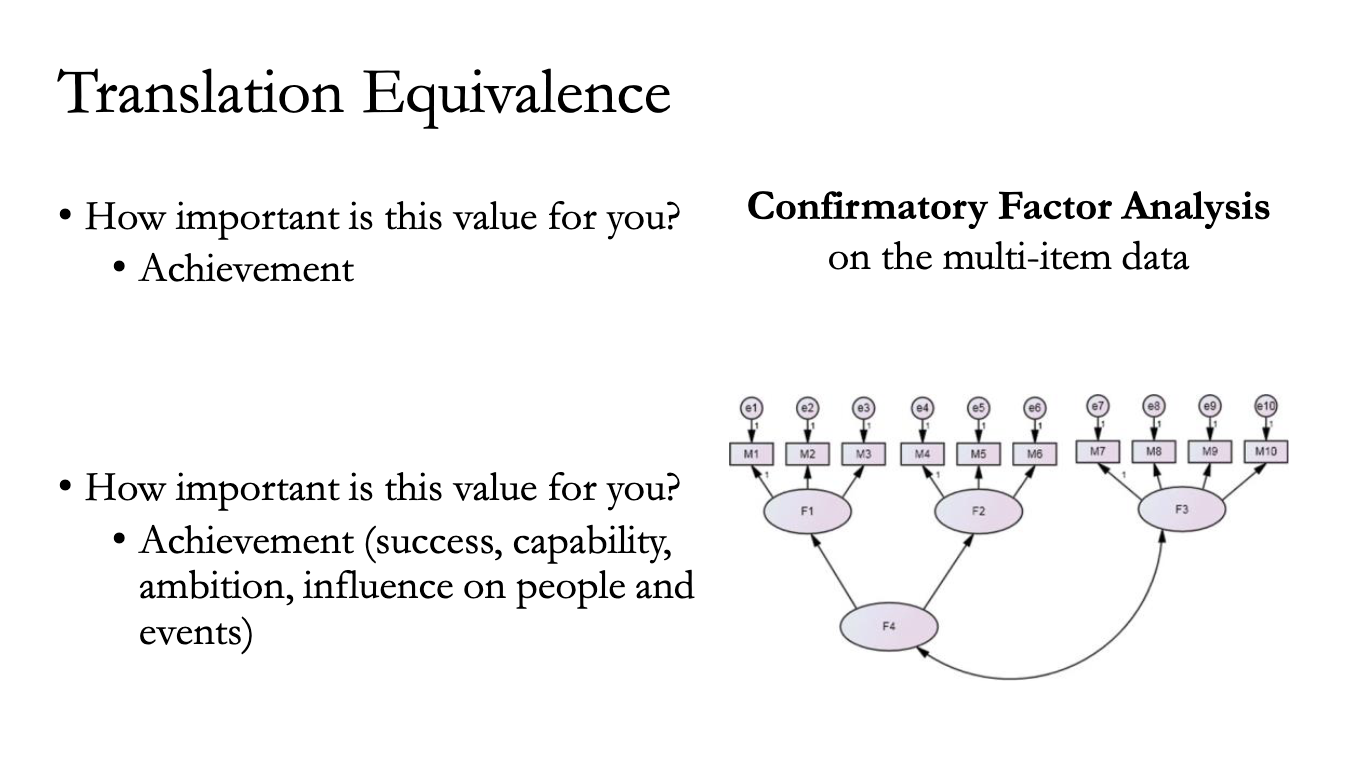
USE CONFIRMATORY FACTOR ANALYSIS
Slide 32 shows a data table and a graph. This represents a statistical check (Confirmatory Factor Analysis).
The Logic: If "Achievement" means the same thing in both languages, the data patterns (how people answer) should look identical in both the English survey and the translated survey. If the lines on the graph don't match, the translation failed.
SO, SHOULD WE JUST USE ENGLISH FOR ALL SURVEYS?
Module 3: The "English Only" Debate
(Page 17 / Slides 33–34)
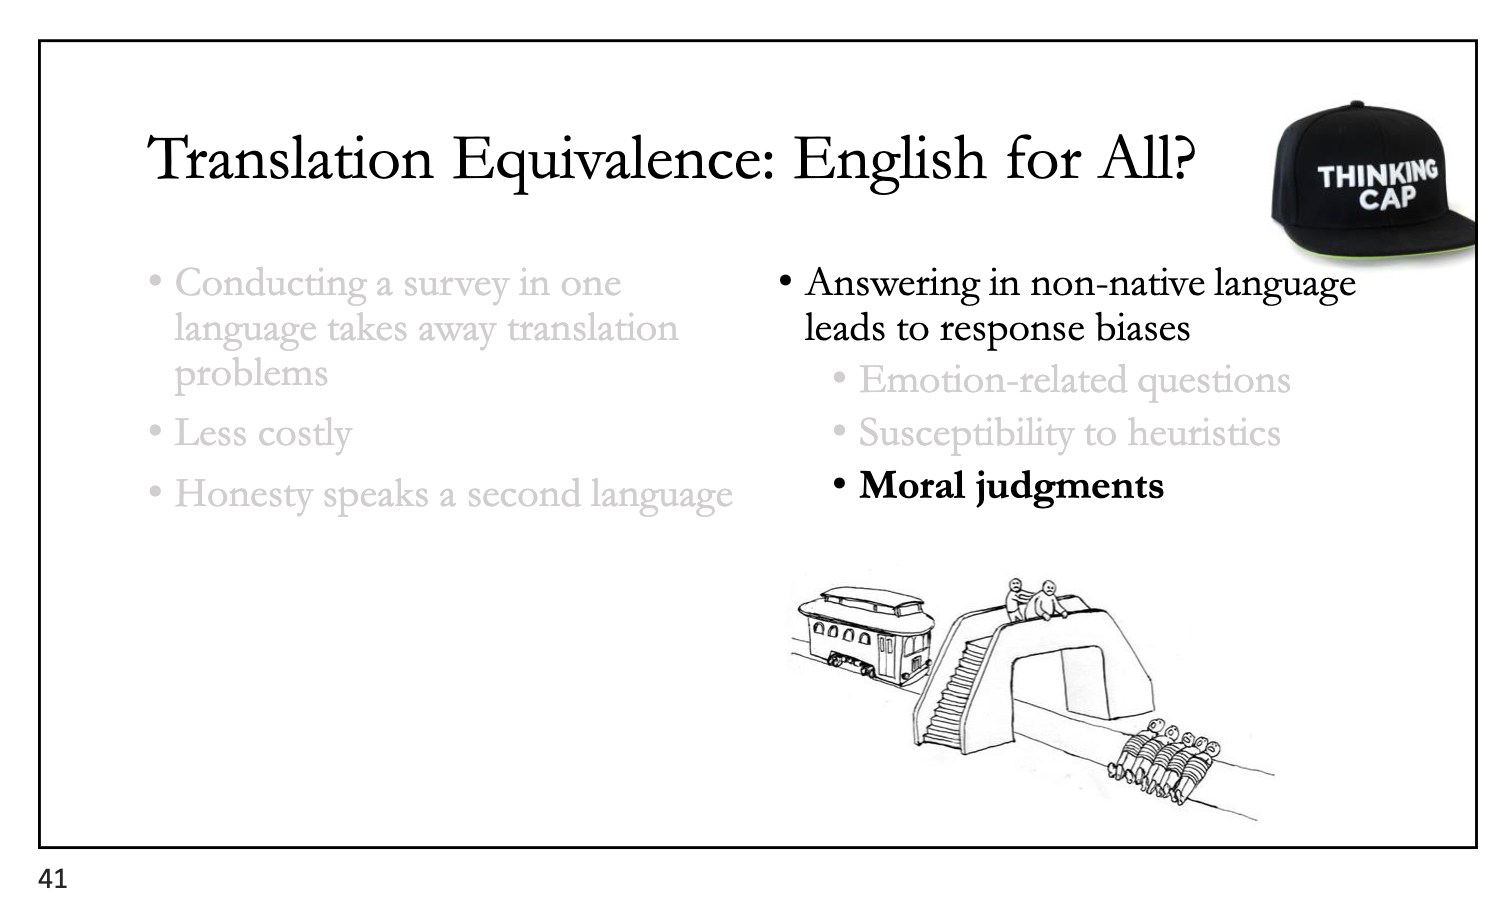
The Question Since translation is so hard and expensive, businesses often ask: "Why don't we just run the survey in English everywhere? Everyone speaks English nowadays, right?"
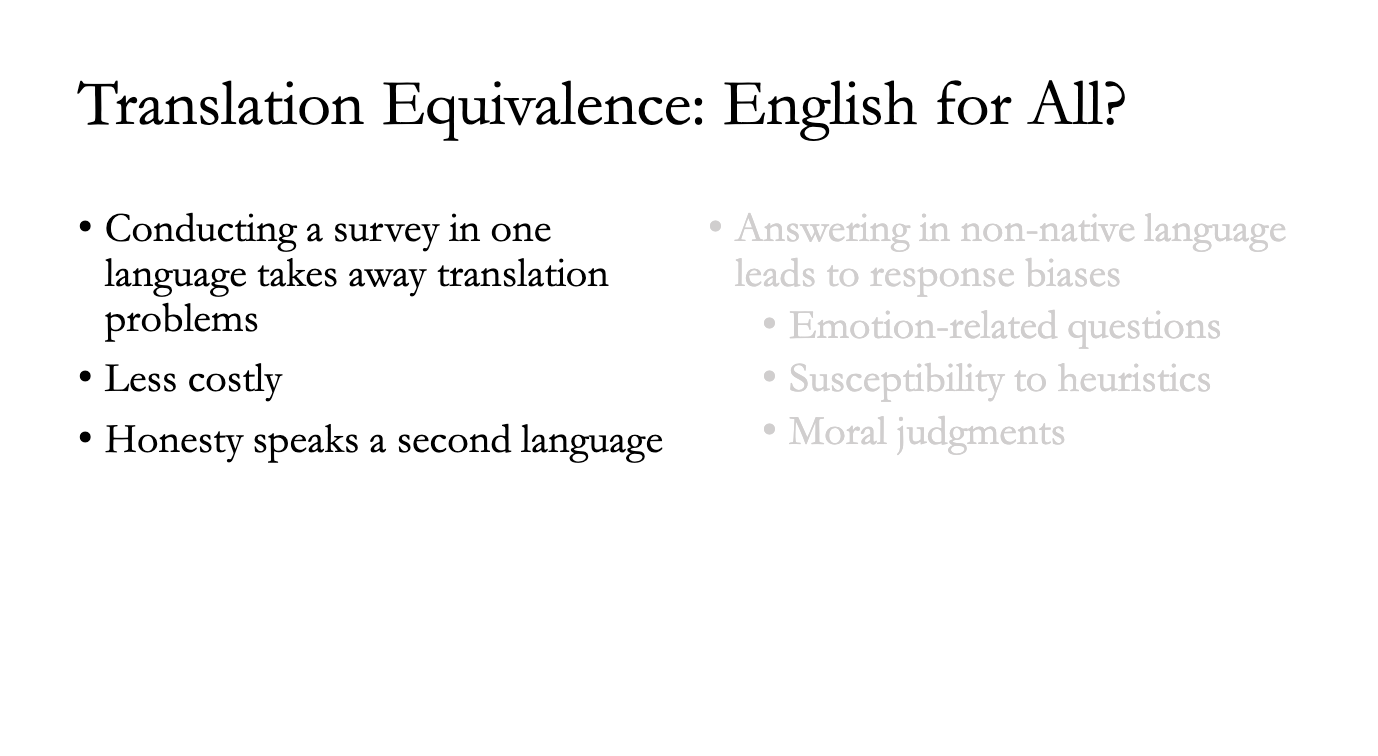
The Dangers of "English Only" (Response Bias)
The "Foreign Language Effect" The lecture presents a counter-intuitive finding: Your brain works differently when you use a second language (L2).
1) Emotion is Lost
The Theory: Your native language (L1) is connected to your emotions because you learned it as a child. A foreign language (L2) is learned in a classroom, so it feels colder and more logical.
The Evidence: Slide 38 shows a slogan: "Where a kid can be a kid..."
When people read this in their Native Language (Black Bar), they rated it as highly emotional.
When they read the exact same slogan in their Second Language (White Bar), the emotional intensity dropped significantly.
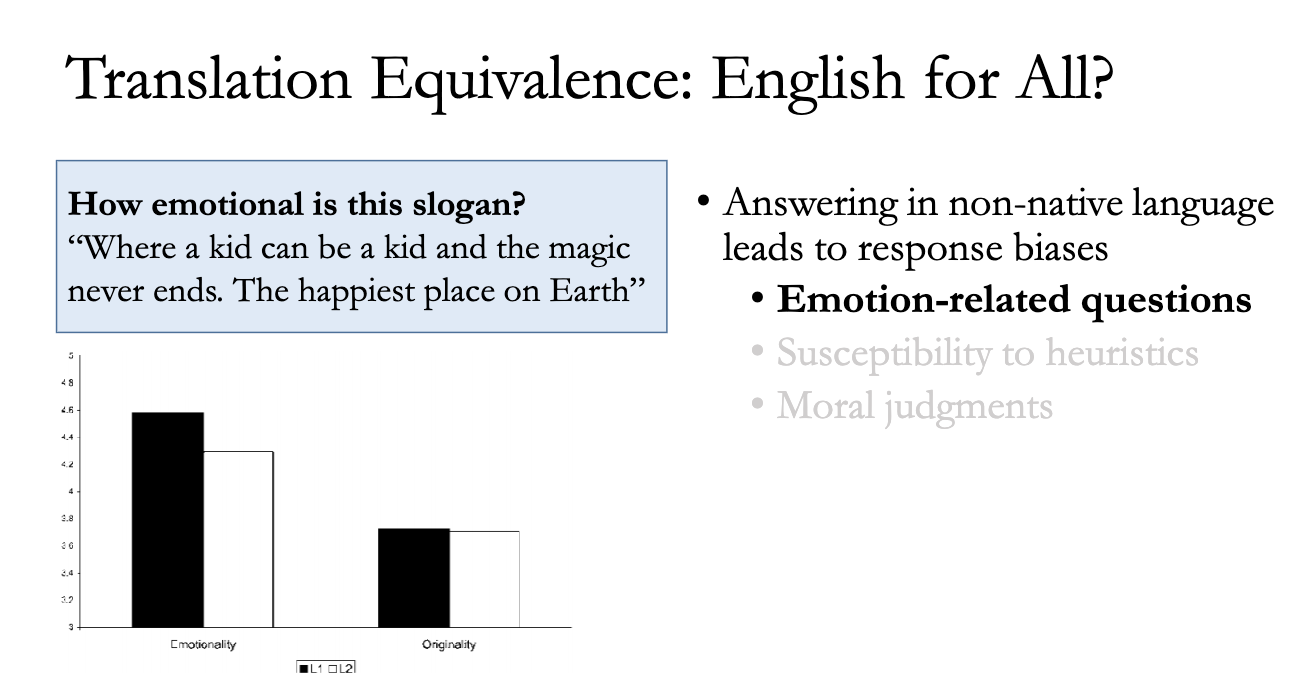
The Lesson: If you want to measure feelings (like brand love), asking in English (L2) will give you lower, colder scores than the reality .
2) Susceptibility to heuristics:
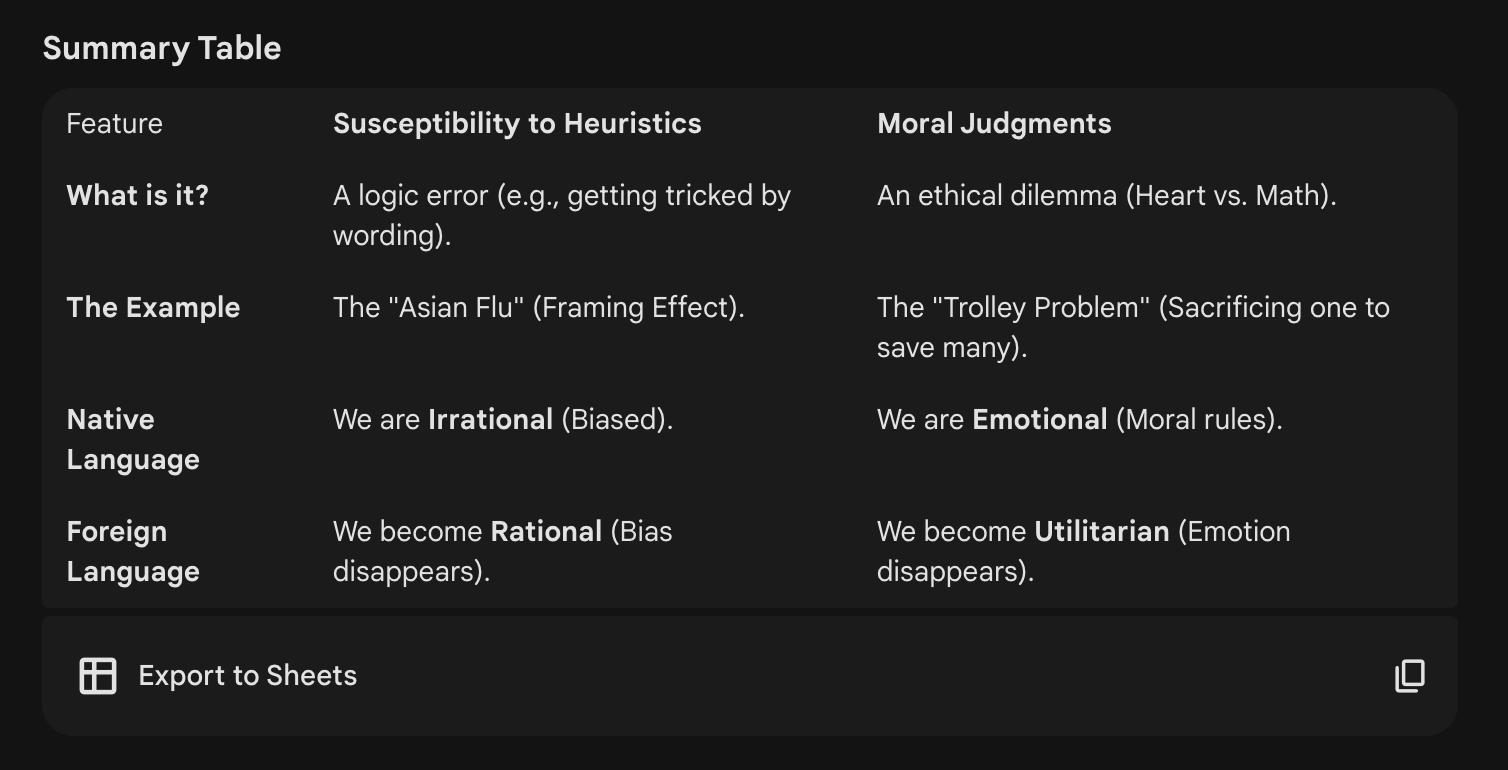
So Susceptibility to Heuristics (The "Brain" Shortcuts)
This refers to cognitive biases or mental shortcuts. These are the "irrational" mistakes our brains make when we are processing information quickly.
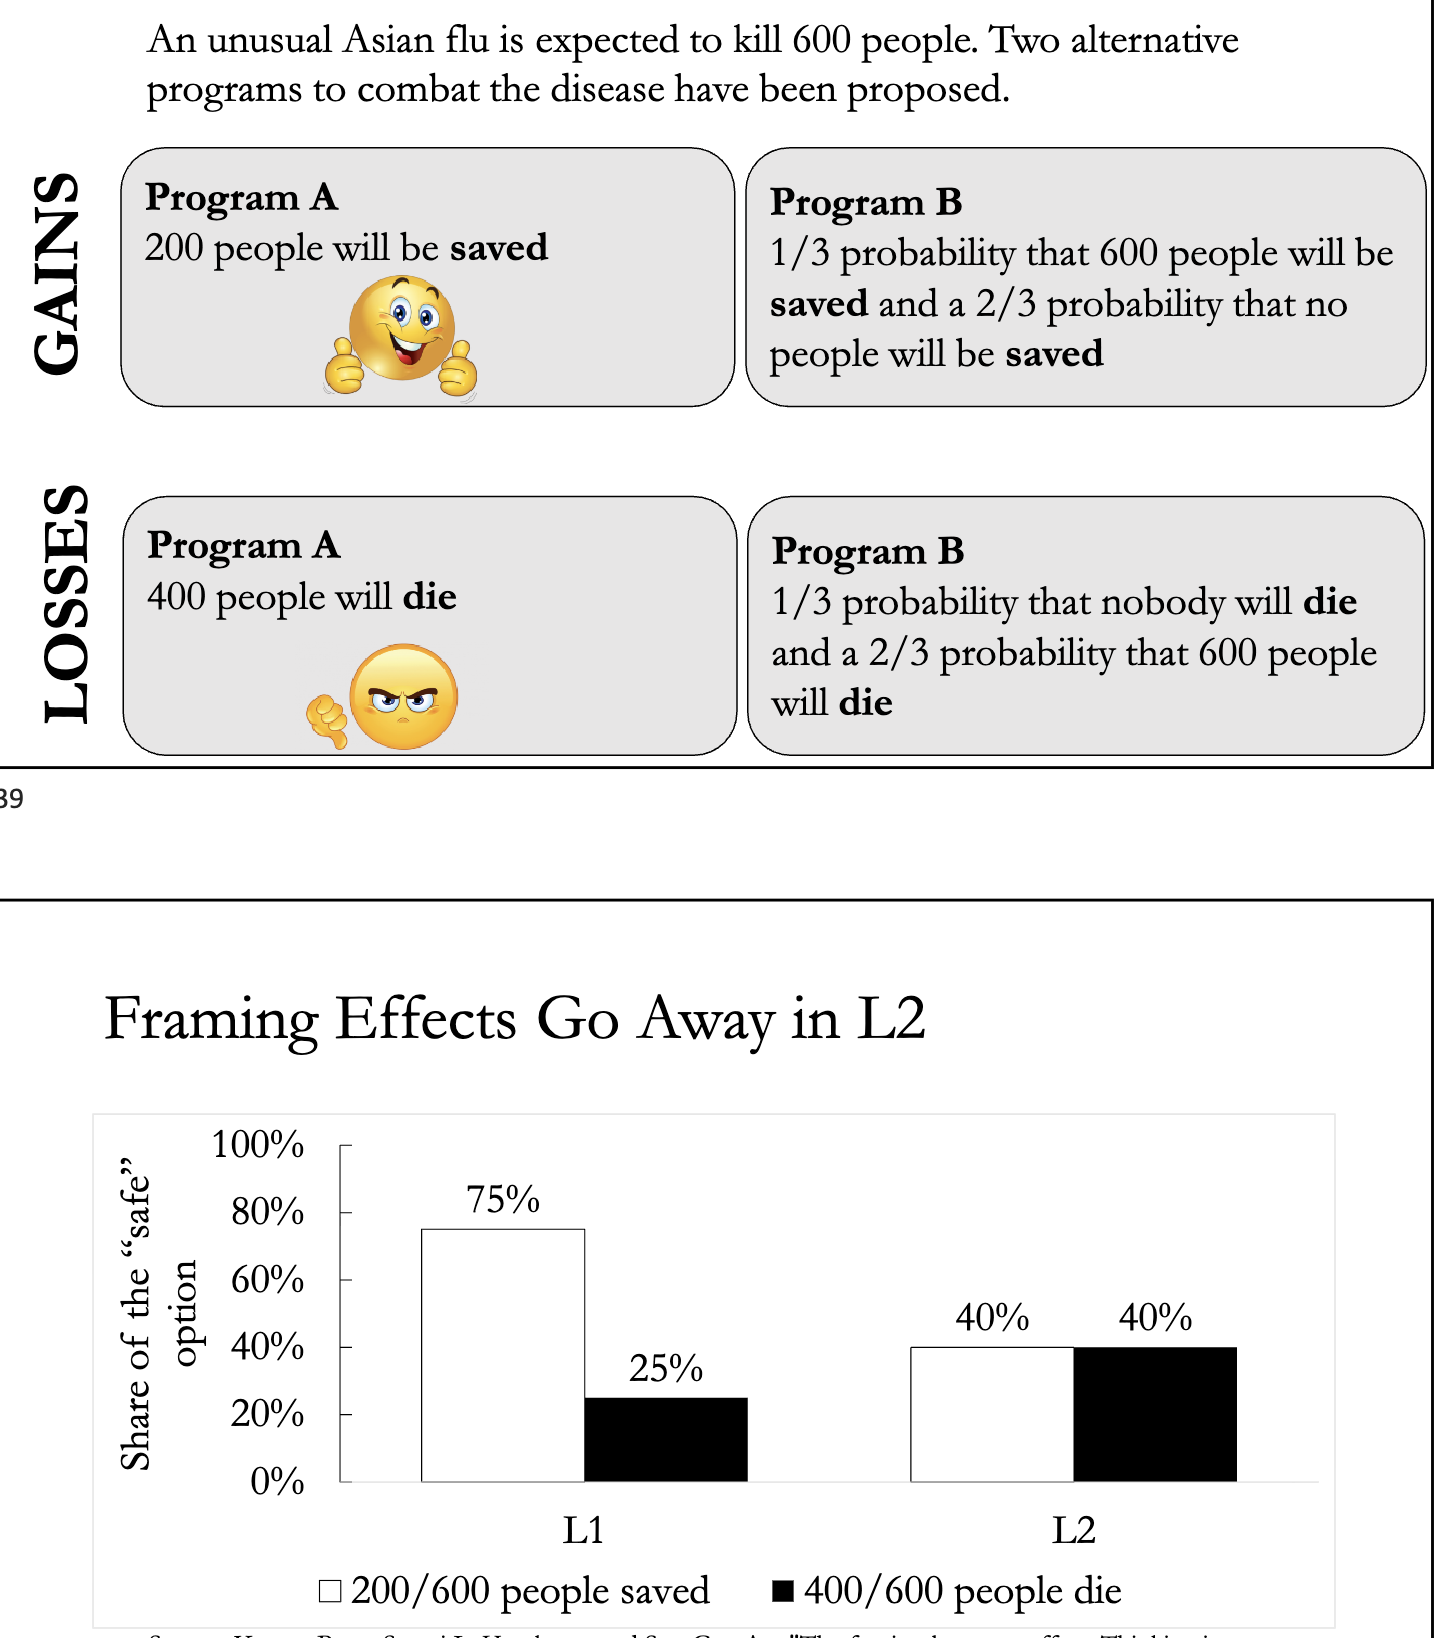
The Concept: A "heuristic" is a shortcut, like "Framing." We usually like an option better if it is framed as a "Gain" (Saving 200 people) rather than a "Loss" (400 people die), even if the math is identical.
The Foreign Language Effect: When you speak a foreign language, your brain has to work harder. This forces you to slow down and think deliberately.
The Result: You become LESS susceptible to heuristics. You become more logical.
Slide Evidence (Asian Flu Problem): In their native language, people were biased by the framing (75% chose "Safe" in the gain frame). In the foreign language, the bias disappeared (the bars leveled out), and they treated the options mathematically equal .
Lesson :
The Finding: When people use a foreign language (English), they think more slowly and logically. They are less easily tricked by marketing gimmicks or biases .
The Lesson: If you want honest, logical feedback on functional features (e.g., "Is this price fair?" or "Does this software work?"), using English is fine. It might even be better because it removes irrational biases.
3) Moral judgments:
This refers to ethical dilemmas where you have to choose between a "gut feeling" of right/wrong and a cold calculation of the "greater good."
The Concept: This is usually tested with the "Trolley Problem." Is it okay to sacrifice one person to save five?
Emotional/Deontological View: "No, killing is wrong." (Typical Native Language response).
Utilitarian View: "Yes, 5 lives > 1 life." (Math-based response).
The Foreign Language Effect: A foreign language feels "colder" and less emotional because you learned it in a classroom, not at home.
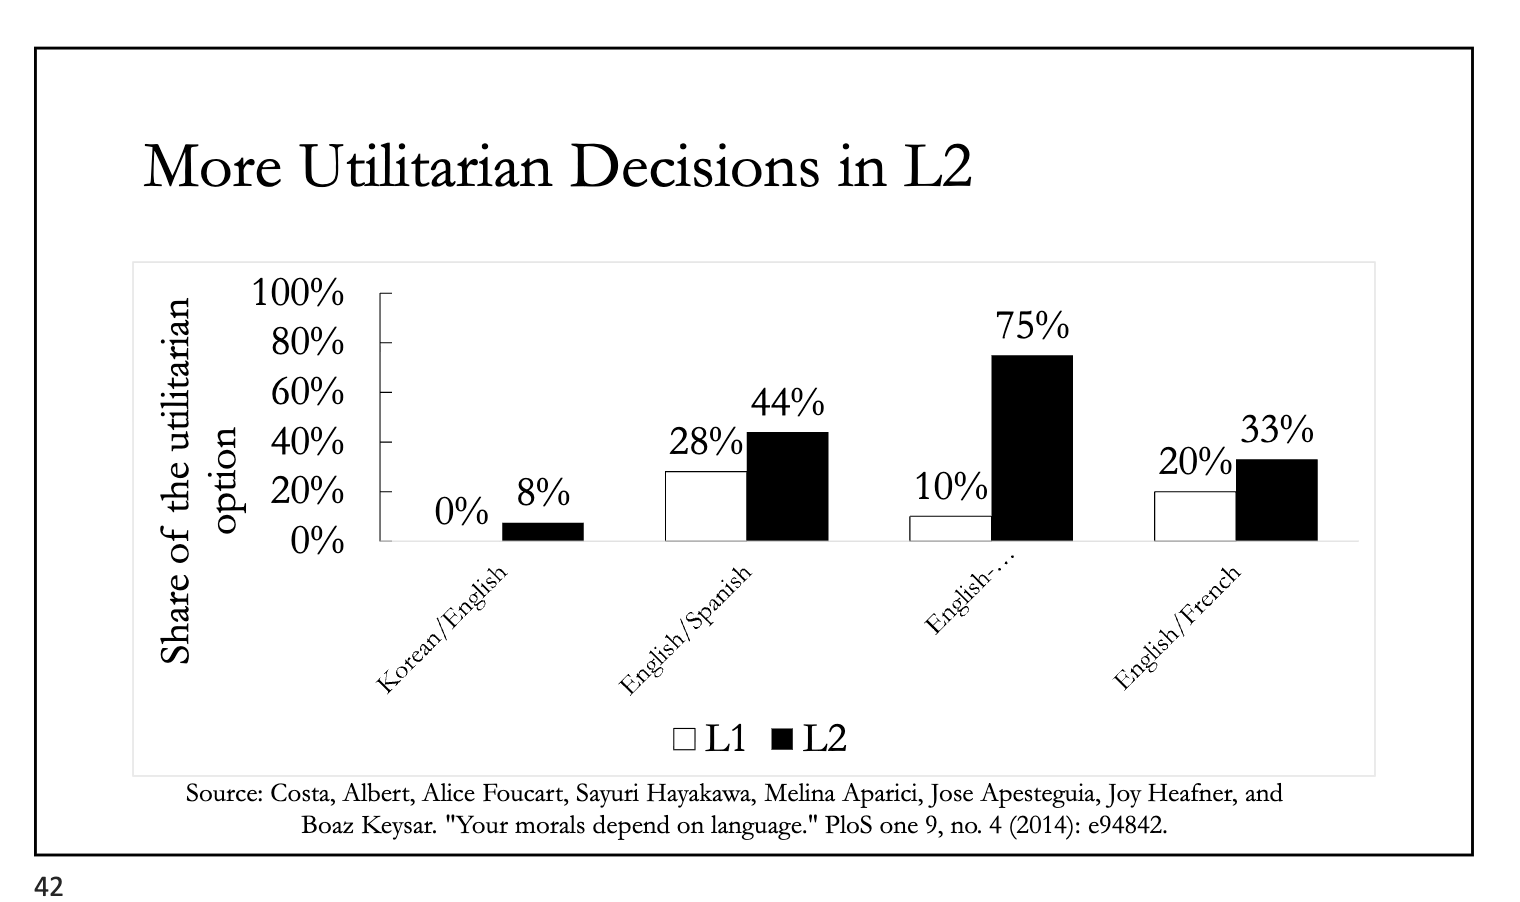
The Result: You become MORE utilitarian. You are willing to make the "cold" decision because the emotional shock is dampened.
Slide Evidence (Slide 42): In their native language, very few people chose the utilitarian option. In the foreign language (L2), the percentage of people willing to choose the utilitarian option (the "cold" choice) jumped significantly, sometimes doubling .
Lesson:
The Finding: A foreign language feels "colder." People become less emotional and more utilitarian (calculating).
The Lesson: If you want to measure Brand Love, Trust, or Ethics, using English is dangerous. It will "numb" the results. You will get lower emotional scores than the reality because the language itself creates emotional distance.
Use Engish? …Well it depends
So, should we use English for all surveys?
The Answer: "That Depends" .
Use Native Language if you want to measure emotions, deep moral values, or gut feelings (Brand Love, Trust).
Use English (if they speak it) if you want purely logical, functional feedback (e.g., "Does this button work?"), but be aware that their answers will be more rational and less emotional than they would be in real life.
Lecture 6: Self-check Questions
Here are concise, exam-style answers to the Lecture 6 Self-Check Questions, based on the provided lecture slides and readings.
1. Four Types of Research Problems & Examples
Explore: Used when the problem is unclear; aims to define the issue or design better.
Example: "Why are sales unexpectedly dropping in the Asian market?".
Describe: Used to define opinions, attitudes, or behaviors of a specific group at a specific time.
Example: "What percentage of Dutch consumers prefer sustainable packaging?".
Forecast: Used to predict future outcomes or demand.
Example: "What will be the demand for outbound tourism in 2025?".
Establish Causality: Used to prove that one variable causes another (Cause-and-Effect).
Example: "Does increasing the waiting line entertainment cause customer satisfaction to go up?"
2. Dimensions of Cross-Cultural Equivalence
Equivalence is divided into three main categories:
Construct Equivalence: Does the concept mean the same thing?
Includes: Conceptual, Categorical, and Functional equivalence.
Measurement Equivalence: Is it measured the same way?
Includes: Translation, Calibration, and Metric equivalence.
Sample Equivalence:
Are the samples comparable?.
3. Why Cross-Cultural Equivalence is Important
It is critical because without it, you cannot trust that differences in data are real. If equivalence is lacking, observed differences might be due to measurement error (e.g., bad translation, different interpretations of a scale) rather than actual cultural differences. It ensures valid comparisons across countries.
4. Ensuring Construct Equivalence via Design and Analysis
Survey Design: Use multiple items to measure a single value/construct rather than just one question. Validate the survey across different sub-samples (e.g., teachers vs. students) to ensure robustness.
Analysis: Use statistical methods like Smallest Space Analysis or Confirmatory Factor Analysis to check correlations. If items group together (cluster) in the same way across different countries, equivalence is supported. If an item "drifts" to a different conceptual region, it should be dropped.
5. Effect of Answering in a Foreign Language
Answering in a foreign language (L2) creates a "Foreign Language Effect" that changes cognitive processing:
Reduced Emotion: Slogans and moral dilemmas feel less emotional and intense.
Increased Rationality: Consumers become less susceptible to cognitive biases (heuristics) like framing effects. They evaluate options more logically.
Utilitarianism: People make colder, more utilitarian moral judgments (e.g., sacrificing one to save five) rather than emotional/deontological ones.
6. Ensuring Translation Equivalence via Design and Analysis
Survey Design: Use Back-Translation (Translate → Target Language → Back to Original) to check for errors. Keep sentences simple, use active voice, and avoid metaphors.
Analysis: Use Confirmatory Factor Analysis on the multi-item data. If the factor structures (relationships between variables) look the same in both the original and translated versions, translation equivalence is established.