Business Management Toolkit (M24)
1/67
There's no tags or description
Looks like no tags are added yet.
Name | Mastery | Learn | Test | Matching | Spaced |
|---|
No study sessions yet.
68 Terms
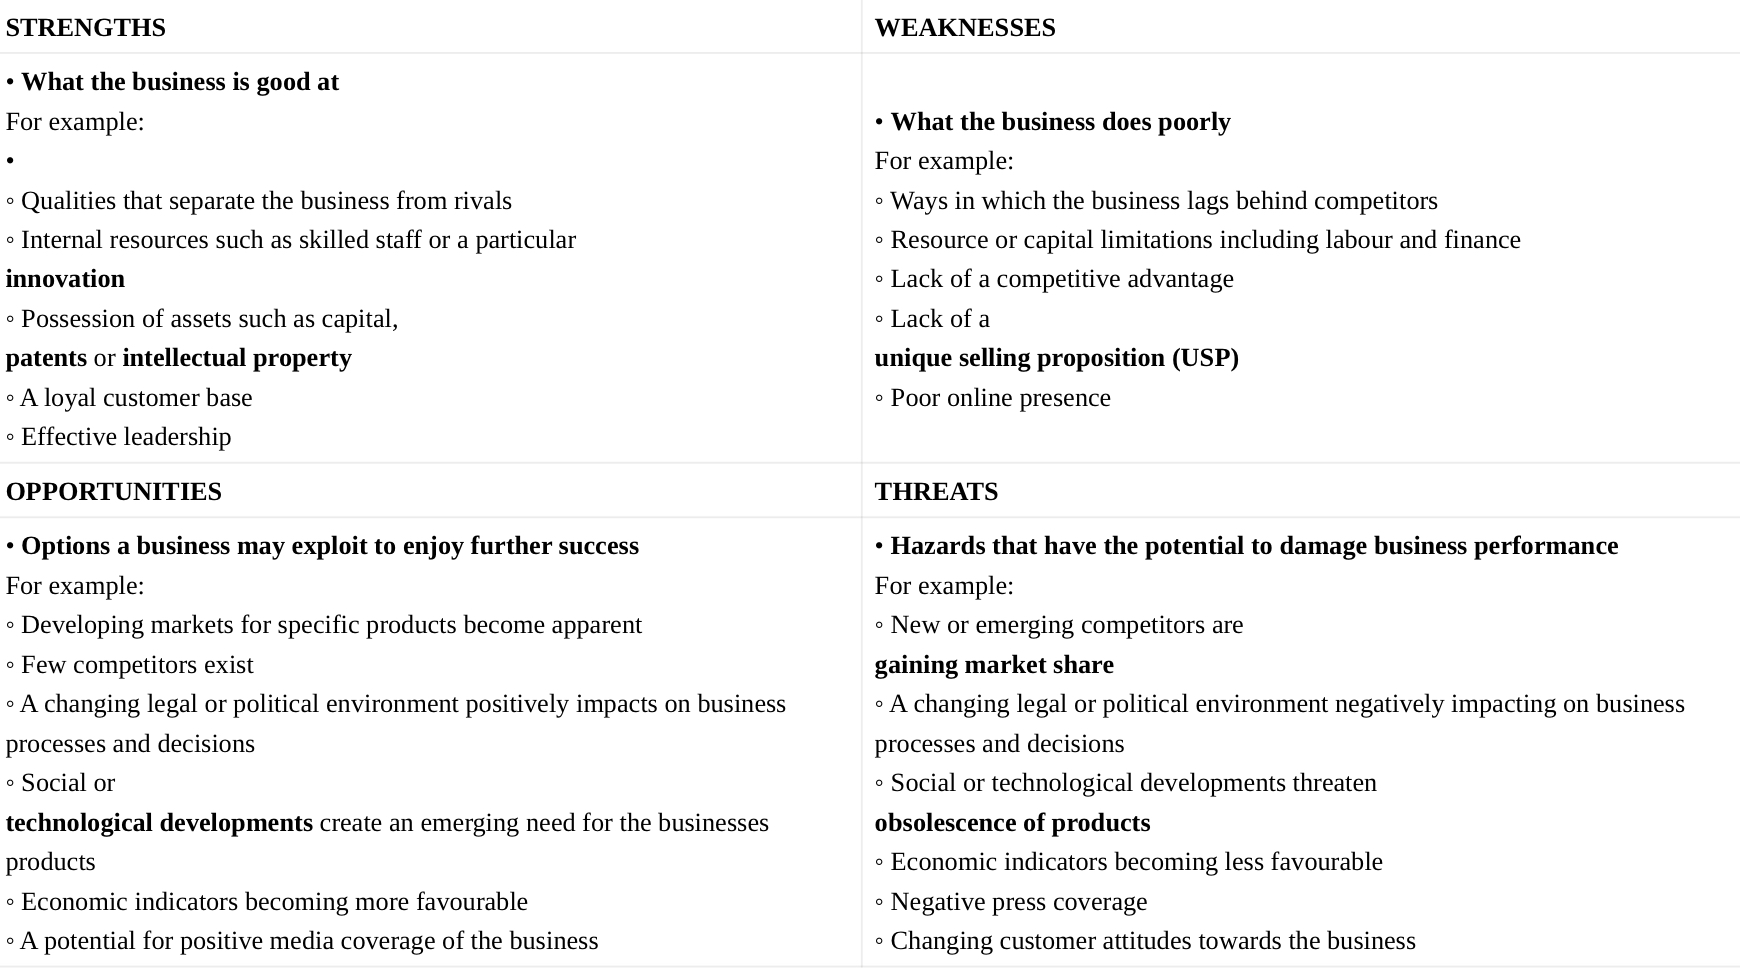
SWOT Analysis
Analyze:
The internal strengths & weaknesses
The external opportunities and threats
SWOT Analysis Aspects
Quality and Relevance of Date (SWOT)
Accurate and reliable date must be used
If the info used for analysis is outdated, incomplete, or biased, can lead to flawed conclusion
Objectivity and Bias (SWOT)
Requires a fair and unbiased assessment of the organization’s internal and external factors
If analysis is influenced by personal biases, preconceived notions, or subjective opinions, it can undermine usefulness of analysis
Depth of analysis (SWOT)
Superficial analysis may overlook important factors or fail to capture the complexity of the organization’s environment
Comprehensive and thorough analysis provides more accurate insights
Stakeholder involvement (SWOT)
SWOT analysis should involve input from various stakeholders within organization (e.g. employees, managers, customers, etc.)
Diverse perspectives can provide a broader understanding of organization’s strengths, weaknesses, opportunities, and threats
Dynamic Nature of the environment (SWOT)
As market conditions, tech, and consumer preferences change over time, the relevance of identified strengths, weaknesses, opportunities, and threats
Regular updates and revisions to analysis are necessary to ensure its usefulness
Ansoff Matrix
Tool for businesses who have a growth objective ~ used to identify appropriate corporate strategy and understand level of risk associated with chosen strategy
Ansoff Matrix ~ Market Penetration
Existing market, existing product ~ Selling more products to existing customers
Ansoff Matrix ~ Market Development
New market, existing product ~ Finding and exploiting new market opportunities for existing products
Ansoff Matrix ~ Product development
Existing market, new product ~ Involves selling new or improved products to existing customers
Ansoff Matrix ~ Diversification
New market, new product ~ Targeting new customers with entirely new or re-developed products
STEEPLE Analysis Terms
Social (Personal attitudes, values, culture, demographic change expected to affect business)
Technological (Tech change and innovation impact business)
Economic (Economic indicators expected to directly impact business performance)
Environmental (Changes in attitude and government policy toward environmental products & impact of global warming impact business)
Political (Local and national government influence business)
Legal (Changes in law and regulations impact business)
Ethical (Moral principles ought to be considered in decision-making)
STEEPLE Analysis
Examines factors outside of the business (external) that are likely to impact the business
Boston Consulting Group Matrix (BCG)
Tool used by businesses to analyze their product portfolio and make strategic decisions about each product
BCG Matrix classifications
Star
Question mark/Problem child
Cash cow
Dog
BCG ~ Star
High market share, high market growth rate (Significant + cash flow and potential for continued growth)
BCG ~ Question mark/ Problem child
Low market share, high market growth rate (- cash flow as businesses usually invest to turn them into stars)
BCG ~ Cash cows
High market share, low market growth rate (Generate + cash flow)
BCG ~ Dogs
Low market share, low market. growth rate (Little revenue for company and no growth potential)
Business Plan
Sets out key aspects of a business and how owners intend it to develop
Main aim of a Business plan
Reduce the risk associated with starting a new business and help owners to raise finance
Key elements of a business plan
Executive summary (overview of business idea)
Company description (Business mission, vision, values)
Market analysis (Target customers/needs, competitor analysis)
Products or services (Products/services business will offer)
Marketing & Sales strategy (Intended marketing and sales approach, marketing channels, pricing strategy, promotional tactics)
Organization and management (Overview of organizational structure ~ key members w/ qualifications, experience, responsibilities)
Operations and implementation (How business will operate on day-to-day basis inc. production process, stock management, key partnerships/suppliers)
Financial projections (Financial forecast inc. projected income statements, balance sheets, cash flow statements)
Risk analysis (Potential risks and challenges)
Decision Trees
A visual and quantitative method of tracing the outcome of a decision so that the most profitable decision can be identified ~ decision for whether or not to launch a new product or improve existing product
Key elements of a decision tree
Decision points
Outcomes
Probabilities
Expected monetary values
Worked Example of a Decision tree
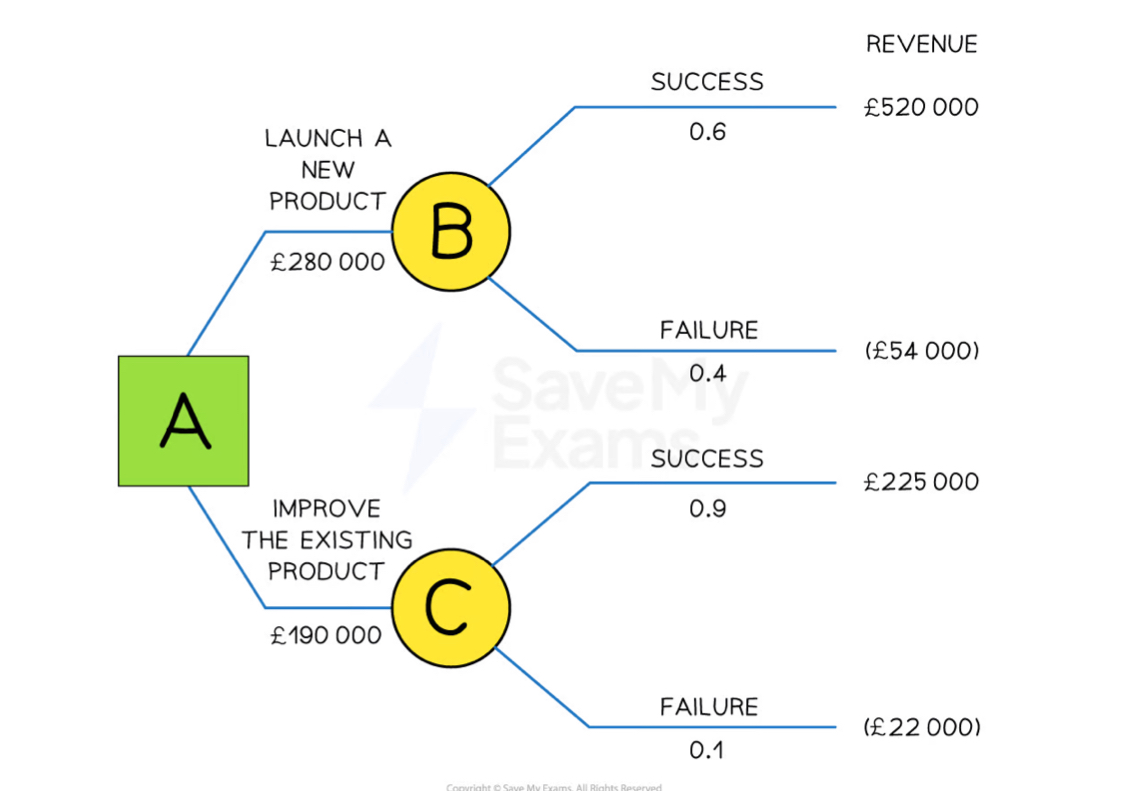
Decision tree ~ Decision points
Points where decisions need to be made ~ represented by squares
Decision tree ~ Nodes
Points where there are different outcomes ~ represented by circles
Decision tree ~ Probabilities
Probability of a likelihood of each outcome
Decision tree ~ Expected monetary values
Monetary value of each decision is based on the expected profit or loss of the outcome
Calculating expected monetary value
(Expected value of success x probability) + (Expected value of failure x probability) - cost
Limitations of Decision Trees
Requires skill to avoid bias and take sig. amounts of time to gather reliable data
Constructed using estimates which rarely take full account of external factors and can’t include all possible eventualities
Qualitative elements aren’t considered which may affect probability of success of a decision
Descriptive statistics
Statistical measures used to concisely describe key features of a dataset
Benefits of using descriptive statistics
Provides brief overview
Enables easy comparison of diverse datasets
Supports informed decision-making
Useful in evaluating performance metrics
Simplifies complex data for effective communication
Mean, Median, and Mode
Mean: Average
Median: Middle value
Mode: Most common value
Circular Business Models
Approach to business designed to minimize the consumption of scarce resources and reduce waste
Aim of circular business model
Maximize the use and value of resources
Materials and products are recycled, reused, or regenerated rather than being disposed after use
Key principles of circular business model
Design for longetivity (products designed to have longer lifespan)
Resource efficiency (resources used efficiently throughout product lifecycle, minimizing waste)
Recycling & Reuse (Materials from products that have reached end of life cycle are recycled or reused to create new products or components)
Product as a service (Provide services such as leasing or renting ~ encouraging product sharing)
Biomimicry (Nature-inspired design principles used to create products/processes that mimic natural systems)
Collaboration & partnerships (Businesses collaborate with suppliers, customers, stakeholder to create closed-loop systems ~ promote exchange of materials and knowledge)
Advantages of circular business model
Reduced waste generation
Decreased reliance on finite natural resources
Cost savings through resource efficiency
Enhanced brand reputation
Increase resilience to resource scarcity and price volatility
Force Field Analysis
Involves managers identifying the driving and restraining forces that surround a strategic change decision
Force Field Analysis ~ Driving forces
Factors that could justify strategic change is needed
E.g.
Internal: Outdated machinery, declining team morale, need to increase profitability
External: Volatile market, disruptive technologies, changing demographic trends
Force Field Analysis ~ Restraining forces
Factors that could prevent or limit change
E.g.
Internal: Fear of unknown, existing organizational structure
External: Existing commitments to partner organizations, government legislation, obligations towards customers
Force Field Analysis Weighting
For each factor in restraining and driving force, they need to be rated from 1-5
1 being Least important
5 being Most important
After weighing each factor, calculate total and choose what has higher total (restraining or driving forces)
Force Field Analysis Strengths
Simple and visual
Comprehensive
Identifies most critical factors
Assists decision-making
Aids communication
Force Field Analysis Weaknesses
Subjective (can lead to bias)
Lacks quantitative data
Snapshot (Might change over time)
Doesn’t provide solutions
Limited in complex situations (oversimplifies analysis)
Gantt Charts
Project management tool used to visualize and plan tasks and their dependencies over time
Gantt Chart Strengths
Visual clarity
Resource allocation and communication
Gantt Chart weaknesses
Complex and time-consuming
Inflexibility
Hofstede’s cultural dimensions
A way of understanding the culture of a country based on its cultural values
Hofstede’s six cultural dimensions
Power distance (Degree to which individuals in a country's institutions and organizations anticipate and embrace unequal distribution of power)
Individualism (individualist cultures: look after themselves and direct family ~ collectivist: take care of in groups in exchange for loyalty)
Motivation towards success (high-score ~ decisive ~ indicates society will be driven by competition, achievement, success ~ low score ~ dominant values in society are caring for other and quality of life)
Uncertainty avoidance (extent to which a society tolerates or avoids uncertainty and ambiguity)
Long-term orientation (Extent to which society has to maintain some links with own past while dealing with challenges of present and future)
Indulgence (extent to which people try to control desires and impulses based on way they were raised)
Hofstede’s cultural dimensions model can help to…
understand cultural differences
focus its market research and product development
Tailor promotional activities
Structure HR, training, and team management
Determine suitable international expansion strategies
Consider approaches to corporate social responsibility
Hofstede’s cultural dimensions model strengths
Structured framework makes comparison easy
Credible model
Clear and simple
Practical application
Hofstede’s cultural dimensions model weaknesses
Generalization
Lack of nuance
Ethnocentrism
Changes over time
Porter’s Generic strategies
Identifies a range of strategies a business can utilize to increase their success
2 main factors:
Source of competitive advantage
Scope of the market
Porter’s Generic Matrix Factors
Cost leadership (cost competitive advantage, mass market scope ~ most cost-competitive in large market)
Differentiation (differentiation competitive advantage, mass market scope ~ stand out on quality, innovation, brand identity)
Cost focus (Cost competitive advantage, niche market scope ~ most cost-competitive in small or specialized market)
Differentiation focus (differentiation competitive advantage, niche market scope)
Mass Market strategies ~ Cost leadership
Most suitable for businesses that have a sig. cost advantage over rivals
Strengths:
Economies of scale
Competitive Pricing
Barriers to entry
Weaknesses:
Risky
Quality concerns
Mass Market strategies ~ Differentiation
Businesses that cannot be the most competitive on cost should make its products distinct from other rivals
Strengths:
Premium pricing
Brand loyalty
Fewer competitive pressures
Weaknesses:
High costs
Customer preferences
Niche Market strategies ~ Cost focus strategy
Involves being the lowest cost-competitor within the market niche
Niche Market strategies ~ Differentiation focus strategy
Involves offering specialized products within the niche market
Niche Market strategies ~ Strengths and weaknesses
Strengths:
Focusing on specific niche allows business to tailor its products or services to particular audience
Highly profitable as low competition allows high prices to be charge
Serving niche market well can lead to strong customer loyalty
Weaknesses:
Focusing on small segment limits sales potential
If niche market shrinks or changes, business may struggle to break even
Larger competitors might enter niche market and outcompete focused business
Contribution per unit *not in formula booklet*
Selling price - variable cost per unit
Total contribution *not in formula booklet*
Contribution per unit x quantity of output
Key uses of contribution analysis
Make or buy analysis (determines whether to manufacture in-house or purchase from third-party)
Contribution costing (Method of costing where only direct costs are allocated to products)
Absorption costing (Method of costing that allocates both direct and indirect costs to products)
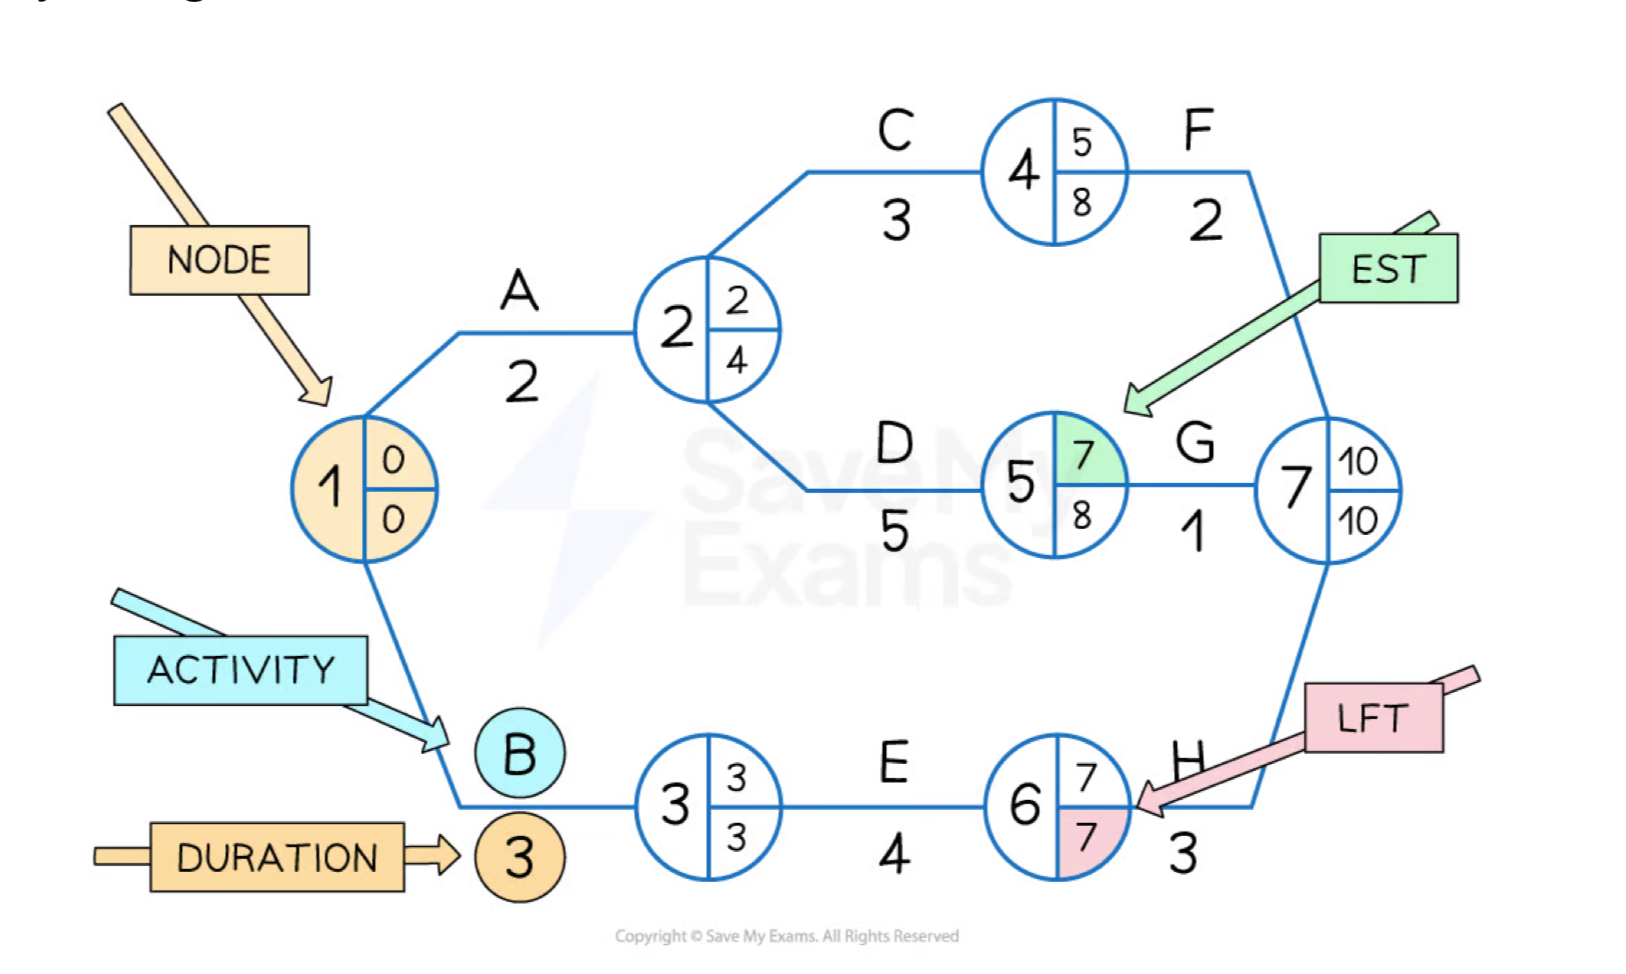
Critical path analysis
A project management tool that uses network analysis to plan complex and time-sensitive projects ~ involves construction of a visual model of project
Key elements of critical path analysis
List of all activities required to complete the project
Time that each activity will take to complete
How each project activity depends on others
Critical path analysis shows:
Order in which activities must be completed
Longest path of project activities to completion of project
Earliest and latest that each project activity can start and finish
The critical project activities which if delayed will cause project as whole to over-run
Shortest time possible to complete project
Network Analysis Diagram
EST: Earliest Start time (EST of previous activity + duration) ~ left to right
LFT: Latest Finish time (Latest finishing time - duration) ~ right to left
Simple Linear Regression
A statistical tool used to study the nature of relationships between 2 variables ~ used to make predictions and strategic decisions