AQR sem 2 1st 6 weeks
1/13
There's no tags or description
Looks like no tags are added yet.
Name | Mastery | Learn | Test | Matching | Spaced | Call with Kai |
|---|
No analytics yet
Send a link to your students to track their progress
14 Terms
Which choice can be used to fill in the blanks in the correct order?
In the scatterplot, third exam score is called the __________ and final exam score is called the __________.
explanatory; response
Suppose researchers wanted to study the effects of two different types of exercise on participant's heart health. On the x-axis the scatterplot shows the number of minutes of exercise per week and the y-axis shows the percentage of participants who had a heart attack in the next five years. Participants shown with plus signs only jogged and participants shown as boxes only jumped rope.
Select all of the statements that accurately describe the results.
The best fit line for jumping rope is more steep than the best fit line for jogging.
Jumping rope and heart attacks have a negative association
By compiling data reports, Hans Rosling discovered that when a country's population becomes more wealthy their average life expectancy rises also.
Based on the information above, can you say that increased wealth causes an increased life expectancy?
No, because we were not told this data came from a controlled experiment.
Which of these could represent variables that are have no correlation but are still related in some way?
r = 0 and data fit a non-linear model.
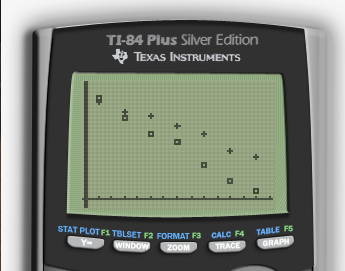
Which of these is the best approximation of the correlation coefficient for the data below?

0
Which of these describes variables that are have a correlation coefficient r = 0, but are still related in some way?
While driving, the stopping distance increases with the square of your velocity.
A regression was run to determine whether there is a relationship between hours of TV watched per day (x) and number of sit-ups a person can do (y). The results of the regression are given below.
Equation format: | a = | b = | r = |
y = ax + b | –1.341 | 32.234 | –0.896 |
Which of these are reasonable predictions based on the regression results shown above?
I. 5 hours and 26 sit-ups
II. 10 hours and 12 sit-ups
III. 15 hours and 12 sit-ups
1 and 3
Which of these describes when it is appropriate to generalize the results of a study to a larger population?
An experiment where participants are randomly selected from a large population.
Read the situation below.
Suppose a local school district wishes to survey the parents of the school to determine what kinds of lunches the parents would like the schools to serve to the students. The school district randomly selects 100 students and calls their parents between the hours of 11:00 am and 2:00pm.
Which of these is an issue regarding the generalizability of the results?
The results are biased because the survey was only done during a time of day when many parents might not be available.
3. Suppose that a study shows that students who have high attendance rates are more likely to graduate high school in four years or less.
A local politician proposes dedicating city funds to pay students $10 for every week they earn perfect attendance.
Which of these is a likely issue with the politician's proposal?
Student effort is a possible lurking variable that could effect the graduation rate.
Consider a news headline like the one below:
New study finds students who take advanced classes in high school are more likely to attend college. |
Based on this headline, a school administrator decides to require more students to take advanced classes at their high school. Which of these is a likely issue with the administrator’s proposal?
Other factors, like ability level, might lead to taking advanced classes and attending college.
Suppose that one of your cousins is a teacher and she is considering moving to Texas. She finds an article online showing that three hundred high-school teachers in New York state were chosen at random and surveyed asking about their salary and their job satisfaction. The results show that the mean salary was about $81,000 per year and the mean job satisfaction was a 3.7 on a 5 point scale.
Your cousin decides to move to Texas and she predicts that she should be offered a salary around $81,000.
Did your cousin make a fair conclusion based on the survey?
No, because she generalized the results to the wrong population.
Sample Sizes and Margin of Error Report for Technology Trends Conducted by UTHS, April 1-June 30, 2014 | |||
| Percent of Sample | Sample Size | Margin of Error |
Cell Phone | 81% | 542 | 4.5 percentage points |
Tablet | 38% | 601 | 6.1 percentage points |
Which of these best explains why there would be a margin of error reported in the results above?
Sampling techniques can only provide an approximate interval but they cannot be used to predict a specific result that matches the population exactly.
Which of these best describes the range of likely percentages for tablet users?
31.9% to 44.1%