Food chains / Food webs
1/5
There's no tags or description
Looks like no tags are added yet.
Name | Mastery | Learn | Test | Matching | Spaced | Call with Kai |
|---|
No analytics yet
Send a link to your students to track their progress
6 Terms
Food chains
show the feeding relationships between organisms in a certain area or habitat.
Always start with producer
Each organism occupies a trophic level
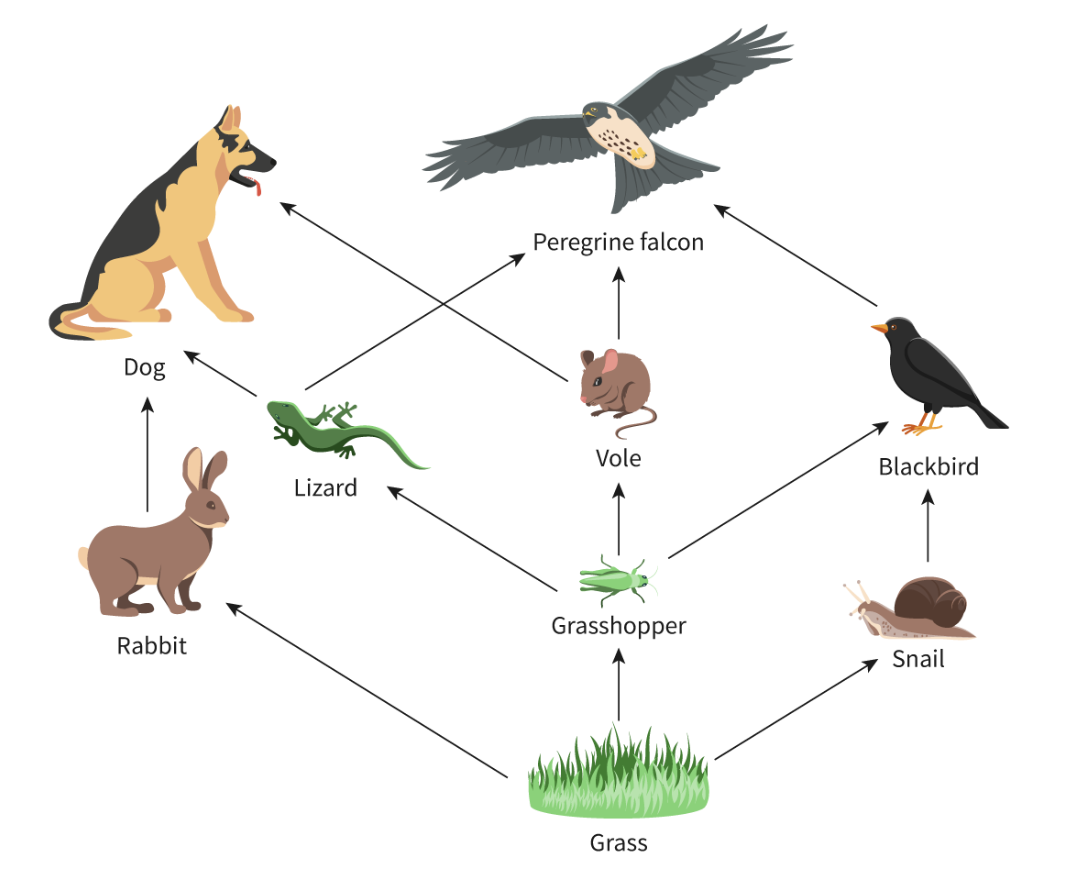
Food web
made up of overlapping food chains, gives us a better picture of the relationships between organisms in a community and the different pathways that energy and nutrients can take as they flow through an ecosystem
Factors that affect energy and organic matter loss
incomplete consumption:
inefficient digestion —> waste of biomass
inefficient energy conversion and storage
use in
metabolic processes
: Organisms use energy for their own metabolic processes, including respiration, movement, and growth.
heat loss:
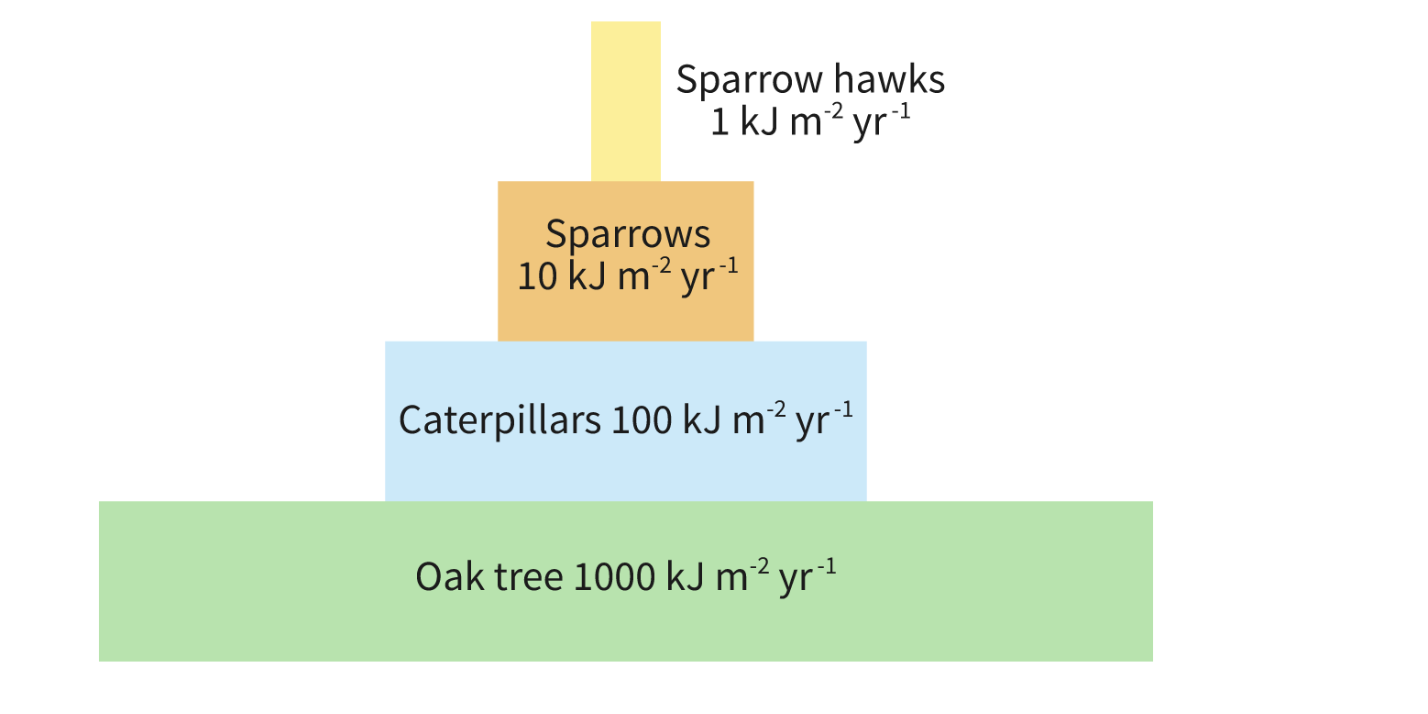
Ecological pyramids
demonstrate the trophic levels in an ecosystem, by representing the relative numbers of organisms, biomass, or energy.
pyramid of biomass
represents the biomass of organisms at each trophic level in mass per unit of area or g m–2 (grams per metre squared). Typically, these pyramids exhibit a pyramid shape, reflecting the decreasing biomass along food chains due to the release of CO2 and waste
Pyramid of energy
indicates the amount of energy flowing through the ecosystem at each trophic level. This shows the flow of energy over a period of time and represents the amount of energy that is available to each trophic level.
kJ m-2 yr-1.