Topic 8: Human Populations
0.0(0)
Studied by 2 peopleCard Sorting
1/20
Last updated 4:13 PM on 4/25/23
Name | Mastery | Learn | Test | Matching | Spaced | Call with Kai | Chat |
|---|
No analytics yet
Send a link to your students to track their progress
21 Terms
1
New cards
consequences of exponential growth
* increased demand for food/water/land
* demand for food → raising livestock → deforestation
* loss of habitat endangers species
* loss of forest degrades air/water quality
* congested areas promote spread of disease
* more pollutants released
* more waste generated
* demand for food → raising livestock → deforestation
* loss of habitat endangers species
* loss of forest degrades air/water quality
* congested areas promote spread of disease
* more pollutants released
* more waste generated
2
New cards
crude birth rate (CBR)
number of live births per 1,000 people in a population per year
CBR = births / population \* 1,000
CBR = births / population \* 1,000
3
New cards
crude death rate (CDR)
number of live deaths per 1,000 people in a population per year
CDR = deaths / population \* 1,000
CDR = deaths / population \* 1,000
4
New cards
natural increase rate (NIR)
rate of population growth, not accounting for immigration of emigration; percentage
NIR=(CBR−CDR)/10
NIR=(CBR−CDR)/10
5
New cards
doubling time (DT)
time (years) for a population to double
DT=70/NIR
DT=70/NIR
6
New cards
replacement level fertility
the number of children a couple must have to replace them (2.1)
7
New cards
total fertility rate (TFR)
estimate of the average number of children a woman will have per year, if she passes through her childbearing years conforming to the age-specific fertility rates of a given year
8
New cards
TFR > replacement level
population growth
9
New cards
TFR < replacement level
zero/negative growth
10
New cards
contributing factors to total fertility rate (TFR)
* urbanization
* increasing opportunities for women
* reduce infant mortality rate
* delay women’s age when she first gives birth
* pensions for retirees
* availability of abortions & birth control
* avoiding dogmatic religion & tradition statutes
* increasing opportunities for women
* reduce infant mortality rate
* delay women’s age when she first gives birth
* pensions for retirees
* availability of abortions & birth control
* avoiding dogmatic religion & tradition statutes
11
New cards
factors that reduce death rates:
* urbanization (more resources/medicine)
* better healthcare
* increased access to food
* sanitation and potable water
* better healthcare
* increased access to food
* sanitation and potable water
12
New cards
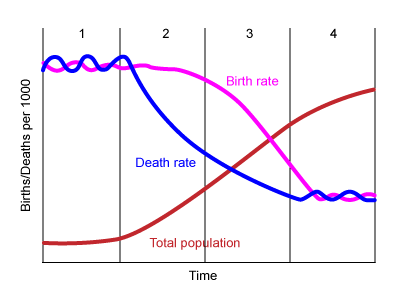
first stage of the demographic transition model (DTM)
* ex: a few remote groups
* CBR: high
* CDR: high
* increase: stable/slow
* reasons for changing birth rate:
* children work
* high infant mortality rate
* religion/societal pressures
* no family planning resources
* reasons for changing death rate:
* disease/famine
* little to no medical care
* CBR: high
* CDR: high
* increase: stable/slow
* reasons for changing birth rate:
* children work
* high infant mortality rate
* religion/societal pressures
* no family planning resources
* reasons for changing death rate:
* disease/famine
* little to no medical care

13
New cards
second stage of the demographic transition model (DTM)
* ex: Egypt, Kenya, India
* CBR: high
* CDR: falling rapidly
* increase: rapid
* reasons for changing birth rate:
* children work
* high infant mortality rate
* religion/societal pressures
* no family planning resources
* reasons for changing death rate:
* medical care
* good water/sanitation
* more children live
* CBR: high
* CDR: falling rapidly
* increase: rapid
* reasons for changing birth rate:
* children work
* high infant mortality rate
* religion/societal pressures
* no family planning resources
* reasons for changing death rate:
* medical care
* good water/sanitation
* more children live
14
New cards
third stage of the demographic transition model (DTM)
* ex: Brazil
* CBR: falling
* CDR: falls slowly
* increase: slower
* reasons for changing birth rate:
* more medicine/food
* reasons for changing death rate:
* medical care
* good water/sanitation
* more children live
* CBR: falling
* CDR: falls slowly
* increase: slower
* reasons for changing birth rate:
* more medicine/food
* reasons for changing death rate:
* medical care
* good water/sanitation
* more children live

15
New cards
fourth stage of the demographic transition model (DTM)
* ex: US, Japan, UK
* CBR: low
* CDR: low
* increase: stable/slow
* reasons for changing birth rate:
* urbanization
* healthcare
* family planning
* reasons for changing death rate:
* healthcare
* reliable food source
* CBR: low
* CDR: low
* increase: stable/slow
* reasons for changing birth rate:
* urbanization
* healthcare
* family planning
* reasons for changing death rate:
* healthcare
* reliable food source

16
New cards
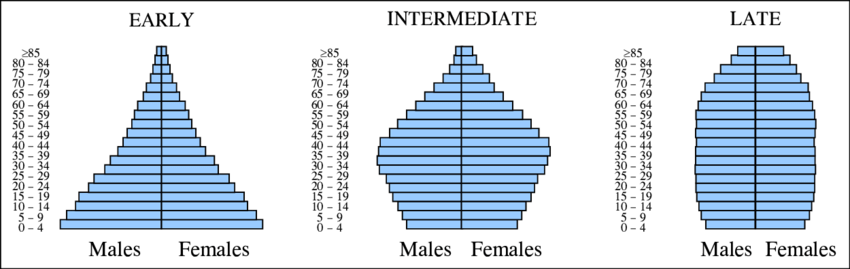
age-gender pyramids
shows the proportion of the population, by sex, at each for different age levels
17
New cards
How do predictions made about population growth by age structure diagrams influence economic decisions?
* pensions
* social security
* job competition
* more people = more consumers = greater need for jobs
* large population provides a taxable base for supporting retirees
* more people = greater environmental footprint
* social security
* job competition
* more people = more consumers = greater need for jobs
* large population provides a taxable base for supporting retirees
* more people = greater environmental footprint
18
New cards
factors contributing to population growth
* universal access to family planning
* better healthcare for pregnant women/children
* equality- more opportunities for women
* increased access to education
* increased involvement in child-rearing for men
* eradicate poverty
* sustainable use of natural resources
* cultural attitudes about family size
* government policies
* better healthcare for pregnant women/children
* equality- more opportunities for women
* increased access to education
* increased involvement in child-rearing for men
* eradicate poverty
* sustainable use of natural resources
* cultural attitudes about family size
* government policies
19
New cards
abiotic factors
* light
* temperature
* nutrient level
* temperature
* nutrient level
20
New cards
biotic growth factors
* high reproductive rates
* generalized niche
* adequate food supply
* suitable to habitat
* ability to compete for resources
* ability to hide/defend from predators
* ability to migrate/live in other habitats
* ability to adapt to environmental change
* generalized niche
* adequate food supply
* suitable to habitat
* ability to compete for resources
* ability to hide/defend from predators
* ability to migrate/live in other habitats
* ability to adapt to environmental change
21
New cards
biotic decrease factors
* low reproductive rate
* specialized niche
* inadequate food supply
* unsuitable/destroyed habitat
* too many competitors
* can’t run/hide from predators
* can’t resist disease/parasites
* can’t migrate
* can’t adapt to environmental change
* specialized niche
* inadequate food supply
* unsuitable/destroyed habitat
* too many competitors
* can’t run/hide from predators
* can’t resist disease/parasites
* can’t migrate
* can’t adapt to environmental change