im gonna kms
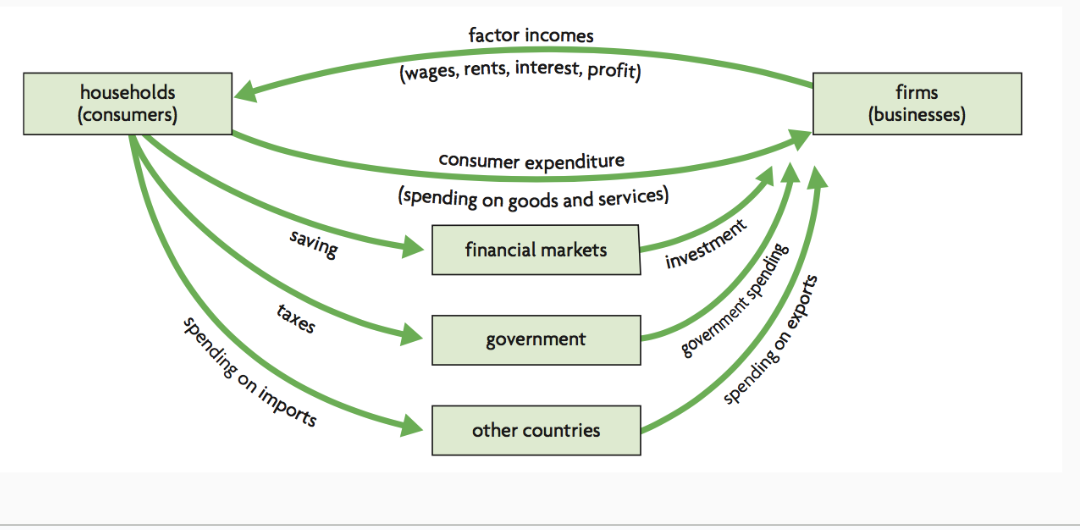
The circular flow model —including leakages and injection
is a good representation of a national ecnomy and its total income
Gross Domestic Product (GDP) is
the total value of all goods and services produced in a country in one year
there are three ways to measure GDP
The Output Method, The Income Method and The Expenditure Method
The output method is done by
adding up the value of all goods services produced by all firms in an economy
The income method is done by
adding up the value incomes in the economy (wages, rents, interest, profits)
The expenditure method is done by
measuring the value of spending on all goods and services in the economy by adding up the spending of all sectors GDP = C+I+G+(X-M)
Nominal GDP (NGDP) represents
the GDP value at current prices (which includes inflation)
Real GDP (RGDP) represents
the GDP value that accounts for price changes over time (excludes inflation)
to calculate Real GDP
RGDP = (NGDP/price deflator) x 100
The GDP deflator is a
price index that measure a change in price relative to a base year
GDP deflator =
(NGDP/RGDP) x 100
the index number for the base year always equals to
100
Gross National Income (GNI)
measures total income recieved by residents of a country
GNI =
GDP + net income from abroad
Real GNI =
(Nominal GNI/price deflator) x 100
GNI price deflator =
(Nominal GNI/Real GNI) x 100
GDP per capita =
GDP/population
National Income Statistics are important because they
help a country measure its economic growth (or contraction)
help compare different countries
help governments shape economic policies
Shortcomings of GDP/GNI are
GDP/GNI do not include ‘non-marketed’ output
GDP/GNI do not include goods/services sold in underground/parallel markets
GDP/GNI do not account for negative externalities
Purchasing Power Parity (PPP)
compares the purchasing power of a country’s currency based on a “basket of goods”
economic well-being can be measured with the
OECD Better Life Index
Happiness Index
Happy Planet Index
the OECD Better Life Index compares the well-being of different countries based on
Material living conditions
quality of life
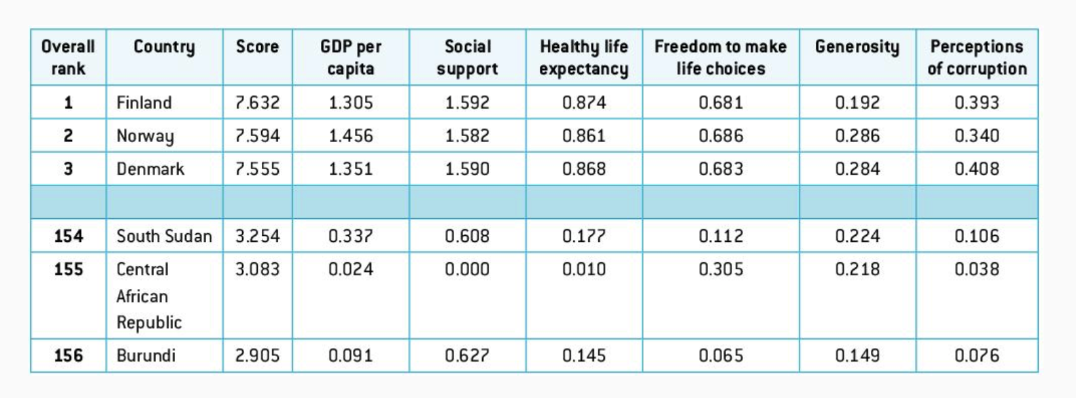
The happiness Index measures well-being
based on the dimension identified on the table below
Happy Planet Index (HPI) measures
sustainable well-being, concerned with ‘happiness’ of the planet
weights wellbeing, life expectancy and inequality against an ‘ecological footprint”
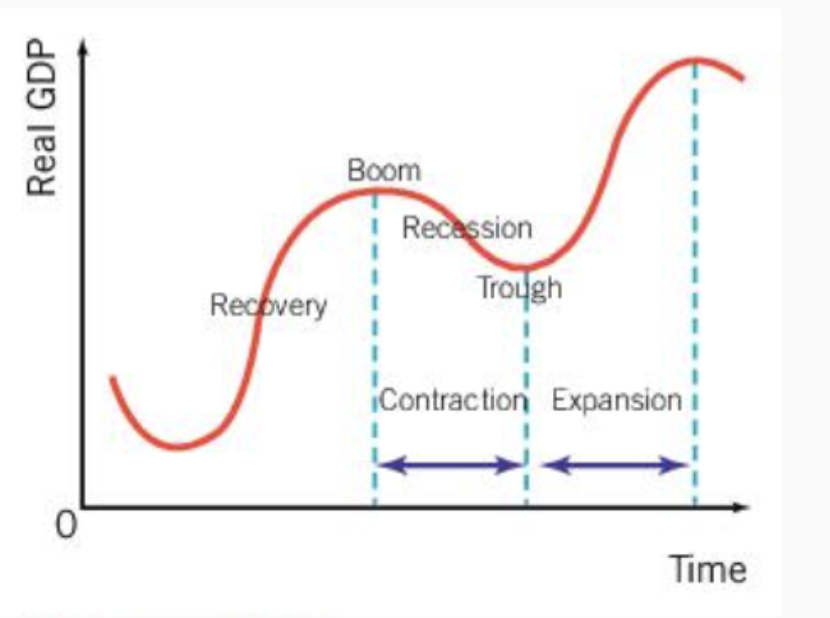
The Business Cycle represents
fluctuations in economic activity measured by changes in GDP
there are 4 stages of the business cycle
Recovery/Expansion
Boom/Peak
Recession
Trough
the Recovery/Expansion stage of the business cycle is
economic expansion driven by an increase in aggregate (total) demand (AD)
employment increases along with incomes, resulting in increased spending and saving
the Boom/Peak stage of the business cycle is
the economy reaches its maximum potential output
increased AD results in inflationary pressure on prices
the Recession stage in the business cycle is
two consecutive quarters of negative GDP growth
AD falls, resulting in increased unemployment, reduced spending, and lower inflation
the Trough stage of the business cycle is
the End of economic contraction
AD will being to increase, lower interest rates will encourage borrowing and spending, and the economy will start to improve
(The Business Cycle) long-term growth
the long-term growth trend line represents economic output that excludes cyclical fluctuations
this output represents the potential output or potential GDP
(The business Cycle) the potential output is the
level of output produced when there is a full employment, or, the natural rate of unemployment
Aggregate Demand (AD) is
the total spending on goods and services in a given time at a given price level
The AD curve represents
GDP since it is made up of C+I+G+(X-M)
Components of Aggregate Demand (AD) (Consumption)
Changes in income taxes
Changes in interest rates
Changes in wealth
Changes in consumer confidence/expectations
Components of Aggregate Demand (AD) (Investment)
Changes in the interest rates
Changes in business taxes
Technological changes
Changes in business confidence/expectations
Components of Aggregate Demand (AD) (Government Spending)
More government spending means increased AD and vice versa
Components of Aggregate Demand (AD) (Exports and Imports)
Changes in export levels:
increased foreign incomes
Currency appreciation
Short Run Aggregate Supply (SRAS) is
the total amount of goods and services produced by all industries in the economy in a given period at every price level
(SRAS) short run is defined as
a time period when the prices of the factors of production do not change (price of labor is fixed)
Components of Short Run Aggregate Supply (SRAS) are
supply-side shocks, such as
A change in wage rates
a change in the cost of raw materials
a change in government subsidies or indirect taxes
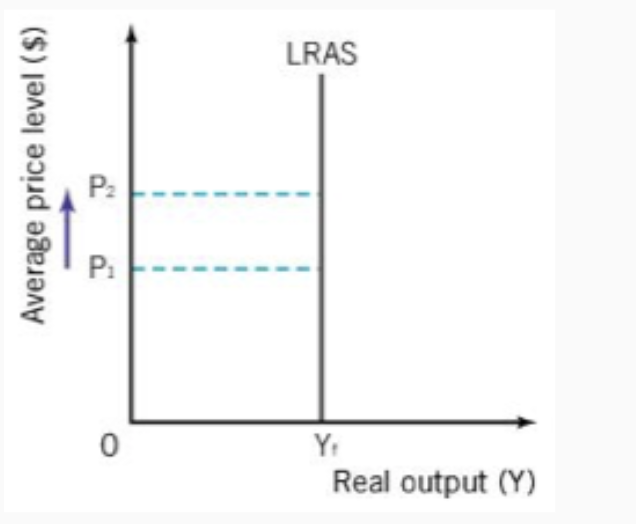
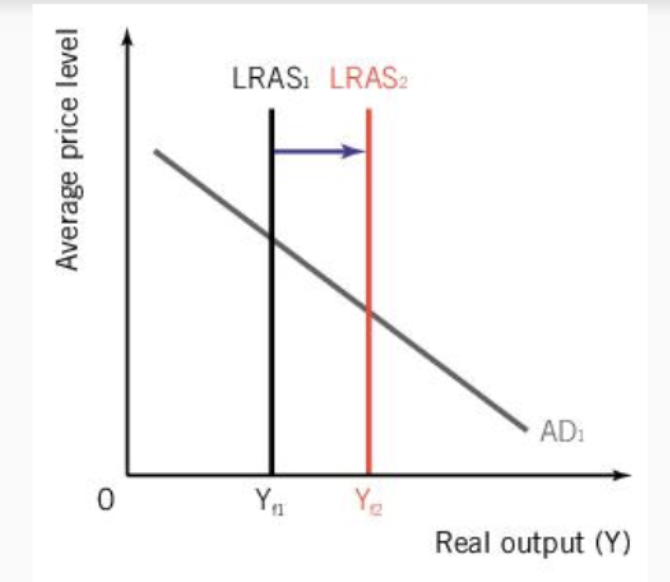
Long-run Aggregate Supply (LRAS) New Classical LRAS)
the LRAS is perfectly inelastic at full employment in the economy
the LRAS curve represents
the potential output if the economy operates at full capacity and is labeled as Y1
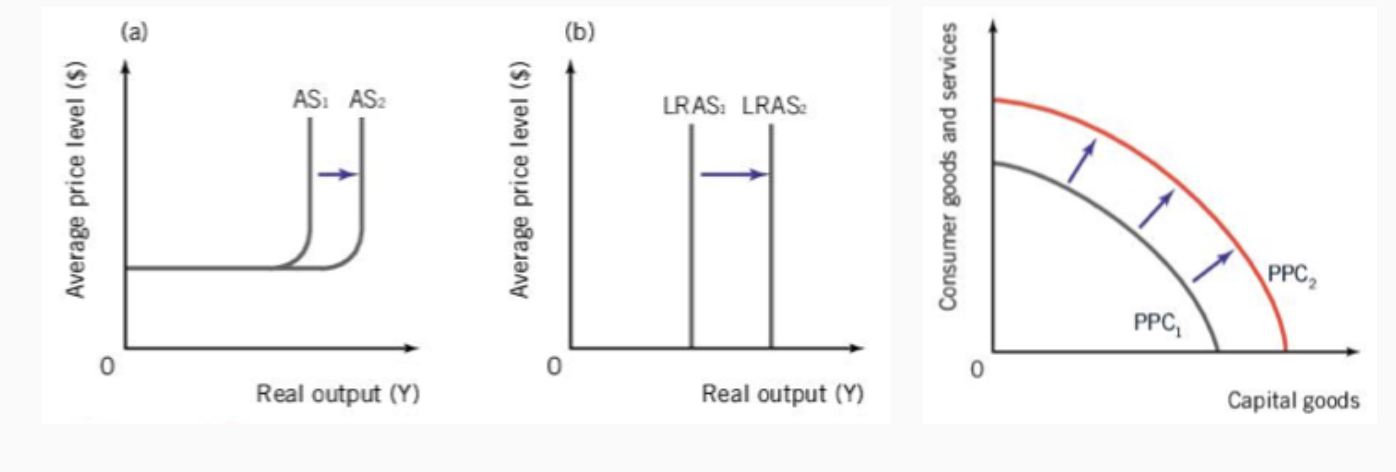
(Economic Growth) because the LRAS/AS curve represents the factors of production
only a change in the quantity and quality of the factors of production will shift the LRAS/AS
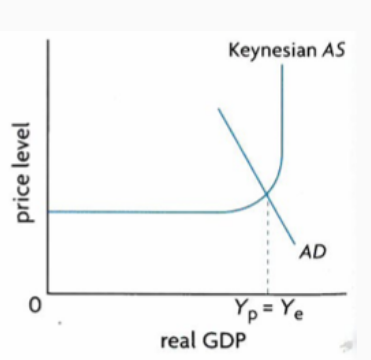
(Economic Growth) the LRAS/Keynesian AS curve is
the same thing as the PPC
Economic Growth is
an increase in real GDP over time
in the long run, economic growth is represented by
an increase in the quality and/or quantity of the factors of production
Potential Output is represented by the
PPC curve and full utilization of the factors of production in an economy
Actual output represents
the economy’s current output/production level
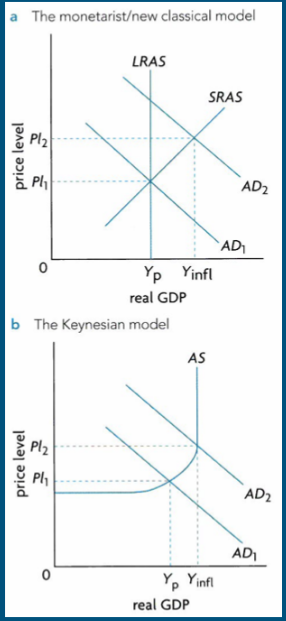
New Classical Model (Key Assumptions)
wages, prices and interest rates are flexible and set by the market
the SRAS “self-corrects”
output eventually returns to Ye (full employment)
LRAS is perfectly inelastic
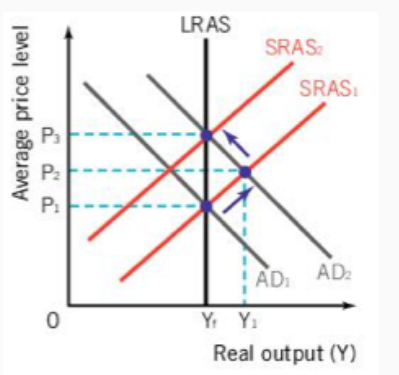
(New Classical Model) this is an
inflationary gap
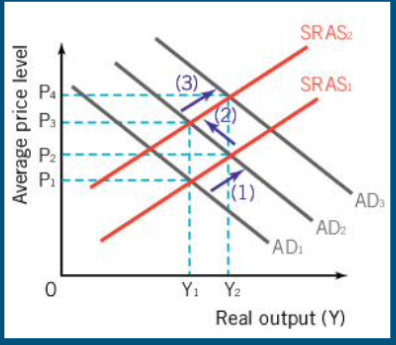
in an inflationary gap
AD increases, leading to higher average prices and increased output
Output is greater than the full employment level of output; prices are higher because firms are now competing for scarce labour and capital resources
Because prices and costs for firms are now higher, SRAS is reduced and macroeconomic equilibrium is reestablished at a higher price level
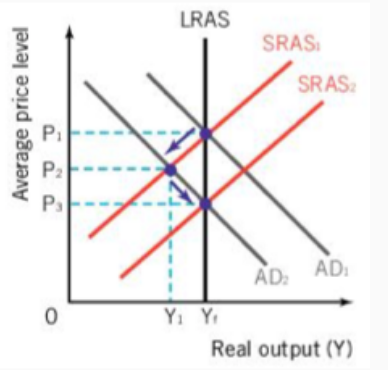
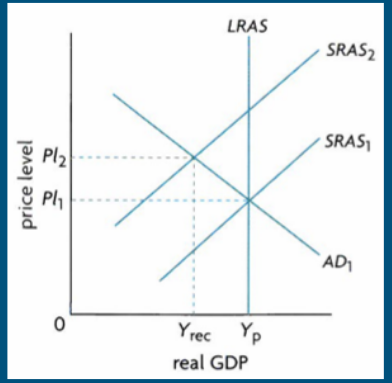
(New Classical Model) this is an
Deflationary (recessionary) gap
in a Deflationary (recessionary) gap
AD decreases, leading to lower average prices and reduced output
Output is less than the full employment level of output, as factors of production are being underutilized; as a result, prices are lower
Because prices and costs for firms are now lower, SRAS increases as firms increase their output and macroeconomic equilibrium is reestablished at a lower price level
Keynesian Model (Key assumptions)
Wages are rigid or “sticky” in the short term, will not rise or fall
Prices are also “sticky” and inflexible downwards
Inability of the economy to move into the long run without government intervention to shift AD
Economic growth is based on encouraging spending
Keynesian AS can be seperated into three phases
Phase 1
AS is perfectly elastic at low levels of economic activity
Price levels don’t increase as output increases because of unused factors of production (“spare capacity”)
Wages and prices do not fall easily (“sticky” wages/prices: labor/purchase contracts, rental agreements, minimum wages laws, etc.), so the economy gets stuck in the short run
Phase 2
As the economy reaches its potential output (Yf), price levels (and costs) increase as factors of production become increasingly scarce
Phase 3
At full capacity, all factors of production are employed: price levels increase, but output cannot increase
Equivalent to new classical LRAS
(Keynesian Model) an inflationary gap is
If the economy is operating at full employment and AD increases, there is only an increase in price level (P1 → P2) and no increase in output, since all of the available factors of production are being utilized.
(keynesian model) an inflationary gap is
when Equilibrium level of output is below the full employment level of output, resulting in an output gap
Inflation is
a persistent increase in the average price level in the economy over time
the costs of high inflation are
Loss of purchasing power
saving is disincentivized
stifles economic growth
(Inflation) winners
people with index-linked incomes, borrowers, asset owners
(Inflation) losers
People on fixed incomes, savers/lenders, hoarders of cash
inflation is measured by creating a price index using a “basket” of consumer goods, and then calculating the change in the index price from month to month. this is called the
Consumer Price Index (CPI)
the basket includes items like
rent, healthcare, certain foods, transportation, household items, etc
the goods in the basket are weighted
as some goods take up a higher percentage of income than others
problems with measuring inflation are
the CPI represents spending habits of a “typical” household
Different rates of inflation for different income earners
basket items change to account for changing consumption patterns
Demand-Pull inflation
inflation due to increasing AD as a result of any changes in the components of AD (C/I/G/X/M)
associated with an inflationary gap
Cost-Push inflation
inflation due to increase in costs of production or “supply shocks”]#
can only be represented by the new classical AD/AS model, Keynesian model cannot account for short-run fluctuations of AS
also used to represent stagflation
An inflationary spiral
inflation can perpetuate itself when Demand-pull and cost-push inflation occur together
Hyperinflation occurs
when price level increases more that 50% in one month
“stagflation” (economic stagnation + inflation)
is a combination of high unemployment and inflation
Disinflation is
a falling rate of inflation (it is not deflation)
is there an ideal level of inflation
no, but governments aim for 2-3% inflation rate
Deflation is a
persistent decrease in the average price level of economy
Deflation rarely occurs for two reasons
wages often do not fall
oligopolistic firms may fear price wars, which make all firms worse off
deflation can be categorized as
good or bad
“good” deflation
occurs as a result of improvements in the supply side of the economy, usually increased productivity
outward shift of the LRAS
“bad” deflation
Occurs as a result of reduced AD
reduced output = higher unemployment
the costs of “bad” deflation are
higher unemployment
less investment
reduced spending
Unemployment refers to
people who are working part time when they would rather work full time
people who are working jobs that do not make full use of their skills and education
problems with measuring unemployment are
hidden unemployment exists in many forms
employment figures dont account for differences between different population groups in a society
Costs of unemployment are (economic costs)
loss of tax revenue to government
increased costs to the government because of unemployment benefits
more unequal distribution of income (the unemployed get poorer and the employed maintain their income)
Costs of unemployment (social costs)
increased crime, violence and social unrest
increased homelessness, substance addiction and poverty rates
Costs of unemployment (personal costs)
loss of income results in increased indebtedness
increased levels of domestic violence
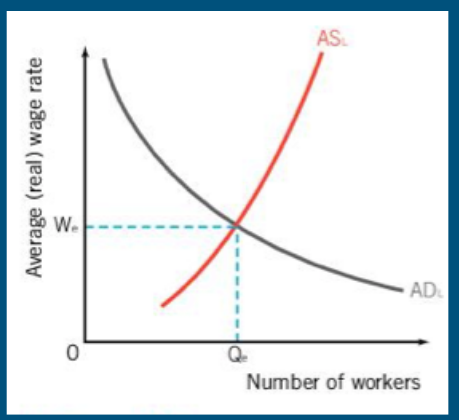
Graphing unemployment is done by
the labour market diagram
there are four types of unemployment
structural, frictional, seasonal and cyclical
structural unemployment occurs because of
changes in demand for particular types of labor skills
changes in geographical location of jobs
labor market rigidities
structural unemployment can cause
mismatches between labor demand and supply can result in reduced demand for labor
labor market rigidities will either lead to
a labor surplus
or an increase in the cost of production
frictional unemployment occurs
when workers are between jobs
seasonal unemployment occurs
when the demand for labor in certain industries changes on a season basis
when cyclical unemployment occurs
when a downturn of the business cycle occurs, a recession
the natural rate of unemployment is done by combining
seasonal + structural + frictional = natural rate of unemployment
in a deflationary gap (recession), inflation is low but
cyclical unemployment is high
in a inflationary gap, inflation is high but
unemployment falls below the natural rate
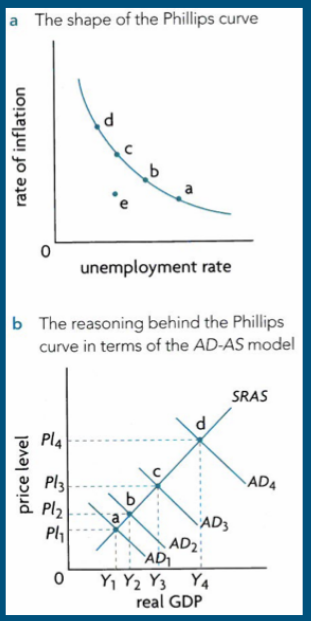
the short-run Philips curve illustrates
the negative (inverse) relationship-or trade off—between the rate of inflation and the unemployment rate
to show stagflation on the Phillips curve
the short-run Phillips curve shifts outward to show stagflation
the long run Phillips curve is
perfectly inelastic at the level of full employment, or, the natural rate of unemployment, which is the long-run equilibrium
Economic growth refers to an
increase in real GDP
short-term economic growth is characterized by
shifts in the SRAS or AD (actual output)